Emergency Department Visit Rates by Selected Characteristics: United States, 2020
NCHS Data Brief No. 452, November 2022
PDF Version (430 KB)
- Key findings
- What was the ED visit rate in 2020, and did visit rates vary by age group?
- What were ED visit rates by sex and race and ethnicity, and did these rates vary?
- What were the ED visit rates for each primary expected source of payment, and did these rates vary?
- What percentages of ED visits were related to COVID-19?
- Summary
Data from the National Hospital Ambulatory Medical Care Survey
- The overall emergency department (ED) visit rate was 40 visits per 100 people in 2020.
- The ED visit rate was highest for infants under age 1 year (68 visits per 100 infants), followed by adults aged 75 and over (63 per 100 people).
- The ED visit rate for non-Hispanic Black or African-American people (70 visits per 100 people) was highest compared with other racial and ethnic groups.
- The ED visit rate for patients with private insurance was lowest, while the rate for patients with Medicaid, Children’s Health Insurance Program, or other state-based programs was highest compared with all other primary expected sources of payment.
- Of all ED visits in 2020, 6.7% had a mention of COVID-19.
In 2020, an estimated 131 million emergency department (ED) visits occurred in the United States, with 19.0% of adults reporting a visit and 4.7% of children reporting two or more visits in the past 12 months (1–3). In that time, over 20 million cases of COVID-19 caused a disruption in access to and use of care (4). This report presents characteristics of ED visits, including those with mentions of COVID-19, by age group, sex, race and ethnicity, and primary expected source of payment, using data from the 2020 National Hospital Ambulatory Medical Care Survey (NHAMCS) (5).
Keywords: COVID-19, emergency care, patient characteristics, National Hospital Ambulatory Medical Care Survey
What was the ED visit rate in 2020, and did visit rates vary by age group?
- An estimated 131 million ED visits occurred in 2020, with a total ED visit rate of 40 visits per 100 people (Figure 1).
- The ED visit rates for infants under age 1 year (68 visits per 100 infants) and adults aged 75 and over (63 visits per 100 people) were higher compared with all other age groups.
- The ED visit rate for children aged 1–17 years (29 visits per 100 children) was lower than the rates for all adult age groups.
- ED visit rates were similar for adults aged 18–74, ranging from 39 to 43 visits per 100 people.
Figure 1. Emergency department visit rate, by age group: United States, 2020
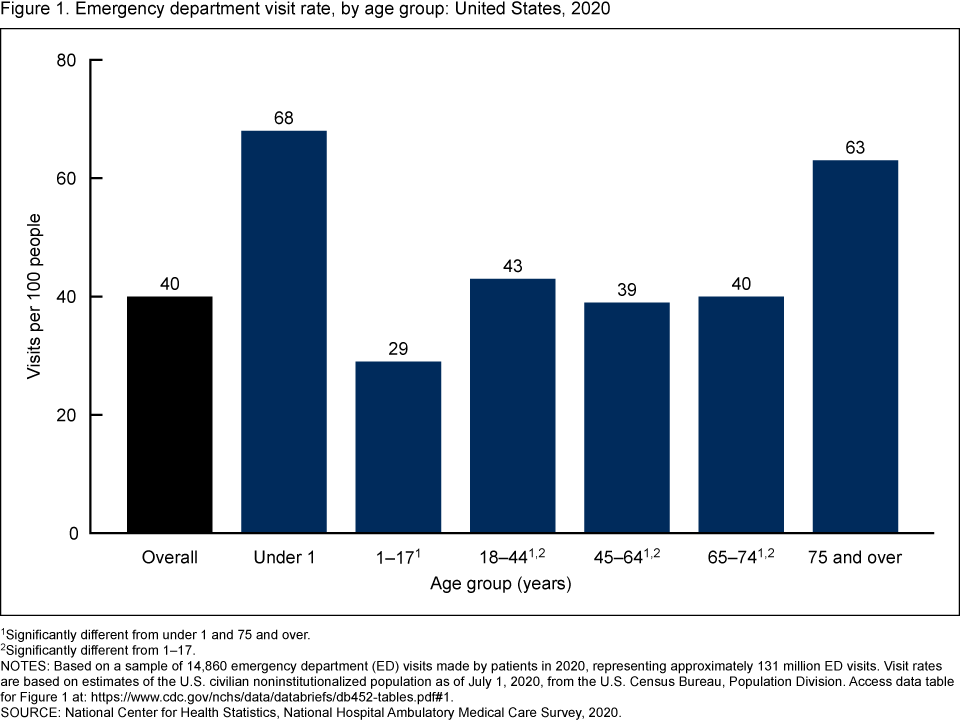
1Significantly different from under 1 and 75 and over.
2Significantly different from 1–17.
NOTES: Based on a sample of 14,860 emergency department (ED) visits made by patients in 2020, representing approximately 131 million ED visits. Visit rates are based on estimates of the U.S. civilian noninstitutionalized population as of July 1, 2020, from the U.S. Census Bureau, Population Division. Access data table for Figure 1.
SOURCE: National Center for Health Statistics, National Hospital Ambulatory Medical Care Survey, 2020.
What were ED visit rates by sex and race and ethnicity, and did these rates vary?
- The 2020 ED visit rates for females (42 visits per 100 people) and males (39) were similar (Figure 2).
- In 2020, the ED visit rate was highest for non-Hispanic Black or African-American people (70 visits) compared with non-Hispanic White (39), Hispanic or Latino (34), and non-Hispanic people of other races (20).
Figure 2. Emergency department visit rate, by sex and race and ethnicity: United States, 2020
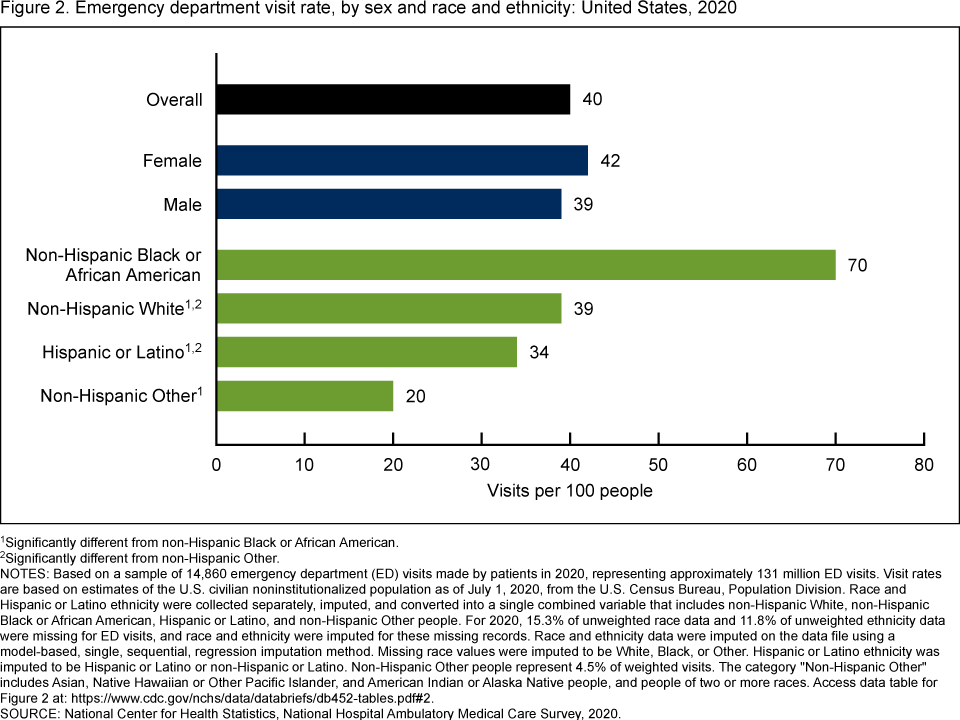
1Significantly different from non-Hispanic Black or African American.
2Significantly different from non-Hispanic Other.
NOTES: Based on a sample of 14,860 emergency department (ED) visits made by patients in 2020, representing approximately 131 million ED visits. Visit rates are based on estimates of the U.S. civilian noninstitutionalized population as of July 1, 2020, from the U.S. Census Bureau, Population Division. Race and Hispanic or Latino ethnicity were collected separately, imputed, and converted into a single combined variable that includes non-Hispanic White, non-Hispanic Black or African American, Hispanic or Latino, and non-Hispanic Other people. For 2020, 15.3% of unweighted race data and 11.8% of unweighted ethnicity data were missing for ED visits, and race and ethnicity were imputed for these missing records. Race and ethnicity data were imputed on the data file using a model-based, single, sequential, regression imputation method. Missing race values were imputed to be White, Black, or Other. Hispanic or Latino ethnicity was imputed to be Hispanic or Latino or non-Hispanic or Latino. Non-Hispanic Other people represent 4.5% of weighted visits. The category “Non-Hispanic Other” includes Asian, Native Hawaiian or Other Pacific Islander, and American Indian or Alaska Native people, and people of two or more races. Access data table for Figure 2.
SOURCE: National Center for Health Statistics, National Hospital Ambulatory Medical Care Survey, 2020.
What were the ED visit rates for each primary expected source of payment, and did these rates vary?
- The ED visit rate was highest for patients with Medicaid, Children’s Health Insurance Program (CHIP), or other state-based programs (85 visits per 100 people) and lowest for patients with private insurance (18) (Figure 3).
- The ED visit rate for patients with Medicare (47 visits) was higher compared with rates among uninsured patients (33) and patients with other primary expected sources of payment (29).
Figure 3. Emergency department visit rate, by primary expected source of payment: United States, 2020
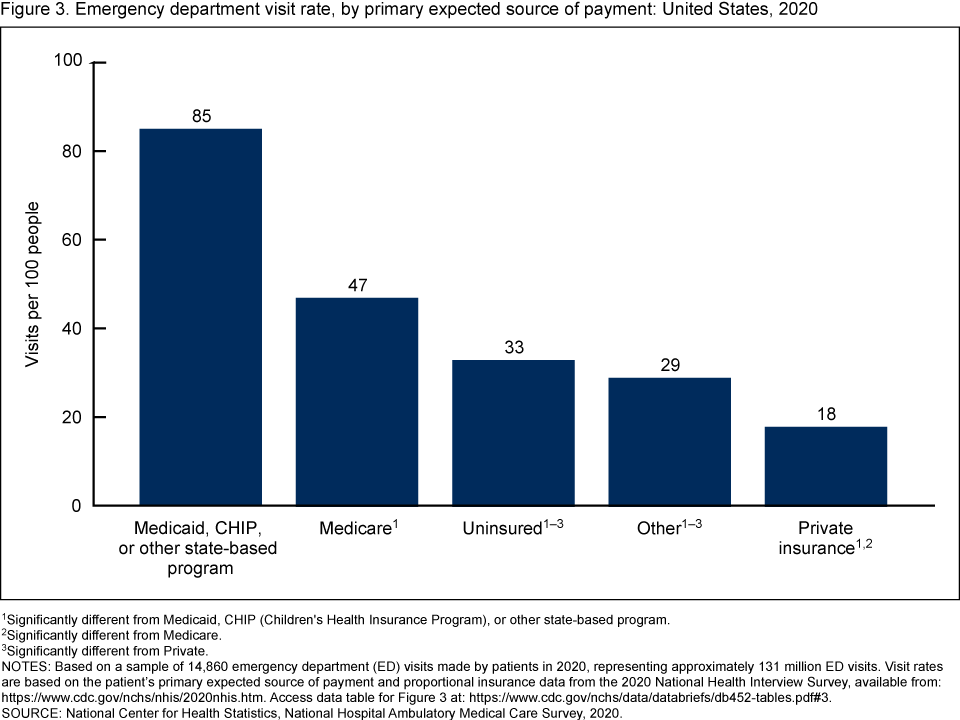
1Significantly different from Medicaid, CHIP (Children’s Health Insurance Program), or other state-based program.
2Significantly different from Medicare.
3Significantly different from Private.
NOTES: Based on a sample of 14,860 emergency department (ED) visits made by patients in 2020, representing approximately 131 million ED visits. Visit rates are based on the patient’s primary expected source of payment and proportional insurance data from the 2020 National Health Interview Survey. Access data table for Figure 3.
SOURCE: National Center for Health Statistics, National Hospital Ambulatory Medical Care Survey, 2020.
What percentages of ED visits were related to COVID-19?
- An estimated 6.7% of ED visits in 2020 had any mention of COVID-19 (Figure 4).
- From January through April 2020, the percentage of ED visits with a suspected case of COVID-19 was 0.3%.
- From April through December 2020, the percentage of ED visits with a confirmed case of COVID-19 was 1.8%.
- The percentage of ED visits with a COVID-19 test or screening was 3.3%.
- The percentage of ED visits with other mentions of COVID-19, including visits by patients with suspected exposure to COVID-19, was 1.8%.
Figure 4. Percentage of emergency department visits with mentions of COVID-19: United States, 2020
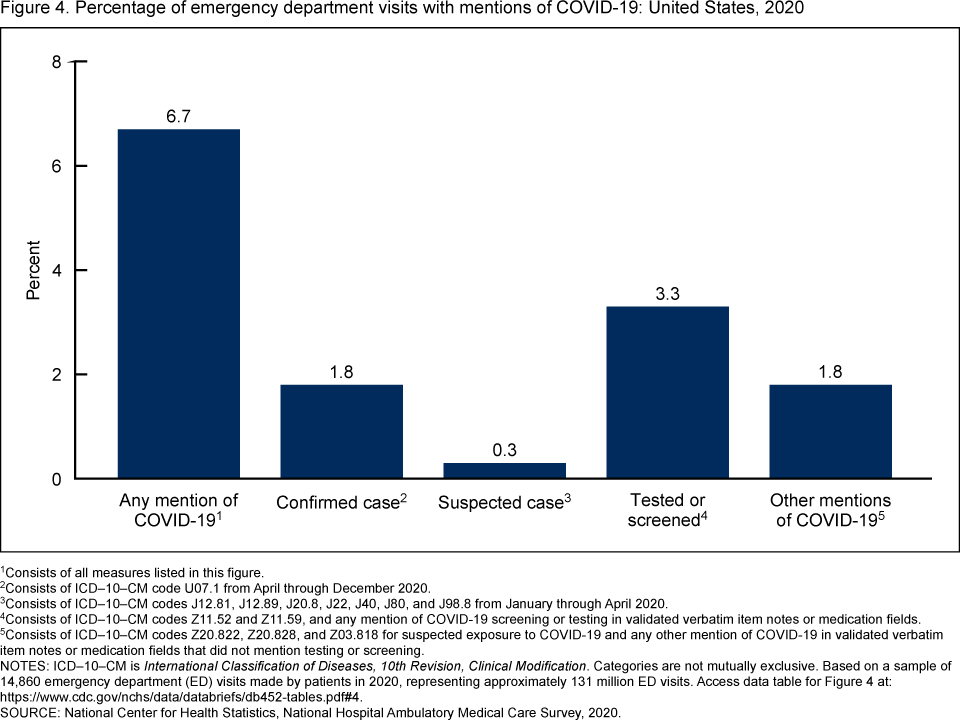
1Consists of all measures listed in this figure.
2Consists of ICD–10–CM code U07.1 from April through December 2020.
3Consists of ICD–10–CM codes J12.81, J12.89, J20.8, J22, J40, J80, and J98.8 from January through April 2020.
4Consists of ICD–10–CM codes Z11.52 and Z11.59, and any mention of COVID-19 screening or testing in validated verbatim item notes or medication fields.
5Consists of ICD–10–CM codes Z20.822, Z20.828, and Z03.818 for suspected exposure to COVID-19 and any other mention of COVID-19 in validated verbatim item notes or medication fields that did not mention testing or screening.
NOTES: ICD–10–CM is International Classification of Diseases, 10th Revision, Clinical Modification. Categories are not mutually exclusive. Based on a sample of 14,860 emergency department (ED) visits made by patients in 2020, representing approximately 131 million ED visits. Access data table for Figure 4.
SOURCE: National Center for Health Statistics, National Hospital Ambulatory Medical Care Survey, 2020.
Summary
In 2020, an estimated 131 million ED visits occurred, with a total ED visit rate of 40 visits per 100 people. The ED visit rates for both infants under age 1 year and adults aged 75 and over were higher than rates for all other age groups. The ED visit rate for non-Hispanic Black or African-American people was higher than the rates for people of all other racial and ethnic groups. The ED visit rate for patients with Medicaid, CHIP, or other state-based programs was highest compared with all other sources of payment, while the rate for patients with private insurance was lowest.
Data in this report show that in 2020, an estimated 6.7% of all ED visits had a mention of COVID-19. During the very early stages of the pandemic, before the International Classification of Diseases, 10th Revision, Clinical Modification (ICD–10–CM) diagnosis code for COVID-19 was created and implemented, approximately 0.3% suspected cases of COVID-19 were identified among ED visits, based on other existing codes. After implementation of the ICD–10–CM code U07.1 starting April 1, 2020, an estimated 1.8% of all ED visits from April through December were identified as a confirmed case of COVID-19. Additionally, 3.3% included a test or screening for COVID-19, and 1.8% were identified as a patient with suspected exposure to COVID-19 or included some other mention of COVID-19, not identified above.
Definitions
COVID-19 measures: These measures are not mutually exclusive because a patient may have been coded as both a confirmed and tested case, for example.
- Any mention of COVID-19: Consists of all other measures listed in the categories below.
- Confirmed case of COVID-19: Consists of any listed diagnosis with ICD–10–CM code U07.1. The code U07.1 was created and implemented starting April 1, 2020.
- Suspected case of COVID-19: Before the implementation of code U07.1, the following ICD–10–CM codes for any listed diagnosis were used to determine the percentage of ED visits with potential COVID-19 hospital encounters: J12.81, J12.89, J20.8, J22, J40, J80, and J98.8.
- Tested or screened for COVID-19: Consists of any listed diagnosis with ICD–10–CM codes Z11.52 and Z11.59 and any mention of COVID-19 testing or screening in validated verbatim item notes or medication fields.
- Other mentions of COVID-19: Consists of any listed diagnosis with ICD–10–CM codes Z20.822, Z20.828, and Z03.818 for suspected exposure to COVID-19 and any mention of COVID-19 in validated verbatim item notes or medication fields with no reference to testing or screening.
- The following ICD–10–CM codes related to COVID-19 were considered but not included in the analysis due to a lack of records in the data: B97.29 and Z86.16.
ED visit rates: Calculated by dividing the number of ED visits by estimates of the U.S. civilian noninstitutionalized population (obtained from the U.S. Census Bureau’s Population Division) for selected characteristics including age group, sex, and race and ethnicity. Visit rates for a patient’s primary expected source of payment are based on the patient’s primary expected source of payment and proportional insurance data from the 2020 National Health Interview Survey.
Primary expected source of payment: During data collection, all sources of payment were collected. For patients with more than one source of payment, the hierarchy below was used (with Medicare counted first and self-pay and no charge counted last) to combine payments into one mutually exclusive variable (primary expected source of payment).
- Medicare: Partial or full payment by Medicare plan includes payments made directly to the hospital and payments reimbursed to the patient. Charges covered under a Medicare-sponsored prepaid plan are included.
- Medicaid: Partial or full payment by Medicaid plan includes payments made directly to the hospital or reimbursed to the patient. Charges covered under a Medicaid-sponsored prepaid plan (health maintenance organization, for example), managed Medicaid, or CHIP and other state-based programs are included.
- Private: Partial or full payment by a private insurer (such as BlueCross BlueShield) includes payments made directly to the hospital or reimbursed to the patient. Charges covered under a private insurance-sponsored prepaid plan are included.
- Uninsured: Includes self-pay and no charge or charity. Self-pay is charges paid by the patient or patient’s family that will not be reimbursed by a third party. Self-pay includes visits for which the patient is expected to be ultimately responsible for most of the bill, even if the patient never actually pays it. This does not include copayments or deductibles. No charge or charity are visits for which no fee is charged (such as charity, special research, or teaching).
- Other: Includes worker’s compensation and other sources of payment not covered by the previous categories, such as TRICARE, state and local governments, private charitable organizations, and other liability insurance (such as automobile collision policy coverage).
Race and ethnicity: Race and Hispanic ethnicity were collected separately, imputed, and converted into a single combined variable that includes non-Hispanic White, non-Hispanic Black or African American, Hispanic or Latino, and non-Hispanic people of other races. The category “Non-Hispanic Other” includes Asian, Native Hawaiian or Other Pacific Islander, and American Indian or Alaska Native people, and people of two or more races. For 2020, 15.3% of unweighted race data and 11.8% of unweighted ethnicity data were missing for ED visits; race and ethnicity were imputed for these missing records. Race and ethnicity data were imputed on the data file using a model-based, single, sequential, regression imputation method. Missing race values were imputed to be White, Black, or Other. Hispanic or Latino ethnicity was imputed to be Hispanic or Latino or non-Hispanic or Latino.
Data source and methods
Data for this report are from NHAMCS, an annual nationally representative survey of nonfederal, general, and short-stay hospitals (5). NHAMCS provides data on the use and provision of ambulatory care services in hospital EDs. In 2020, the weighted NHAMCS response rate was 76.1%. Data analyses were performed using the statistical packages SAS version 9.4 (SAS Institute, Cary, N.C.) and SAS-callable SUDAAN version 11.0 (RTI International, Research Triangle Park, N.C.). Two-tailed t tests with a significance level of p < 0.05 were used to determine statistically significant differences between ED visit rates.
About the authors
Christopher Cairns and Jill J. Ashman are with the National Center for Health Statistics, Division of Health Care Statistics. J.M. King is with RELI Group, Inc.
References
- Cairns C, Kang K. National Hospital Ambulatory Medical Care Survey: 2020 emergency department summary tables. 2022.
- National Center for Health Statistics. Percentage of having a hospital emergency department visit in past 12 months for adults aged 18 and over, United States, 2020. Interactive summary health statistics for adults—2019–2021. Generated interactively: August 22, 2022
- National Center for Health Statistics. Percentage of two or more hospital emergency department visits in the past 12 months for children under age 18 years, United States, 2020. Interactive summary health statistics for children—2019–2021. Generated interactively: August 22, 2022.
- Centers for Disease Control and Prevention. COVID data tracker. 2022.
- National Center for Health Statistics. 2020 NHAMCS micro-data file. 2022.
Suggested citation
Cairns C, Ashman JJ, King JM. Emergency department visit rates by selected characteristics: United States, 2020. NCHS Data Brief, no 452. Hyattsville, MD: National Center for Health Statistics. 2022. DOI: https://dx.doi.org/10.15620/cdc:121837.
Copyright information
All material appearing in this report is in the public domain and may be reproduced or copied without permission; citation as to source, however, is appreciated.
National Center for Health Statistics
Brian C. Moyer, Ph.D., Director
Amy M. Branum, Ph.D., Associate Director for Science
Division of Health Care Statistics
Carol J. DeFrances, Ph.D., Acting Director
Alexander Strashny, Ph.D., Associate Director for Science