Death Rates for Leading Causes of Death for People Aged 25–44 Among the Three Largest Race and Ethnicity Groups: United States, 2000–2020
NCHS Data Brief No. 451, November 2022
PDF Version (404 KB)
- Key findings
- Death rates among people aged 25–44 increased from 2013 through 2020 for non-Hispanic Black, non-Hispanic White, and Hispanic people.
- Deaths rates due to unintentional injuries increased recently for the three largest race and ethnicity groups, with the greatest annual increases from 2019 to 2020.
- All groups experienced recent increases in heart disease death rates, with the greatest annual increase from 2019 to 2020.
- Suicide death rates have stabilized recently for non-Hispanic White people aged 25–44 but have continued to increase for non-Hispanic Black and Hispanic people.
Data from the National Vital Statistics System
- Death rates for non-Hispanic White, non-Hispanic Black, and Hispanic people aged 25–44 increased from 2013 to 2019, followed by large 1-year increases from 2019 through 2020.
- Death rates for unintentional injuries began to increase before 2019 for the three largest race and ethnicity groups but experienced the greatest annual increases from 2019 to 2020, ranging from 23% to 47%.
- People aged 25–44 in the three largest race and ethnicity groups experienced recent increases in death rates due to heart disease, with the largest increases occurring between 2019 and 2020.
- Suicide rates did not change significantly from 2017 (23.3) to 2020 (22.7) for non-Hispanic White people aged 25–44 but continued to increase through 2020 for non-Hispanic Black (12.7) and Hispanic (11.3) people.
A report on trends from 2000 through 2017 in death rates among adults in the United States described increasing rates starting around 2012 for adults aged 25–44 in the three largest race and ethnicity groups (1). Most of the adults in this age range in 2020 are part of the millennial generation (born from 1981 to 1996) and have recently become the largest generation group in the United States (2). This report presents trends for the three leading causes of death among people aged 25–44 in 2020 (unintentional injuries, heart disease, and suicide) for non-Hispanic Black, non-Hispanic White, and Hispanic people.
Keywords: mortality rates, millennials, National Vital Statistics System
Death rates among people aged 25–44 increased from 2013 through 2020 for non-Hispanic Black, non-Hispanic White, and Hispanic people.
- After declining between 2000 and 2013, death rates increased 56% from 2013 through 2020 for non-Hispanic Black people aged 25–44 (from 209.2 per 100,000 to 326.0) and 78% for Hispanic people (from 90.9 to 161.4) (Figure 1).
- After a period of stability from 2000 to 2013, death rates increased 39% through 2020 for non-Hispanic White people (from 145.2 to 201.5).
- All groups experienced the greatest annual increase in death rates from 2019 to 2020, by 38% for Hispanic (from 116.6 to 161.4), 32% for non-Hispanic Black (from 247.1 to 326.0), and 17% for non-Hispanic White (from 171.5 to 201.5) people.
- Over the 2000–2020 period, death rates for Hispanic people aged 25–44 were always lower than for non-Hispanic Black and non-Hispanic White people.
Figure 1. Death rate among people aged 25–44, by race and ethnicity: United States, 2000–2020
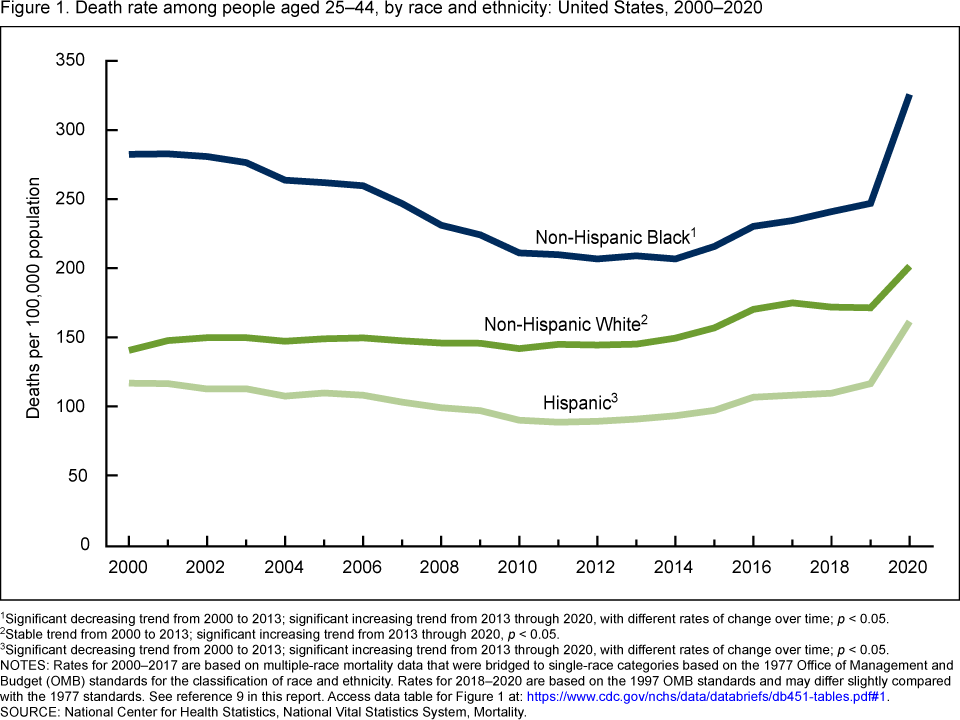
1Significant decreasing trend from 2000 to 2013; significant increasing trend from 2013 through 2020, with different rates of change over time; p < 0.05.
2Stable trend from 2000 to 2013; significant increasing trend from 2013 through 2020, p < 0.05.
3Significant decreasing trend from 2000 to 2013; significant increasing trend from 2013 through 2020, with different rates of change over time; p < 0.05.
NOTES: Rates for 2000–2017 are based on multiple-race mortality data that were bridged to single-race categories based on the 1977 Office of Management and Budget (OMB) standards for the classification of race and ethnicity. Rates for 2018–2020 are based on the 1997 OMB standards and may differ slightly compared with the 1977 standards. See reference 9 in this report. Access data table for Figure 1.
SOURCE: National Center for Health Statistics, National Vital Statistics System, Mortality.
Deaths rates due to unintentional injuries increased recently for the three largest race and ethnicity groups, with the greatest annual increases from 2019 to 2020.
- The death rate for unintentional injuries for non-Hispanic Black people aged 25–44 did not change significantly from 2000 (37.2 per 100,000) to 2006 (39.6), declined 19% through 2013 (32.0), but then increased 75% from 2013 to 2019 (56.0) and 47% from 2019 to 2020 (82.5) (Figure 2).
- Death rates due to unintentional injuries for non-Hispanic White people aged 25–44 doubled from 2000 (32.4) to 2019 (66.9) and then increased an additional 23% from 2019 to 2020 (82.3).
- Unintentional injuries death rates for Hispanic people aged 25–44 were stable until 2006 (31.3), declined 25% from 2006 to 2010 (23.4), then increased 68% through 2019 (39.4), followed by a 30% increase from 2019 to 2020 (51.1).
- For most of the 2000–2020 period, death rates due to unintentional injuries were higher for non-Hispanic White than non-Hispanic Black people, but the rates converged by 2020; rates for these groups were 61% higher than for Hispanic people in 2020.
Figure 2. Death rate for unintentional injuries among people aged 25–44, by race and ethnicity: United States, 2000–2020
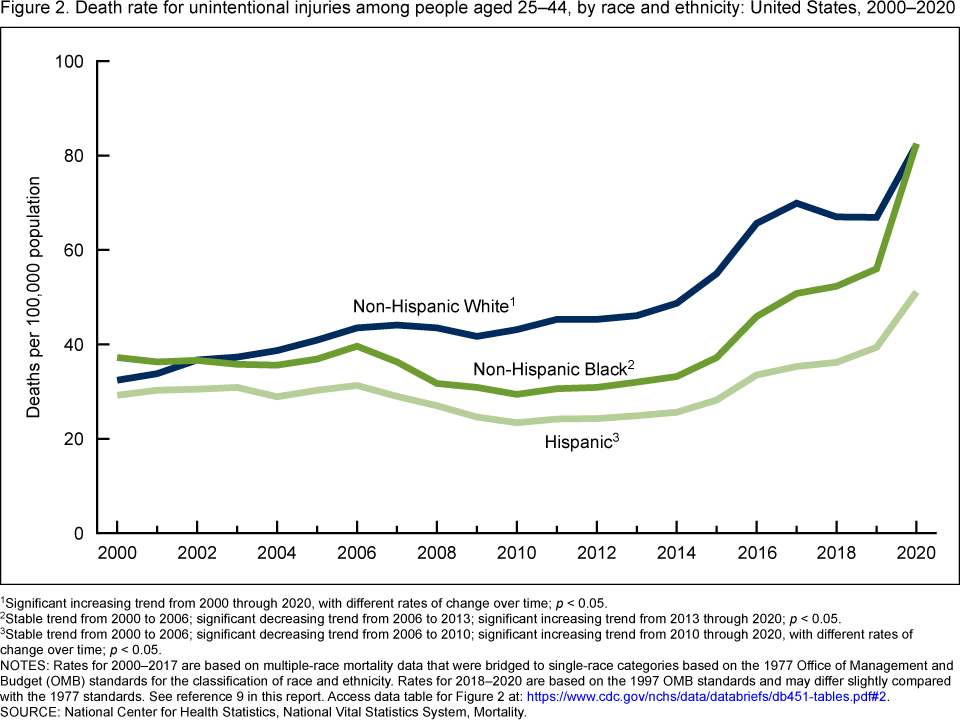
1Significant increasing trend from 2000 through 2020, with different rates of change over time; p < 0.05.
2Stable trend from 2000 to 2006; significant decreasing trend from 2006 to 2013; significant increasing trend from 2013 through 2020; p < 0.05.
3Stable trend from 2000 to 2006; significant decreasing trend from 2006 to 2010; significant increasing trend from 2010 through 2020, with different rates of change over time; p < 0.05.
NOTES: Rates for 2000–2017 are based on multiple-race mortality data that were bridged to single-race categories based on the 1977 Office of Management and Budget (OMB) standards for the classification of race and ethnicity. Rates for 2018–2020 are based on the 1997 OMB standards and may differ slightly compared with the 1977 standards. See reference 9 in this report. Access data table for Figure 2.
SOURCE: National Center for Health Statistics, National Vital Statistics System, Mortality.
All groups experienced recent increases in heart disease death rates, with the greatest annual increase from 2019 to 2020.
- For non-Hispanic Black people aged 25–44, death rates for heart disease had periods of stability and decline from 2000 to 2017 and then increased 5% through 2019 (34.6), followed by a 14% increase from 2019 through 2020 (39.5) (Figure 3).
- The death rate for heart disease for non-Hispanic White people aged 25–44 was stable from 2000 to 2002 and then declined 23% from 2002 (19.5) to 2019 (15.1); the rate then increased 15% from 2019 through 2020 (17.4).
- Heart disease death rates for Hispanic people aged 25–44 were stable from 2000 to 2003 (9.4) and then declined 12% through 2012 (7.9); the rate then increased through 2020, with the greatest annual increase (15%) from 2019 (9.5) to 2020 (10.9).
- Heart disease death rates for non-Hispanic Black people aged 25–44 were higher than those for non-Hispanic White and Hispanic people throughout the period.
Figure 3. Death rate for heart disease among people aged 25–44, by race and ethnicity: United States, 2000–2020
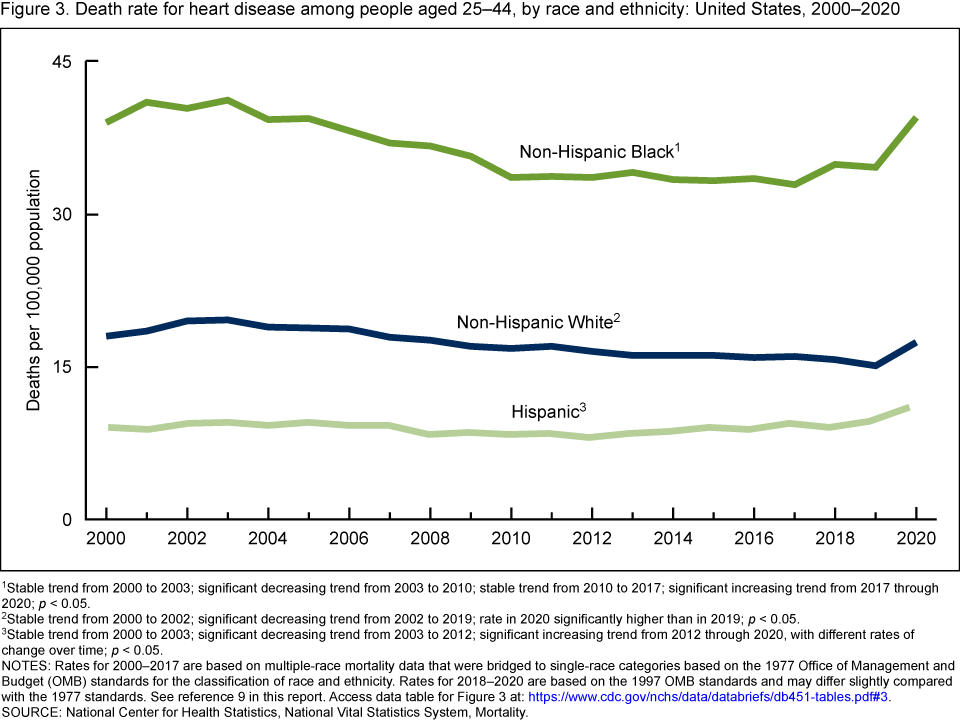
1Stable trend from 2000 to 2003; significant decreasing trend from 2003 to 2010; stable trend from 2010 to 2017; significant increasing trend from 2017 through 2020; p < 0.05.
2Stable trend from 2000 to 2002; significant decreasing trend from 2002 to 2019; rate in 2020 significantly higher than in 2019; p < 0.05.
3Stable trend from 2000 to 2003; significant decreasing trend from 2003 to 2012; significant increasing trend from 2012 through 2020, with different rates of change over time; p < 0.05.
NOTES: Rates for 2000–2017 are based on multiple-race mortality data that were bridged to single-race categories based on the 1977 Office of Management and Budget (OMB) standards for the classification of race and ethnicity. Rates for 2018–2020 are based on the 1997 OMB standards and may differ slightly compared with the 1977 standards. See reference 9 in this report. Access data table for Figure 3.
SOURCE: National Center for Health Statistics, National Vital Statistics System, Mortality.
Suicide death rates have stabilized recently for non-Hispanic White people aged 25–44 but have continued to increase for non-Hispanic Black and Hispanic people.
- Suicide rates for non-Hispanic White people aged 25–44 increased 47% from 2000 (15.9) to 2017 (23.3) and then did not change significantly through 2020 (22.7) (Figure 4).
- From 2000 to 2014, suicide rates for non-Hispanic Black people aged 25–44 were stable but then increased 44% from 2014 (8.8) to 2020 (12.7).
- After a period of stability from 2000 to 2013, suicide rates for Hispanic people aged 25–44 increased 55% from 2013 (7.3) to 2020 (11.3).
- Throughout the period, suicide rates were always higher for non-Hispanic White than non-Hispanic Black and Hispanic people.
Figure 4. Death rate for suicide among people aged 25–44, by race and ethnicity: United States, 2000–2020
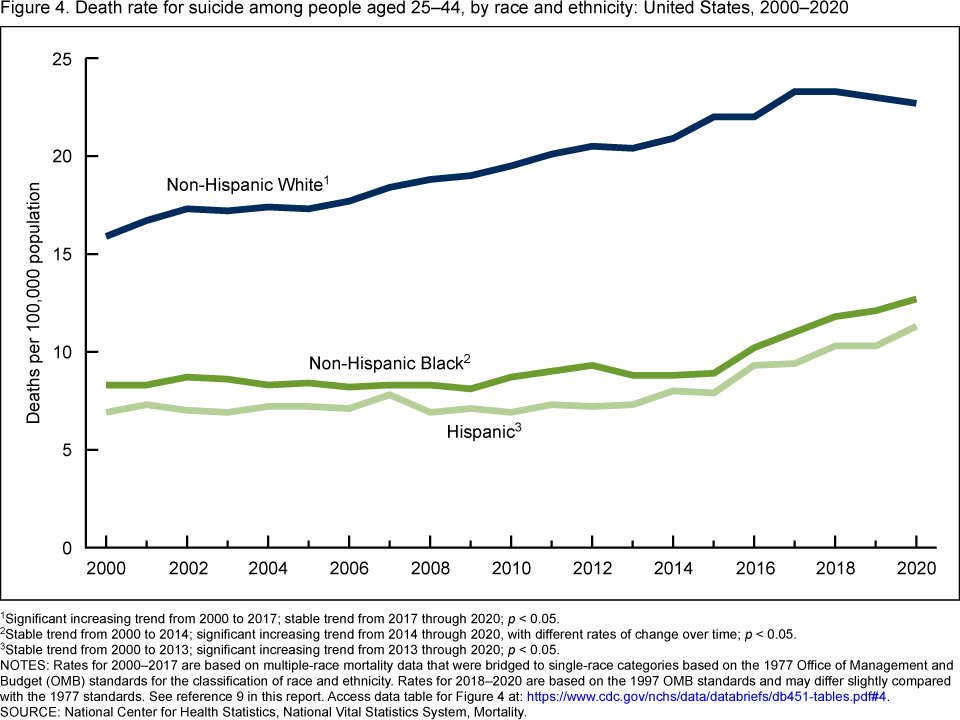
1Significant increasing trend from 2000 to 2017; stable trend from 2017 through 2020; p < 0.05.
2Stable trend from 2000 to 2014; significant increasing trend from 2014 through 2020, with different rates of change over time; p < 0.05.
3Stable trend from 2000 to 2013; significant increasing trend from 2013 through 2020; p < 0.05.
NOTES: Rates for 2000–2017 are based on multiple-race mortality data that were bridged to single-race categories based on the 1977 Office of Management and Budget (OMB) standards for the classification of race and ethnicity. Rates for 2018–2020 are based on the 1997 OMB standards and may differ slightly compared with the 1977 standards. See reference 9 in this report. Access data table for Figure 4.
SOURCE: National Center for Health Statistics, National Vital Statistics System, Mortality.
Summary
Findings in this report show continuations of increasing trends in death rates among people aged 25–44 through 2020 for the three largest race and ethnicity groups (1). Death rates increased from 2013 to 2020 for non-Hispanic Black, non-Hispanic White, and Hispanic people aged 25–44, with the greatest annual increase from 2019 to 2020, the first year of the COVID-19 pandemic. Total death rates in 2020 were the highest of the 2000–2020 period for all groups. Apart from suicide rates for non-Hispanic White people, death rates for all race and ethnicity groups for all three leading causes of death experienced recent increases; nearly all rates for the three leading causes began to increase before 2019. Unintentional injuries deaths were the leading cause for all groups and had the largest percentage increases, ranging from 23% to 47% from 2019 to 2020. Heart disease death rates also increased recently for all groups, with 14%–15% increases from 2019 to 2020. After a period of increase for most of the period, suicide rates were stable through 2020 for non-Hispanic White people, while rates for non-Hispanic Black and Hispanic people increased.
Data source and methods
Mortality data are from the 2000–2020 Detailed Mortality–All Counties file and, along with population data, were tabulated using the CDC WONDER underlying cause-of-death query tool (3). Population data for 2000 and 2010 are April 1 bridged-race census counts; for 2001–2009, they are July 1 bridged-race intercensal estimates; and for 2011–2017, they are bridged-race July 1 postcensal estimates based on the 2010 census. For 2018–2020, population data are single-race July 1 postcensal estimates based on the 2010 census.
Causes of death are classified using the International Classification of Diseases, 10th Revision (ICD–10) (4) and were ranked according to the number of deaths assigned to rankable causes for people aged 25–44 (5). Trends in the three leading causes for 2020 for each race and ethnicity group are shown in Figures 2–4.
Trends in death rates were evaluated using the Joinpoint Regression Program (6). The Joinpoint software was used to fit weighted least-squares regression models to the estimated proportions on the logarithmic scale. The default settings allowed for as few as three observed time points in the beginning, ending, and middle line segments, including the joinpoints. Using these settings, a maximum of three joinpoints were searched for using the grid search algorithm and permutation test, and an overall alpha level of 0.05. Pairwise comparisons of rates in Figures 1–4 were conducted using the z test with an alpha level of 0.05 (7).
This report features data for the three largest race and ethnicity groups (non-Hispanic White, non-Hispanic Black, and Hispanic), which comprised 94% of all deaths among people aged 25–44 in 2020. Information on race and ethnicity are from death certificates and are supplied by an informant, usually the next of kin. Race and Hispanic origin are two distinct attributes and are reported separately on death certificates. As a result, the data shown in this report by Hispanic origin and race are based on a combination of the two attributes for the non-Hispanic population. Data shown for the Hispanic population include adults of any race. Death rates for Hispanic adults are impacted by inconsistencies in reporting Hispanic origin on the death certificate compared with censuses and surveys. A validity study has shown underreporting on death certificates of Hispanic decedents by 3% (8). Rates in this report for 2000–2017 are based on multiple-race mortality data that were bridged to single-race categories based on the 1977 Office of Management and Budget (OMB) standards for the classification of race and ethnicity. Rates for 2018–2020 were based on the 1997 OMB standards and may differ slightly compared with the 1977 standards (9).
Past research has shown significant differences in death rates in specific Hispanic subgroups (Mexican, Cuban, Puerto Rican, Dominican, Central and South American, and Other Hispanic) and by nativity status for Hispanic adults (born in the United States or outside the United States) (10,11). Because the majority of Hispanic adults living in the United States are of Mexican descent and are native born (12), the trends in this report are mostly reflective of trends for these groups.
About the authors
Sally C. Curtin and Jiaquan Xu are with the National Center for Health Statistics, Division of Vital Statistics.
References
- Curtin SC, Arias E. Mortality trends by race and ethnicity among adults aged 25 and over, 2000–2017. NCHS Data Brief, no 342. Hyattsville, MD: National Center for Health Statistics. 2019.
- Fry R. Millennials overtake baby boomers as America’s largest generation. Pew Research Center. 2020.
- National Center for Health Statistics. CDC WONDER. About underlying cause of death, 1999–2020. 2022.
- World Health Organization. International statistical classification of diseases and related health problems, 10th revision (ICD–10). 2008 ed. 2009.
- Heron M. Deaths: Leading causes for 2019. National Vital Statistics Reports; vol 70 no 9. Hyattsville, MD: National Center for Health Statistics. 2021.
- National Cancer Institute. Joinpoint Regression Program (Version 4.8.0.1) [computer software]. 2020.
- Xu JQ, Murphy SL, Kochanek KD, Arias E. Deaths: Final data for 2019. National Vital Statistics Reports; vol 70 no 8. Hyattsville, MD: National Center for Health Statistics. 2021.
- Arias E, Heron M, Hakes JK. The validity of race and Hispanic-origin reporting on death certificates in the United States: An update. National Center for Health Statistics. Vital Health Stat 2(172). 2016.
- Heron M. Comparability of race-specific mortality data based on 1977 versus 1997 reporting standards. National Vital Statistics Reports; vol 70 no 3. Hyattsville, MD: National Center for Health Statistics. 2021.
- Palloni A, Arias E. Paradox lost: Explaining the Hispanic adult mortality advantage. Demography 41(3):385–415. 2004.
- Fenelon A, Chinn JJ, Anderson RN. A comprehensive analysis of the mortality experience of Hispanic subgroups in the United States: Variation by age, country of origin, and nativity. SSM Popul Health 3:245–54. 2017.
- Flores A, López G, Radford J. 2015, Hispanic population in the United States statistical portrait. Pew Research Center. 2017.
Suggested citation
Curtin SC, Xu JQ. Death rates for leading causes of death for people aged 25–44 among the three largest race and ethnicity groups: United States, 2000–2020. NCHS Data Brief, no 451. Hyattsville, MD: National Center for Health Statistics. 2022. DOI: https://dx.doi.org/10.15620/cdc:121796.
Copyright information
All material appearing in this report is in the public domain and may be reproduced or copied without permission; citation as to source, however, is appreciated.
National Center for Health Statistics
Brian C. Moyer, Ph.D., Director
Amy M. Branum, Ph.D., Associate Director for Science
Division of Vital Statistics
Steven Schwartz, Ph.D., Director
Andrés A. Berruti, Ph.D., M.A., Associate Director for Science