Suicide Rates for the Three Leading Methods by Race and Ethnicity: United States, 2000–2020
NCHS Data Brief No. 450, November 2022
PDF Version (943 KB)
- Key findings
- Trends in suicide rates varied by race and Hispanic origin between 2000 and 2020.
- Firearm suicide rates for non-Hispanic White people declined from 2018 to 2020, whereas rates increased for non-Hispanic Black and Hispanic people.
- After increasing at a faster pace compared with non-Hispanic Black and Hispanic people through 2018, suffocation suicide rates declined for non-Hispanic White people through 2020.
- Poisoning suicide rates for non-Hispanic White people increased and then declined from 2017 to 2020, whereas rates for non-Hispanic Black and Hispanic people were stable.
- After increasing between 2000 and 2018, age-adjusted suicide rates for non-Hispanic White people declined from 2018 (18.1 per 100,000 population) to 2020 (16.9), whereas rates increased between 2000 and 2020 for non-Hispanic Black (7.8) and Hispanic (7.5) people.
- Firearm suicide rates for non-Hispanic White people declined from 2018 to 2020, whereas rates for non-Hispanic Black and Hispanic people continued to increase.
- After increasing at a faster pace compared with Hispanic and non-Hispanic Black people through 2018, suffocation suicide rates declined for non-Hispanic White people through 2020.
- Poisoning suicide rates were stable over the period for non-Hispanic Black and Hispanic people (ranging from 0.6 to 0.8) but declined for non-Hispanic White people (from 2.6 to 2.1) since 2017.
Suicide rates in the United States have traditionally been higher for non-Hispanic White than non-Hispanic Black and Hispanic people (1). However, provisional data demonstrated that patterns have changed recently with rates declining for non-Hispanic White people but increasing for non-Hispanic Black and Hispanic people (2). This report presents suicide rates from 2000 to 2020 using final data for non-Hispanic White, non-Hispanic Black, and Hispanic people, for the total population and for the three leading methods in 2020 (firearms, suffocation, and poisoning).
Keywords: mortality rates, firearms, National Vital Statistics System
Trends in suicide rates varied by race and Hispanic origin between 2000 and 2020.
- Age-adjusted suicide rates for non-Hispanic White people increased 51% from 2000 (12.0 per 100,000) to 2018 (18.1) and then declined 7% through 2020 (16.9) (Figure 1).
- For non-Hispanic Black people, age-adjusted suicide rates declined from 2000 (5.6) to 2007 (5.1) and then increased 53% through 2020 (7.8).
- Age-adjusted suicide rates for Hispanic people were stable from 2000 (5.9) to 2012 (5.8) and then increased 29% through 2020 (7.5).
- Throughout the period, rates for non-Hispanic White people ranged between 2 to 3 times higher than for non-Hispanic Black and Hispanic people.
Figure 1. Age-adjusted suicide rates, by race and ethnicity: United States, 2000–2020
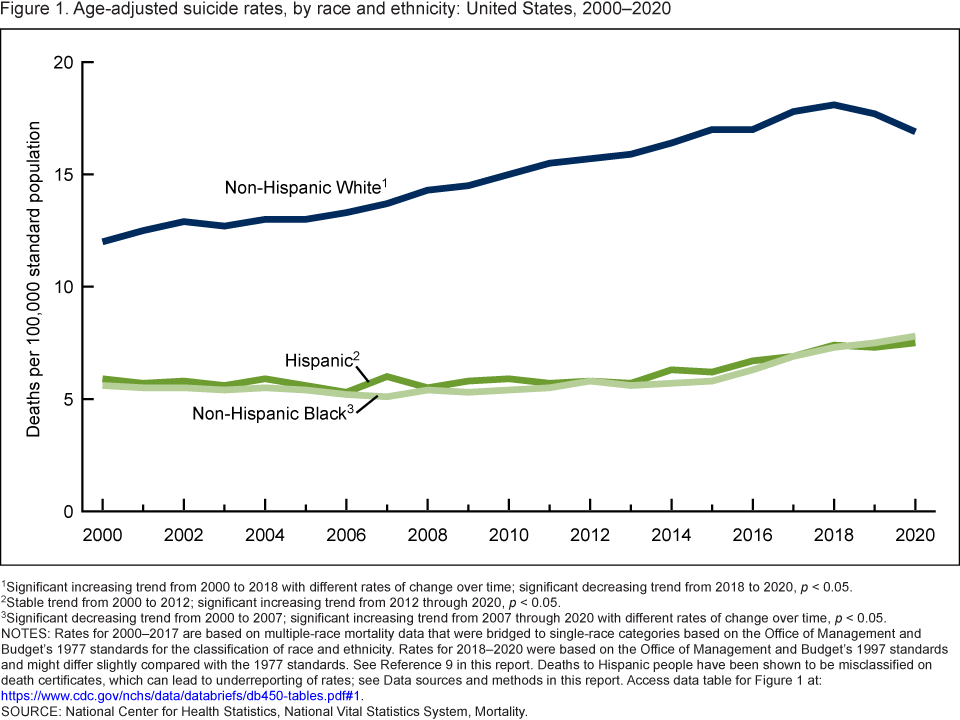
1Significant increasing trend from 2000 to 2018 with different rates of change over time; significant decreasing trend from 2018 to 2020, p < 0.05.
2Stable trend from 2000 to 2012; significant increasing trend from 2012 through 2020, p < 0.05.
3Significant decreasing trend from 2000 to 2007; significant increasing trend from 2007 through 2020 with different rates of change over time, p < 0.05.
NOTES: Rates for 2000–2017 are based on multiple-race mortality data that were bridged to single-race categories based on the Office of Management and Budget’s 1977 standards for the classification of race and ethnicity. Rates for 2018–2020 were based on the Office of Management and Budget’s 1997 standards and might differ slightly compared with the 1977 standards. See Reference 9 in this report. Deaths to Hispanic people have been shown to be misclassified on death certificates, which can lead to underreporting of rates; see Data sources and methods in this report. Access data table for Figure 1.
SOURCE: National Center for Health Statistics, National Vital Statistics System, Mortality.
Firearm suicide rates for non-Hispanic White people declined from 2018 to 2020, whereas rates increased for non-Hispanic Black and Hispanic people.
- The age-adjusted firearm suicide rate for non-Hispanic White people was stable from 2000 (6.9 per 100,000) to 2006 (6.8), increased 37% from 2006 to 2018 (9.3), and then declined through 2020 (9.0) (Figure 2).
- For non-Hispanic Black people, rates declined from 2000 (3.2) to 2007 (2.6), were stable through 2015 (2.7), and then increased 56% through 2020 (4.2).
- Rates for Hispanic people declined from 2000 (2.7) to 2013 (2.1) and then increased 38% through 2020 (2.9).
- Throughout the period, rates for non-Hispanic White people ranged between 2 to 3 times higher than for non-Hispanic Black and Hispanic people.
Figure 2. Age-adjusted firearm suicide rates, by race and ethnicity: United States, 2000–2020
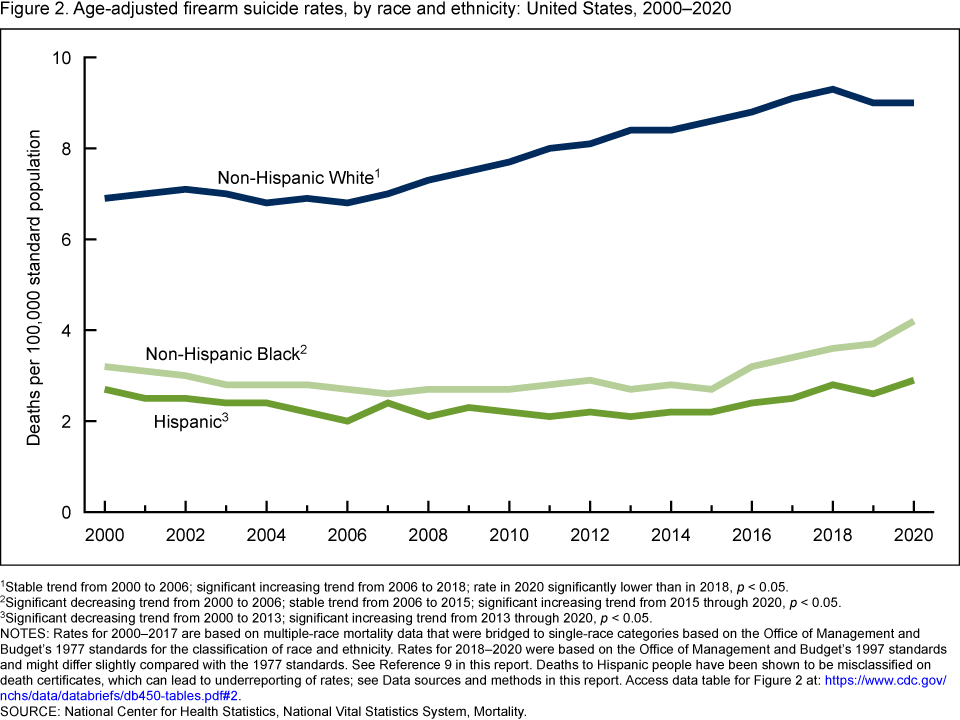
1Stable trend from 2000 to 2006; significant increasing trend from 2006 to 2018; rate in 2020 significantly lower than in 2018, p < 0.05.
2Significant decreasing trend from 2000 to 2006; stable trend from 2006 to 2015; significant increasing trend from 2015 through 2020, p < 0.05.
3Significant decreasing trend from 2000 to 2013; significant increasing trend from 2013 through 2020, p < 0.05.
NOTES: Rates for 2000–2017 are based on multiple-race mortality data that were bridged to single-race categories based on the Office of Management and Budget’s 1977 standards for the classification of race and ethnicity. Rates for 2018–2020 were based on the Office of Management and Budget’s 1997 standards and might differ slightly compared with the 1977 standards. See Reference 9 in this report. Deaths to Hispanic people have been shown to be misclassified on death certificates, which can lead to underreporting of rates; see Data sources and methods in this report. Access data table for Figure 2.
SOURCE: National Center for Health Statistics, National Vital Statistics System, Mortality.
After increasing at a faster pace compared with non-Hispanic Black and Hispanic people through 2018, suffocation suicide rates declined for non-Hispanic White people through 2020.
- The age-adjusted suffocation suicide rate (including asphyxiation, strangulation, and other means) for non-Hispanic White people more than doubled from 2000 (2.1 per 100,000) to 2018 (5.2) and then declined 12% through 2020 (4.6) (Figure 3).
- Age-adjusted suffocation suicide rates for Hispanic people increased 63% from 2000 (1.9) to 2020 (3.1).
- For non-Hispanic Black people, the suffocation suicide rate increased 67% from 2000 (1.2) to 2020 (2.0).
- Throughout the period, rates for non-Hispanic White people were higher than for non-Hispanic Black and Hispanic people.
Figure 3. Age-adjusted suffocation suicide rates, by race and ethnicity: United States, 2000–2020
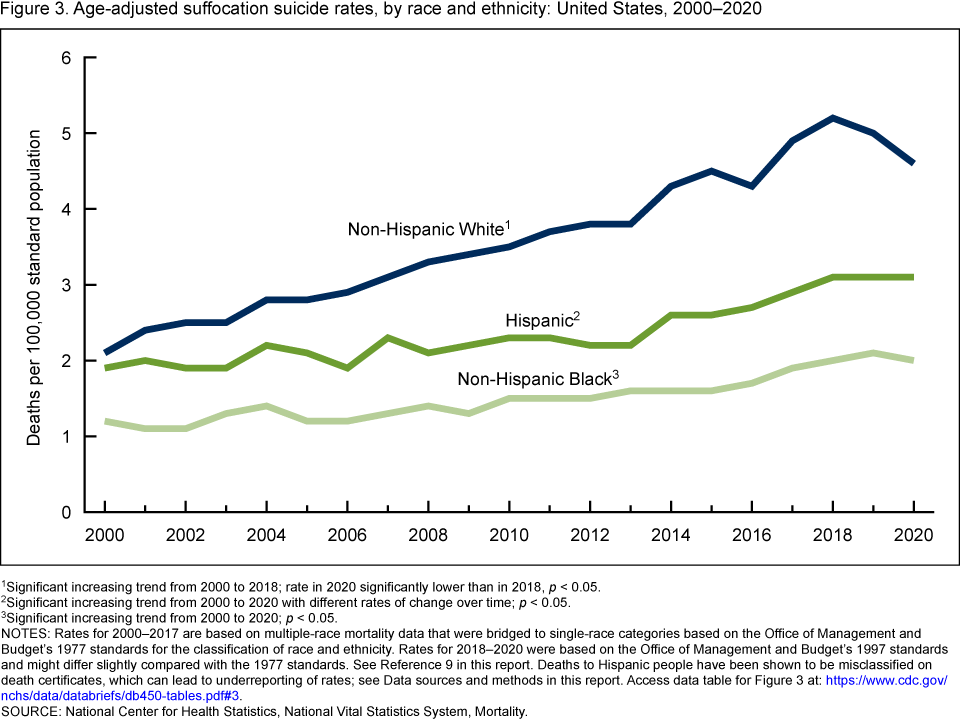
1Significant increasing trend from 2000 to 2018; rate in 2020 significantly lower than in 2018, p < 0.05.
2Significant increasing trend from 2000 to 2020 with different rates of change over time; p < 0.05.
3Significant increasing trend from 2000 to 2020; p < 0.05.
NOTES: Rates for 2000–2017 are based on multiple-race mortality data that were bridged to single-race categories based on the Office of Management and Budget’s 1977 standards for the classification of race and ethnicity. Rates for 2018–2020 were based on the Office of Management and Budget’s 1997 standards and might differ slightly compared with the 1977 standards. See Reference 9 in this report. Deaths to Hispanic people have been shown to be misclassified on death certificates, which can lead to underreporting of rates; see Data sources and methods in this report. Access data table for Figure 3.
SOURCE: National Center for Health Statistics, National Vital Statistics System, Mortality.
Poisoning suicide rates for non-Hispanic White people increased and then declined from 2017 to 2020, whereas rates for non-Hispanic Black and Hispanic people were stable.
- For non-Hispanic White people, the age-adjusted poisoning suicide rate increased from 2000 (2.1 per 100,000) to 2010 (2.7), was stable from 2010 to 2017 (2.6), and then declined 19% through 2020 (2.1) (Figure 4).
- Rates for non-Hispanic Black and Hispanic people were similar and stable over the period, ranging between 0.6 to 0.8.
- Throughout the period, rates for non-Hispanic White people ranged between 3 to 5 times higher than for non-Hispanic Black and Hispanic people.
Figure 4. Age-adjusted poisoning suicide rates, by race and ethnicity: United States, 2000–2020
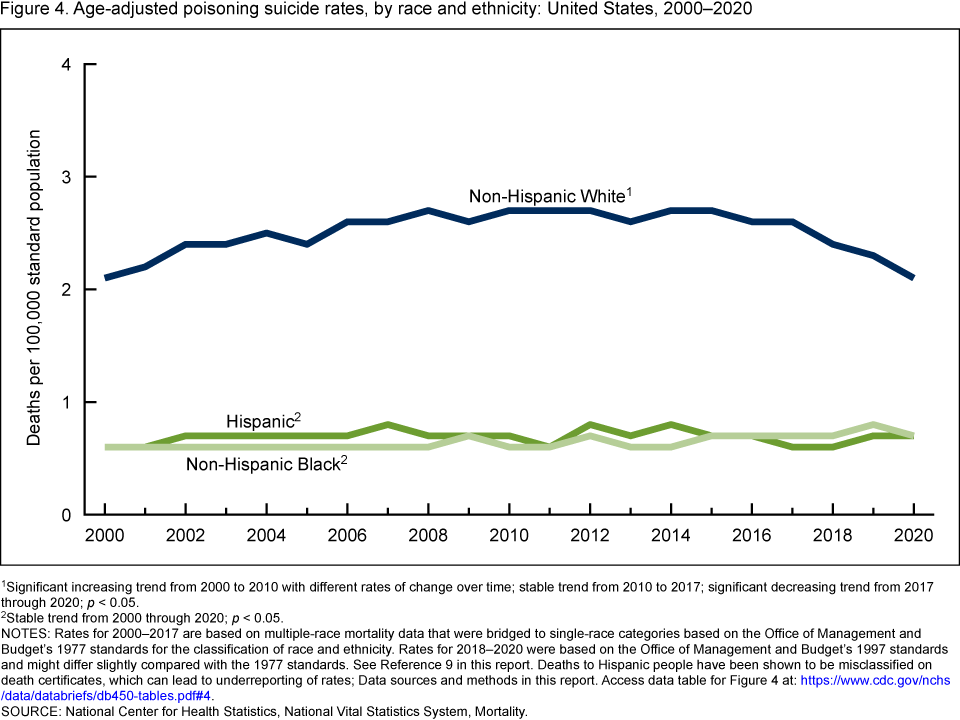
1Significant increasing trend from 2000 to 2010 with different rates of change over time; stable trend from 2010 to 2017; significant decreasing trend from 2017 through 2020; p < 0.05.
2Stable trend from 2000 through 2020; p < 0.05.
NOTES: Rates for 2000–2017 are based on multiple-race mortality data that were bridged to single-race categories based on the Office of Management and Budget’s 1977 standards for the classification of race and ethnicity. Rates for 2018–2020 were based on the Office of Management and Budget’s 1997 standards and might differ slightly compared with the 1977 standards. See Reference 9 in this report. Deaths to Hispanic people have been shown to be misclassified on death certificates, which can lead to underreporting of rates; see Data sources and methods in this report. Access data table for Figure 4.
SOURCE: National Center for Health Statistics, National Vital Statistics System, Mortality.
Summary
Findings in this report show that suicide rates for non-Hispanic White people increased from 2000 to 2018, whereas rates for non-Hispanic Black and Hispanic people initially were stable or decreasing and then increased through 2018. Since 2018, the age-adjusted suicide rate for non-Hispanic White people declined 7% through 2020, whereas rates for non-Hispanic Black and Hispanic people continued to increase. Preliminary 2021 data indicate that the age-adjusted rate for all three race and ethnicity groups increased from 2020 to 2021, although the percentage increase was less for non-Hispanic White people (3%) compared with non-Hispanic Black (13%) and Hispanic (8%) people (3). Over the period, suicides rates involving firearms, suffocation, and poisoning, the three leading methods, were highest for non-Hispanic White people, but this group experienced recent declines for all three methods. Suicide rates for firearms and suffocation continued to increase for non-Hispanic Black and Hispanic people, whereas rates for poisoning were stable for both. Thus, after widening over most of the period due to greater percentage increases among non-Hispanic White people, differences in rates between non-Hispanic White and non-Hispanic Black and Hispanic people for all three leading methods of suicide have narrowed since 2017–2018.
Data sources and methods
Mortality data are from the 2000–2020 multiple cause-of-death mortality files and, along with population data, were tabulated using the CDC WONDER underlying cause-of-death query tool (4). Population data for 2000 and 2010 are April 1 bridged-race census counts, for 2001–2009 they are July 1 bridged-race intercensal estimates, and for 2011–2017 they are bridged-race July 1 postcensal estimates based on the 2010 census. For 2018–2020, population data are single-race July 1 postcensal estimates based on the 2010 census. Suicides were identified using International Classification of Diseases, 10th Revision (ICD–10) underlying cause-of-death codes U03, X60–X84, and Y87.0 (5). The three leading methods of suicide were ranked according to the number of deaths for each method in 2020 and identified using ICD–10 codes X72–X74 for firearm, X70 for suffocation, and X60–X69 for poisoning.
Trends in death rates were evaluated using the Joinpoint Regression Program (6). The authors used the Joinpoint software to fit weighted least-squares regression models to the estimated proportions on the logarithmic scale. The default settings allowed for as few as three observed time points in the beginning, ending, and middle line segments, including the joinpoints. Using these settings, the grid search algorithm and permutation test searched for a maximum of three joinpoints, and an overall alpha level of 0.05. Pairwise comparisons of rates in Figures 1–4 were conducted using the z test with an alpha level of 0.05 (7).
Information on race and ethnicity are from death certificates and are supplied by an informant, usually the next of kin. Race and Hispanic origin are two distinct attributes and are reported separately on death certificates. Therefore, the data shown in this report by Hispanic origin and race are based on a combination of the two attributes for the non-Hispanic population. Data shown for the Hispanic population include adults of any race. Death rates for Hispanic adults are impacted by inconsistencies in reporting Hispanic origin on the death certificate compared with censuses and surveys. A validity study has shown underreporting on death certificates of Hispanic decedents by 3% (8). Rates in this report for 2000–2017 are based on multiple-race mortality data that were bridged to single-race categories based on the Office of Management and Budget’s (OMB) 1977 standards for the classification of race and ethnicity. Rates for 2018–2020 were based on OMB’s 1997 standards and differ slightly compared with the 1977 standards (9). For example, compared with OMB’s 1977 standards, the 2020 age-adjusted suicide rate using the 1997 standards was 0.1 higher for both non-Hispanic White (16.9 compared with 16.8) and non-Hispanic Black (7.8 compared with 7.7) people.
Past research has shown significant differences in death rates by specified Hispanic subgroups (Mexican, Cuban, Puerto Rican, Dominican, Central and South American, and Other Hispanic) and by nativity status for Hispanic adults (U.S. born compared with foreign born) (10,11). As the majority of Hispanic adults living in the United States are of Mexican descent and are native born (12), the trends in this report are mostly reflective of trends for these groups.
About the authors
Sally C. Curtin is with the National Center for Health Statistics, Division of Vital Statistics. Kamiah A. Brown and Mariah E. Jordan were Imhotep interns from Morehouse College assigned to work in the Division of Vital Statistics in summer 2022.
References
- Curtin SC, Warner M, Hedegaard H. Suicide rates for females and males by race and ethnicity: United States, 1999 and 2014. NCHS Health E-Stat. National Center for Health Statistics. April 2016.
- Curtin SC, Hedegaard H, Ahmad FB. Provisional numbers and rates of suicide by month and demographic characteristics: United States, 2020. Vital Statistics Rapid Release; no 16. Hyattsville, MD: National Center for Health Statistics. November 2021. DOI: https://dx.doi.org/10.15620/cdc:110369 .
- Centers for Disease Control and Prevention. About provisional mortality statistics, multiple cause-of-death data, 2018–2020, and provisional data, 2021–2022. CDC WONDER online database. 2022.
- Centers for Disease Control and Prevention. About underlying cause of death, 2020. CDC WONDER database. 2022.
- World Health Organization. International statistical classification of diseases and related health problems, 10th revision (ICD–10). 2008 ed. 2009.
- National Cancer Institute. Joinpoint Regression Program (Version 4.8.0.1) [computer software]. 2020.
- Xu JQ, Murphy SL, Kochanek KD, Arias E. Deaths: Final data for 2019. National Vital Statistics Reports; vol 70 no 8. Hyattsville, MD: National Center for Health Statistics. 2021. DOI: https://dx.doi.org/10.15620/cdc:106058.
- Arias E, Heron M, Hakes JK. The validity of race and Hispanic-origin reporting on death certificates in the United States: An update. National Center for Health Statistics. Vital Health Stat 2(172). 2016.
- Heron M. Comparability of race-specific mortality data based on 1977 versus 1997 reporting standards. National Vital Statistics Reports; vol 70 no 3. Hyattsville, MD: National Center for Health Statistics. DOI: https://dx.doi.org/10.15620/cdc:103476.
- Palloni A, Arias E. Paradox lost: Explaining the Hispanic adult mortality advantage. Demography 41(3):385–415. 2004.
- Arias E, Johnson NJ, Tejada-Vera B. Racial disparities in mortality in the adult hispanic population. SSM Popul Health 11. 2020.
- Pew Research Center. 2015, Hispanic Population in the United States Statistical Portrait. Statistical portrait of Hispanics in the United States. 2019.
Suggested citation
Curtin SC, Brown KA, Jordan ME. Suicide rates for the three leading methods by race and ethnicity, 2000–2020. NCHS Data Brief, no 450. Hyattsville, MD: National Center for Health Statistics. 2022. DOI: https://dx.doi.org/10.15620/cdc:121798.
Copyright information
All material appearing in this report is in the public domain and may be reproduced or copied without permission; citation as to source, however, is appreciated.
National Center for Health Statistics
Brian C. Moyer, Ph.D., Director
Amy M. Branum, Ph.D., Associate Director for Science
Division of Vital Statistics
Steven Schwartz, Ph.D., Director
Andrés A. Berruti, Ph.D., M.A., Associate Director for Science