Alcohol-induced Death Rates in the United States, 2019–2020
NCHS Data Brief No. 448, November 2022
PDF Version (493 KB)
- Key findings
- Rates of alcohol-induced deaths generally increased from 2000 to 2020 but rose more steeply in recent years.
- In 2020, the rate of alcohol-induced deaths was highest for those aged 55–64 for both males and females.
- Among females, those aged 35–44 had the largest percentage increase in death rates from 2019 to 2020.
- Among males, the largest percentage increases in death rates from 2019 to 2020 were for age groups under 45.
- Alcoholic liver disease was the most frequent underlying cause for alcohol-induced deaths.
Data from the National Vital Statistics System, Mortality
- The age-adjusted rate of alcohol-induced deaths increased 26% from 2019 (10.4 per 100,000 standard population) to 2020 (13.1).
- For both males and females, rates of alcohol-induced deaths in 2020 increased with age, peaked for those aged 55–64, and then declined for age groups 65 and over.
- From 2019 to 2020, rates of alcohol-induced deaths for females increased across all age groups for those aged 25 and over.
- From 2019 to 2020, rates of alcohol-induced deaths for males increased across all age groups under 85.
- From 2019 to 2020, deaths from alcohol-induced acute pancreatitis increased 50% (from 0.1 to 0.2), 33% for deaths from mental and behavioral disorders due to use of alcohol (3.0 to 4.0), and 23% for deaths from alcoholic liver disease (6.4 to 7.9)
Alcohol use is a known risk factor for mortality, and the rates of alcohol-induced deaths have risen over the past several years (1). Alcohol use in the United States increased during the first year of the Coronavirus Disease 2019 (COVID-19) pandemic, which may have affected mortality rates, especially for alcohol-induced deaths (2). Understanding trends in alcohol-induced mortality, with a particular focus on differences from 2019 to 2020, may help identify groups particularly affected during the COVID-19 pandemic. This report presents overall and sex-specific trends in alcohol-induced death rates from 2000 to 2020, and then focuses on the rates for 2019 and 2020 by sex, age group, and underlying cause of death.
Keywords: health disparity, poisoning, alcoholic liver disease, mortality, National Vital Statistics System
Rates of alcohol-induced deaths generally increased from 2000 to 2020 but rose more steeply in recent years.
- After annual increases of 7% or less between 2000 and 2018, the overall age-adjusted rate of alcohol-induced deaths increased 26%, from 10.4 per 100,000 in 2019 to 13.1 in 2020 (Figure 1).
- Rates of alcohol-induced deaths for males were stable from 2000 to 2009, increased 30% from 2009 (11.3) to 2018 (14.7), and increased 26% from 2019 (15.2) to 2020 (19.2).
- Rates of alcohol-induced deaths for females increased over the entire period, with the largest annual increase (27%) occurring between 2019 (5.9) and 2020 (7.5).
- Differences in rates between males and females decreased over the study period, from 3.6 times higher for males than females in 2000 (11.4 and 3.2, respectively), to 2.6 times higher in 2020 (19.2 and 7.5, respectively).
Figure 1. Age-adjusted rates of alcohol-induced deaths, by sex: United States, 2000–2020
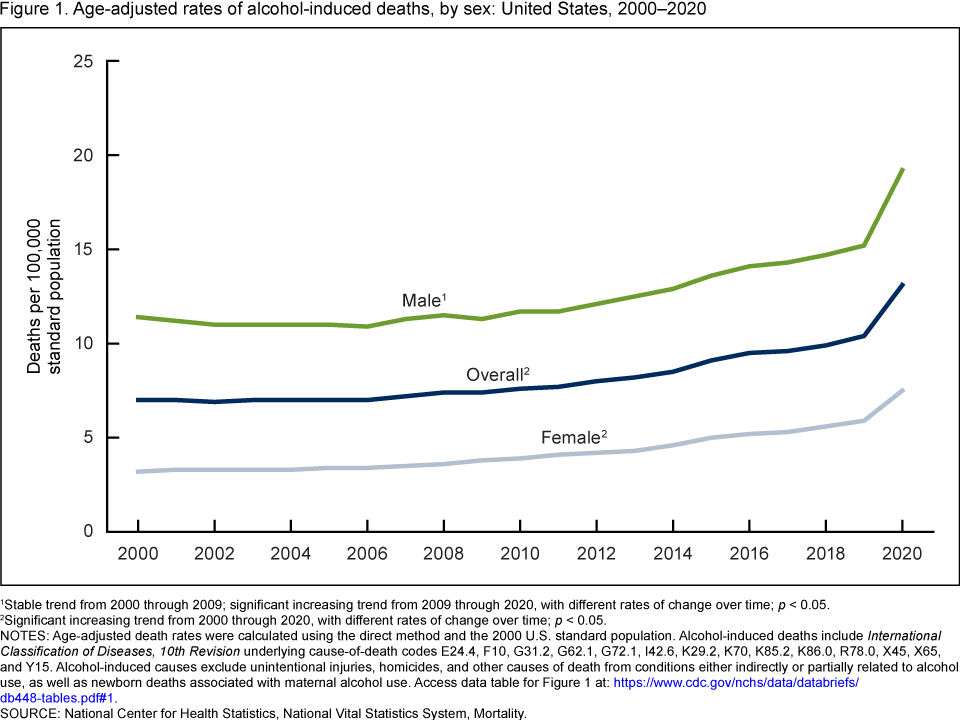
1Stable trend from 2000 through 2009; significant increasing trend from 2009 through 2020, with different rates of change over time; p < 0.05.
2Significant increasing trend from 2000 through 2020, with different rates of change over time; p < 0.05.
NOTES: Age-adjusted death rates were calculated using the direct method and the 2000 U.S. standard population. Alcohol-induced deaths include International Classification of Diseases, 10th Revision underlying cause-of-death codes E24.4, F10, G31.2, G62.1, G72.1, I42.6, K29.2, K70, K85.2, K86.0, R78.0, X45, X65, and Y15. Alcohol-induced causes exclude unintentional injuries, homicides, and other causes of death from conditions either indirectly or partially related to alcohol use, as well as newborn deaths associated with maternal alcohol use. Access data table for Figure 1.
SOURCE: National Center for Health Statistics, National Vital Statistics System, Mortality.
In 2020, the rate of alcohol-induced deaths was highest for those aged 55–64 for both males and females.
- Among females, rates in 2020 were lowest for those under age 25 years (0.1 per 100,000); rates increased by age group to 20.1 for those aged 55–64 and then decreased to 2.9 for those aged 85 and over (Figure 2).
- Among males, rates in 2020 were lowest for those under age 25 years (0.3); rates increased by age group to 59.0 for those aged 55–64 and then decreased to 12.8 for those aged 85 and over.
- Rates for males were two to four times higher than those for females for all age groups.
Figure 2. Rates of alcohol-induced deaths, by sex and age group: United States, 2020
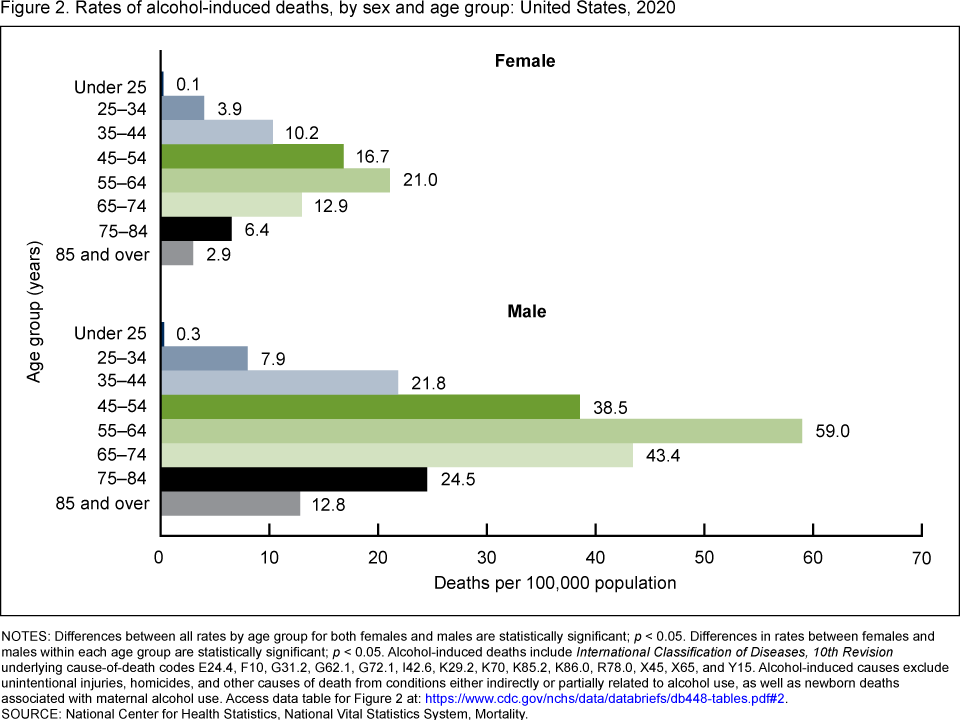
NOTES: Differences between all rates by age group for both females and males are statistically significant; p < 0.05. Differences in rates between females and males within each age group are statistically significant; p < 0.05. Alcohol-induced deaths include International Classification of Diseases, 10th Revision underlying cause-of-death codes E24.4, F10, G31.2, G62.1, G72.1, I42.6, K29.2, K70, K85.2, K86.0, R78.0, X45, X65, and Y15. Alcohol-induced causes exclude unintentional injuries, homicides, and other causes of death from conditions either indirectly or partially related to alcohol use, as well as newborn deaths associated with maternal alcohol use. Access data table for Figure 2.
SOURCE: National Center for Health Statistics, National Vital Statistics System, Mortality.
Among females, those aged 35–44 had the largest percentage increase in death rates from 2019 to 2020.
- From 2019 to 2020, rates increased for females across all age groups aged 25 and over (Figure 3).
- The largest percentage increase in rates for females was for those aged 35–44 (42%), from 7.2 per 100,000 in 2019 to 10.2 in 2020, followed by a 34% increase for females aged 25–34 (2.9 to 3.9), and a 26% increase for females aged 65–74 (10.2 to 12.9).
- The smallest percentage increase in rates for females was for those aged 85 and over (16%), from 2.5 in 2019 to 2.9 in 2020, followed by females aged 55–64 (20%) and 45–54 (25%).
Figure 3. Rates of alcohol-induced deaths for females, by age group: United States, 2019 and 2020
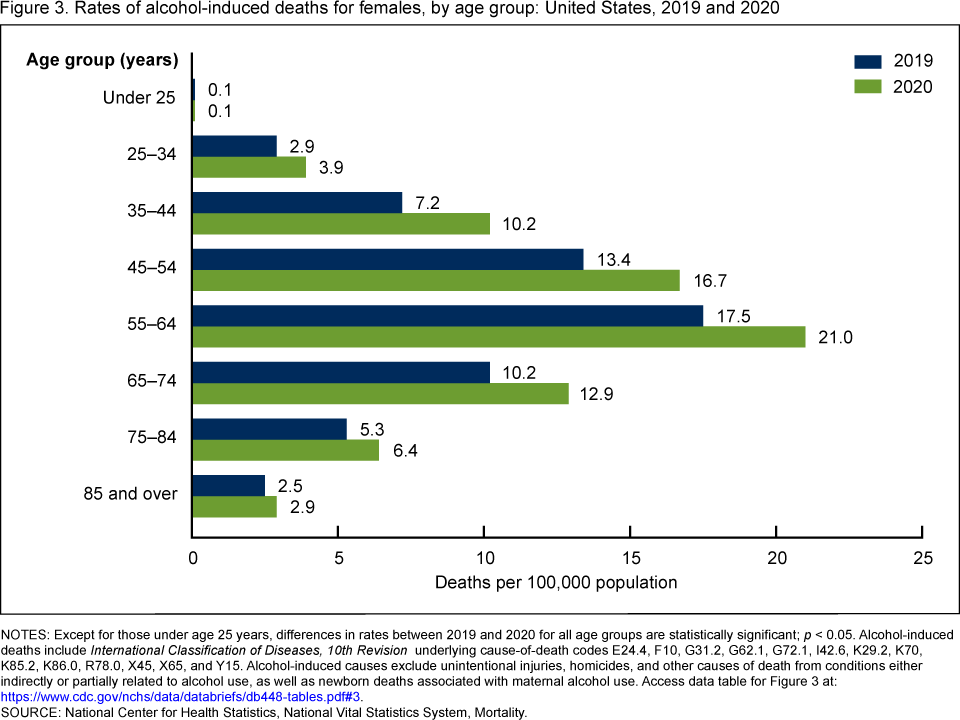
NOTES: Except for those under age 25 years, differences in rates between 2019 and 2020 for all age groups are statistically significant; p < 0.05. Alcohol-induced deaths include International Classification of Diseases, 10th Revision underlying cause-of-death codes E24.4, F10, G31.2, G62.1, G72.1, I42.6, K29.2, K70, K85.2, K86.0, R78.0, X45, X65, and Y15. Alcohol-induced causes exclude unintentional injuries, homicides, and other causes of death from conditions either indirectly or partially related to alcohol use, as well as newborn deaths associated with maternal alcohol use. Access data table for Figure 3.
SOURCE: National Center for Health Statistics, National Vital Statistics System, Mortality.
Among males, the largest percentage increases in death rates from 2019 to 2020 were for age groups under 45.
- Among males, rates increased from 2019 to 2020 for all age groups except those aged 85 and over, which declined from 13.2 per 100,000 to 12.8 (Figure 4).
- The largest percentage increase in rates was for males aged under 25 years (50%), from 0.2 in 2019 to 0.3 in 2020, followed by a 46% increase for males aged 25–34 (5.4 to 7.9), and a 45% increase for males aged 35–44 (15.0 to 21.8).
- From 2019 to 2020, the smallest percentage increase in rates for males was for those aged 75–84 (11%), from 22.0 to 24.5, followed by males aged 65–75 (19%), males aged 55–64 (21%), and males aged 45–54 (25%).
Figure 4. Rates of alcohol-induced deaths for males, by age group: United States, 2019 and 2020
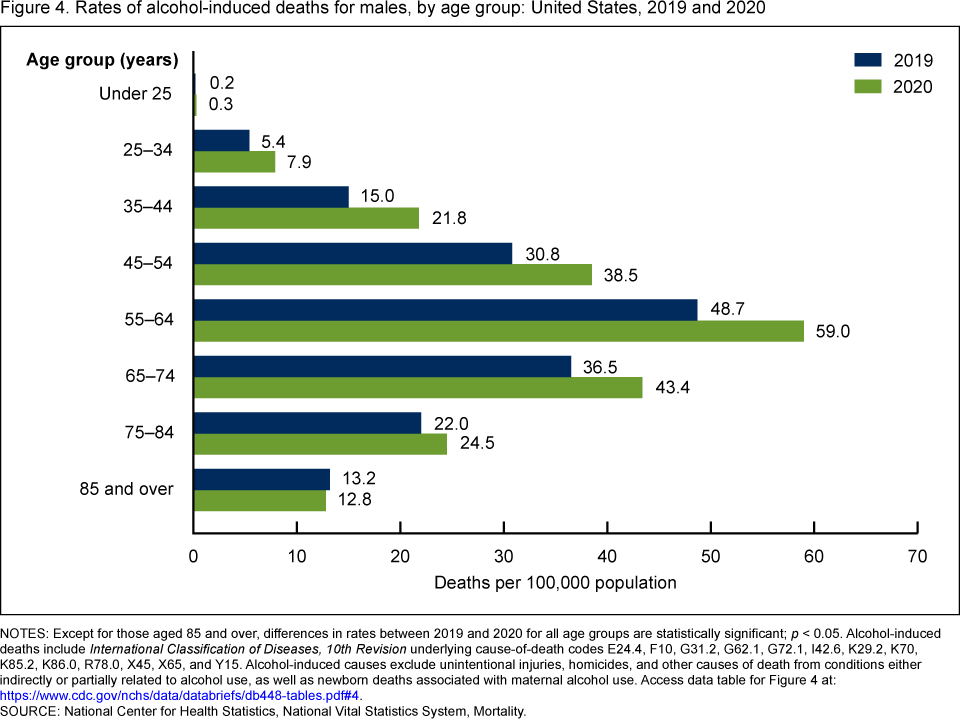
NOTES: Except for those aged 85 and over, differences in rates between 2019 and 2020 for all age groups are statistically significant; p < 0.05. Alcohol-induced deaths include International Classification of Diseases, 10th Revision underlying cause-of-death codes E24.4, F10, G31.2, G62.1, G72.1, I42.6, K29.2, K70, K85.2, K86.0, R78.0, X45, X65, and Y15. Alcohol-induced causes exclude unintentional injuries, homicides, and other causes of death from conditions either indirectly or partially related to alcohol use, as well as newborn deaths associated with maternal alcohol use. Access data table for Figure 4.
SOURCE: National Center for Health Statistics, National Vital Statistics System, Mortality.
Alcoholic liver disease was the most frequent underlying cause for alcohol-induced deaths.
- In 2019 and 2020, alcoholic liver disease was the most frequent cause of alcohol-induced death, followed by mental and behavioral disorders due to use of alcohol (Figure 5).
- From 2019 to 2020, the largest increases in rates were from alcohol-induced acute pancreatitis (50%), from 0.1 per 100,000 to 0.2, followed by mental and behavioral disorders due to use of alcohol (33%), from 3.0 to 4.0.
- Deaths from alcoholic liver disease increased 23%, from 6.4 in 2019 to 7.9 in 2020, and deaths from accidental poisoning of alcohol increased 14%, from 0.7 in 2019 to 0.8 in 2020.
- No change was seen in rates of death from alcoholic cardiomyopathy or from other alcohol-induced causes of death from 2019 to 2020.
Figure 5. Age-adjusted rates of alcohol-induced deaths, by underlying cause of death: United States, 2019 and 2020
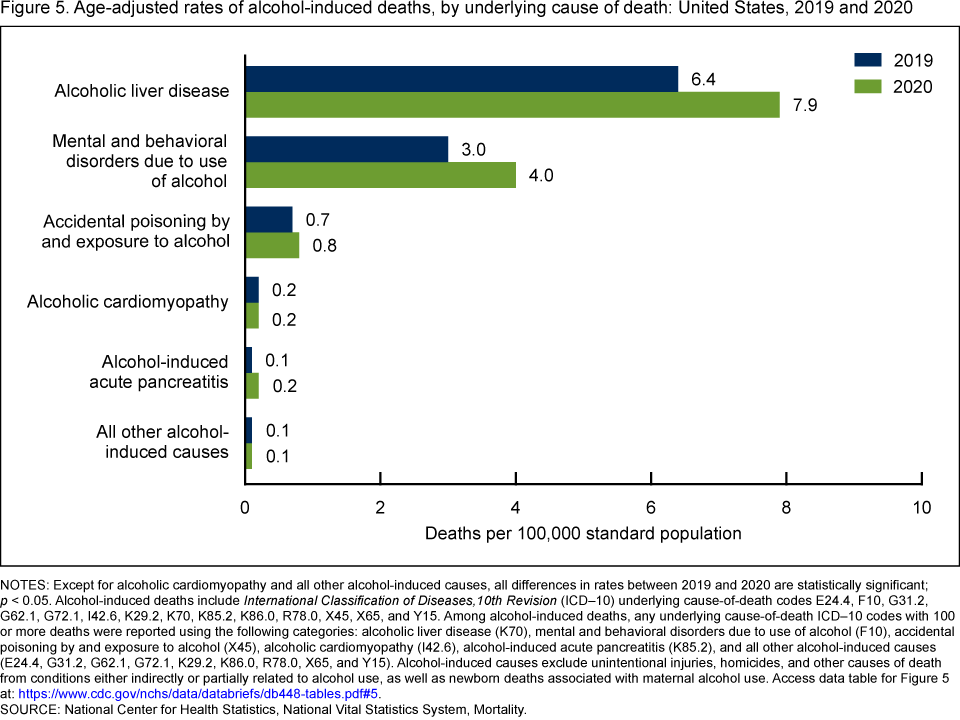
NOTES: Except for alcoholic cardiomyopathy and all other alcohol-induced causes, all differences in rates between 2019 and 2020 are statistically significant; p < 0.05. Alcohol-induced deaths include International Classification of Diseases,10th Revision (ICD–10) underlying cause-of-death codes E24.4, F10, G31.2, G62.1, G72.1, I42.6, K29.2, K70, K85.2, K86.0, R78.0, X45, X65, and Y15. Among alcohol-induced deaths, any underlying cause-of-death ICD–10 codes with 100 or more deaths were reported using the following categories: alcoholic liver disease (K70), mental and behavioral disorders due to use of alcohol (F10), accidental poisoning by and exposure to alcohol (X45), alcoholic cardiomyopathy (I42.6), alcohol-induced acute pancreatitis (K85.2), and all other alcohol-induced causes (E24.4, G31.2, G62.1, G72.1, K29.2, K86.0, R78.0, X65, and Y15). Alcohol-induced causes exclude unintentional injuries, homicides, and other causes of death from conditions either indirectly or partially related to alcohol use, as well as newborn deaths associated with maternal alcohol use. Access data table for Figure 5.
SOURCE: National Center for Health Statistics, National Vital Statistics System, Mortality.
Summary
Rates of alcohol-induced deaths have risen over the past 2 decades, with a sharp increase during the first year of the COVID-19 pandemic. Over the period, the largest overall annual increase occurred between 2019 and 2020, where the rate increased 26%, from 10.4 per 100,000 standard population to 13.1. During this 2019–2020 period, males and females each had their largest year-to-year percentage increase over the study period, at 26% and 27%, respectively. For both males and females, rates rose with increasing age and peaked for those aged 55–64 before declining for all age groups 65 and over. Increases in rates from 2019 to 2020 occurred across nearly all age groups. Rates for males were two to four times higher than those for females across all age groups.
The increases in rates from 2019 to 2020 were driven largely by deaths from alcoholic liver disease and mental and behavioral disorders due to use of alcohol. The rate of deaths from alcoholic liver disease increased 23% from 2019 to 2020 and 33% for mental and behavioral disorders due to use of alcohol. Rates of death from alcoholic cardiomyopathy did not change significantly between 2019 and 2020. Recent studies on alcohol-associated liver disease and the COVID-19 pandemic have reported several factors (for example, alcohol consumption worsening COVID-19-induced inflammation, increased risk of severe COVID-19 outcomes among patients with chronic liver disease, delays or avoidance in seeking medical attention, and reduced access to care, such as for liver transplants) that support these findings (3,4).
Definitions
Alcoholic liver disease: Deaths resulting from alcoholic fatty liver, alcoholic hepatitis, alcoholic fibrosis and sclerosis of the liver, alcoholic cirrhosis of the liver, alcoholic hepatic failure, and alcoholic liver disease, unspecified.
Mental and behavioral disorders due to use of alcohol: Deaths resulting from acute intoxication, harmful use, dependence syndrome, withdrawal (with and without delirium), psychotic disorder (including residual and late onset), amnesic syndrome, and other mental and behavioral disorders including those unspecified.
Data source and methods
Estimates are based on the National Vital Statistics System underlying cause-of-death mortality files, available on the Centers for Disease Control and Prevention’s Wide-ranging Online Data for Epidemiologic Research system (CDC WONDER) (5). Alcohol-induced deaths are classified using the following International Classification of Diseases, 10th Revision (ICD–10) underlying cause-of-death codes (6): E24.4, alcohol-induced pseudo-Cushing’s syndrome; F10, mental and behavioral disorders due to alcohol use; G31.2, degeneration of nervous system due to alcohol; G62.1, alcoholic polyneuropathy; G72.1, alcoholic myopathy; I42.6, alcoholic cardiomyopathy; K29.2, alcoholic gastritis; K70, alcoholic liver disease; K85.2, alcohol-induced acute pancreatitis; K86.0, alcohol-induced chronic pancreatitis; R78.0, finding of alcohol in blood; X45, accidental poisoning by and exposure to alcohol; X65, intentional self-poisoning by and exposure to alcohol; and Y15, poisoning by and exposure to alcohol, undetermined intent.
Alcohol-induced causes exclude unintentional injuries, homicides, and other causes indirectly related to alcohol use, as well as newborn deaths associated with maternal alcohol use. Alcohol-induced causes also do not capture deaths directly related to alcohol use from partially alcohol-attributable conditions, such as cancer, heart disease, and stroke. Rates of alcohol-attributable deaths in CDC’s Alcohol-Related Disease Impact Application may be higher because the application captures deaths partially and fully attributable to alcohol use (7). Among alcohol-induced deaths, the ICD–10 underlying cause-of-death codes were grouped into the following categories: alcohol liver disease (K70), mental and behavioral disorders due to use of alcohol (F10), accidental poisoning by and exposure to alcohol (X45), alcoholic cardiomyopathy (I42.6), alcohol-induced acute pancreatitis (K85.2), and all other alcohol-induced causes (E24.4, G31.2, G62.1, G72.1, I42.6, K29.2, K86.0, R78.0, X65, and Y15).
Age-adjusted death rates were calculated using the direct method and adjusted to the 2000 standard population (8). Trends in age-adjusted death rates were evaluated using the Joinpoint Regression Program (Version 4.7.0.0) (9). The Joinpoint software was used to fit weighted least-squares regression models to the rates on the log transform scale. The permutation tests for model (number of joinpoints) significance were set at an overall alpha level of 0.05. Pairwise comparisons of rates (age-adjusted rates for males compared with females, for example) were conducted using a z test with an alpha level of 0.05 (8).
About the authors
Merianne Rose Spencer and Matthew F. Garnett are with the National Center for Health Statistics (NCHS), Division of Analysis and Epidemiology. Sally C. Curtin is with the NCHS Division of Vital Statistics.
References
- Spencer MR, Curtin SC, Hedegaard H. Rates of alcohol-induced deaths among adults aged 25 and over in rural and urban areas: United States, 2000–2018. NCHS Data Brief, no 383. Hyattsville, MD: National Center for Health Statistics. 2020.
- White AM, Castle I-JP, Powell PA, Hingson RW, Koob GF. Alcohol-related deaths during the COVID-19 pandemic. JAMA 327(17):1704–6. 2022.
- Hartnett KP, Kite-Powell A, DeVies J, Coletta MA, Boehmer TK, Adjemian J, Gundlapalli AV, National Syndromic Surveillance Program Community of Practice. Impact of the COVID-19 pandemic on emergency department visits—United States, January 1, 2019–May 30, 2020. MMWR 69(23):699–704.
- Deutsch-Link S, Curtis B, Singal AK. Covid-19 and alcohol associated liver disease. Dig Liver Dis S1590–8658(22)00586–2. DOI: https://dx.doi.org/10.1016/j.dld.2022.07.007.
- Centers for Disease Control and Prevention. Mortality data on CDC WONDER: Underlying cause of death, 1999–2020. 2022.
- World Health Organization. International statistical classification of diseases and related health problems, 10th revision (ICD–10) 2008 ed. 2009.
- National Center for Chronic Disease Prevention and Health Promotion. Alcohol-related disease impact (ARDI) application.
- Kochanek KD, Murphy SL, Xu JQ, Arias E. Deaths: Final data for 2017. National Vital Statistics Reports; vol 68 no 9. Hyattsville, MD: National Center for Health Statistics. 2019.
- National Cancer Institute. Joinpoint Regression Program (Version 4.7.0.0) [computer software]. 2019.
Suggested citation
Spencer MR, Curtin SC, Garnett MF. Alcohol-induced death rates in the United States, 2019–2020. NCHS Data Brief, no 448. Hyattsville, MD: National Center for Health Statistics. 2022. DOI: https://dx.doi.org/10.15620/cdc:121795.
Copyright information
All material appearing in this report is in the public domain and may be reproduced or copied without permission; citation as to source, however, is appreciated.
National Center for Health Statistics
Brian C. Moyer, Ph.D., Director
Amy M. Branum, Ph.D., Associate Director for Science
Office of Analysis and Epidemiology
Irma E. Arispe, Ph.D., Director
Kevin C. Heslin, Ph.D., Associate Director for Science
Division of Vital Statistics
Steven Schwartz, Ph.D., Director
Andrés A. Berruti, Ph.D., M.A., Associate Director for Science