COVID-19 Death Rates in Urban and Rural Areas: United States, 2020
NCHS Data Brief No. 447, October 2022
PDF Version (493 KB)
Sally C. Curtin, M.A., and Melonie Heron, Ph.D.
- Key findings
- Age-adjusted COVID-19 death rates were highest in the most urban areas.
- For males, the highest age-adjusted COVID-19 death rate was in the most urban areas; for females, the highest rates were in the most urban and the most rural areas.
- Among males under age 65, those in the most urban areas had the highest COVID-19 death rates; among females, rates were highest in the most rural areas.
- Among males aged 65 and over, those in the most urban areas had the highest COVID-19 death rates; among females, rates were highest in the most urban and the most rural areas.
- In 2020, the age-adjusted death rate for COVID-19 was highest in the most urban areas (large central metropolitan) (97.7 per 100,000), which was 30% higher than in medium metropolitan areas (75.0), where the rate was the lowest.
- For males, the age-adjusted COVID-19 death rate in 2020 was highest in the most urban areas (129.3); for females, the highest rates were in the most urban (72.8) and the most rural (noncore) (73.8) areas.
- For people under age 65, COVID-19 death rates for males were highest among those living in the most urban areas, but among females rates were highest in the most rural areas.
- For people aged 65 and over, COVID-19 death rates for males were highest in the most urban areas; rates were highest for females in the most urban and the most rural areas.
Death rates in the United States are higher in rural than urban areas, and the difference has grown over the last 2 decades (1). Death rates for all of the 10 leading causes of death in 2019 were higher in rural than urban areas (1). In 2020, deaths due to COVID-19 became the third leading cause of death in the United States (2). This report presents COVID-19 death rates for rural and urban areas in 2020 by sex and age group (under age 65 and 65 and over). Rates are presented for the six categories of urbanicity according to the decedent’s county of residence (3). Urban areas include large central metropolitan, large fringe metropolitan, medium metropolitan, and small metropolitan; rural areas include micropolitan and noncore (nonmetropolitan).
Keywords: mortality rates, urbanicity, sex differences, National Vital Statistics System.
Age-adjusted COVID-19 death rates were highest in the most urban areas.
- In 2020, the age-adjusted death rate for COVID-19 was highest in the most urban areas (large central metropolitan), 97.7 per 100,000, followed by rural areas (90.6 in noncore and 86.5 in micropolitan) (Figure 1).
- COVID-19 rates were lower in small metropolitan (78.2) than large fringe metropolitan (79.9) areas and were lowest in medium metropolitan areas (75.0).
Figure 1. Age-adjusted COVID-19 death rates, by urbanicity of county of residence: United States, 2020
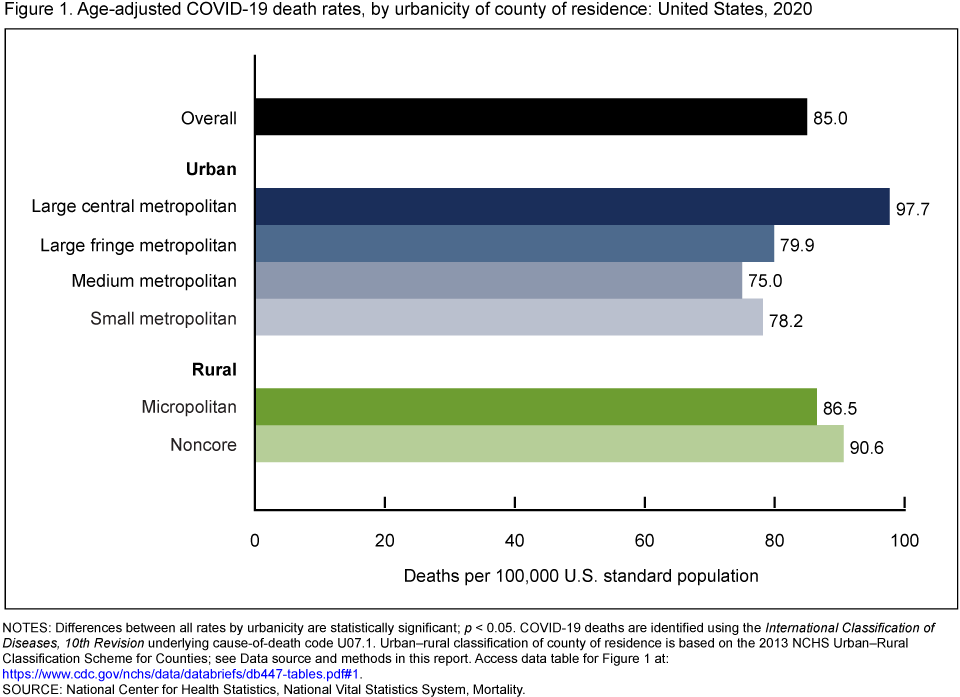
NOTES: Differences between all rates by urbanicity are statistically significant; p < 0.05. COVID-19 deaths are identified using the International Classification of Diseases, 10th Revision underlying cause-of-death code U07.1. Urban–rural classification of county of residence is based on the 2013 NCHS Urban–Rural Classification Scheme for Counties; see Data source and methods in this report. Access data table for Figure 1.
SOURCE: National Center for Health Statistics, National Vital Statistics System, Mortality.
For males, the highest age-adjusted COVID-19 death rate was in the most urban areas; for females, the highest rates were in the most urban and the most rural areas.
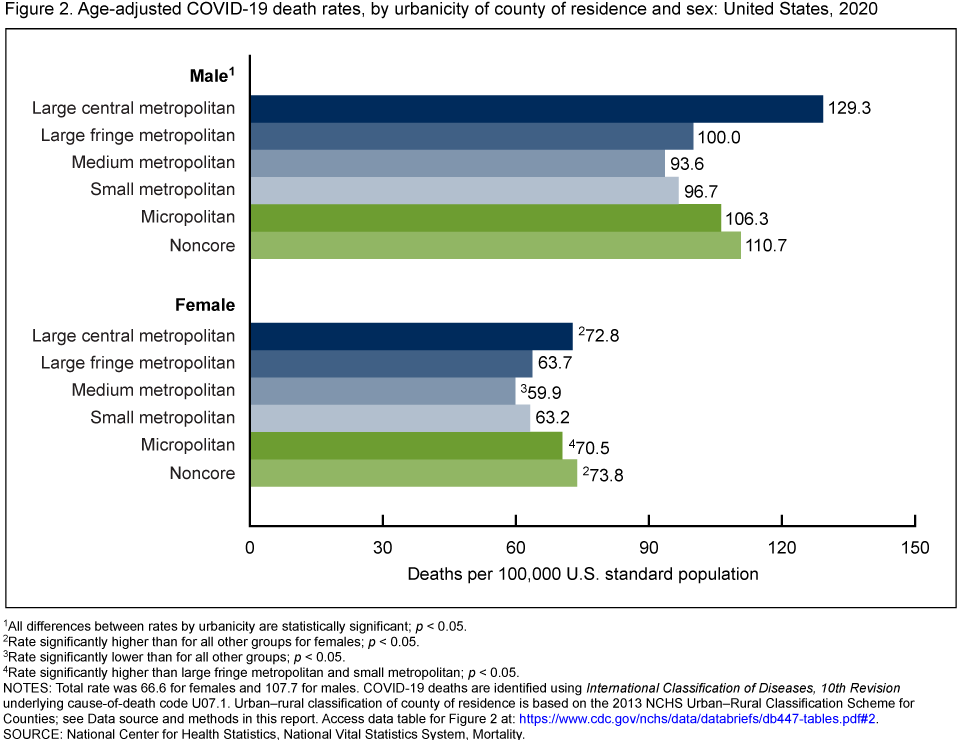
- The age-adjusted COVID-19 death rate in 2020 for males was highest in the most urban areas (large central metropolitan) (129.3), followed by noncore (110.7), micropolitan (106.3), large fringe metropolitan (100.0), and small metropolitan (96.7) areas. The rate was lowest in medium metropolitan areas (93.6) (Figure 2).
- For females, age-adjusted death rates for COVID-19 were highest in the most rural (noncore) (73.8) and large central metropolitan (72.8) areas. The rate was lowest in medium metropolitan areas (59.9).
- The COVID-19 death rate for females in micropolitan areas (70.5) was higher than in large fringe metropolitan (63.7) and small metropolitan (63.2) areas.
- For all areas, COVID-19 death rates were at least 50% higher for males compared with females, with the greatest difference found in large central metropolitan areas, where rates were 78% higher for males.
Figure 2. Age-adjusted COVID-19 death rates, by urbanicity of county of residence and sex: United States, 2020
1All differences between rates by urbanicity are statistically significant; p < 0.05.
2Rate significantly higher than for all other groups for females; p < 0.05.
3Rate significantly lower than for all other groups; p < 0.05.
4Rate significantly higher than large fringe metropolitan and small metropolitan; p < 0.05.
NOTES: Total rate was 66.6 for females and 107.7 for males. COVID-19 deaths are identified using International Classification of Diseases, 10th Revision underlying cause-of-death code U07.1. Urban–rural classification of county of residence is based on the 2013 NCHS Urban–Rural Classification Scheme for Counties; see Data source and methods in this report. Access data table for Figure 2.
SOURCE: National Center for Health Statistics, National Vital Statistics System, Mortality.
Among males under age 65, those in the most urban areas had the highest COVID-19 death rates; among females, rates were highest in the most rural areas.
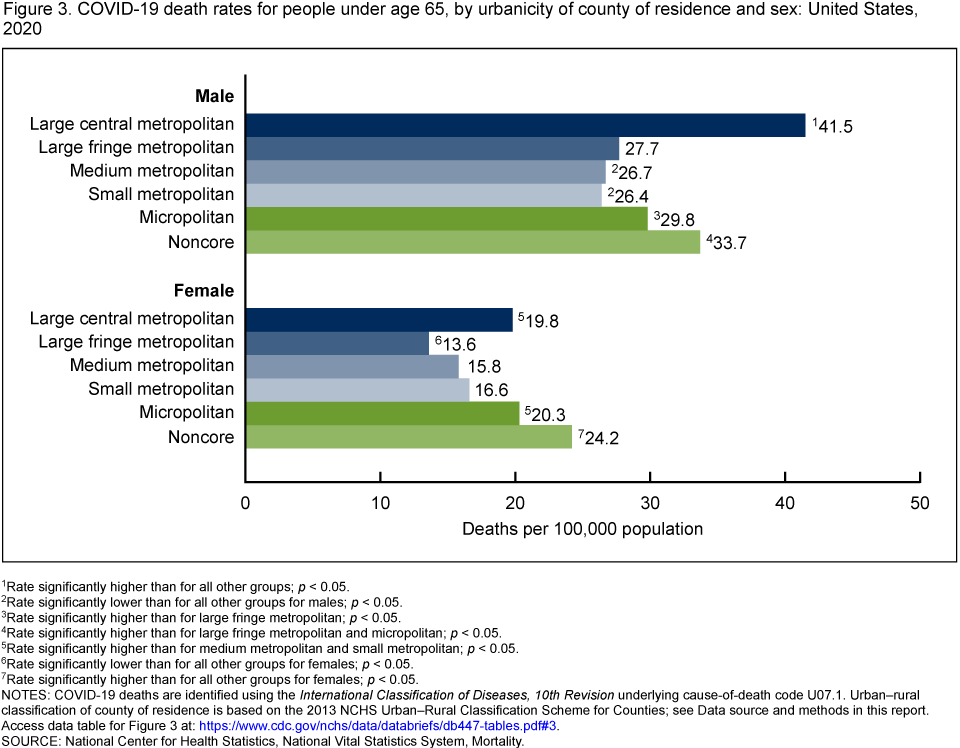
- Males under age 65 living in the most urban areas (large central metropolitan) had the highest COVID-19 death rate of all areas in 2020, 41.5 per 100,000, followed by noncore (33.7), micropolitan (29.8), and large fringe metropolitan (27.7) areas (Figure 3).
- The lowest COVID-19 death rates among males under age 65 were in the medium (26.7) and small (26.4) metropolitan areas.
- Among females under age 65, those in the most rural areas (noncore) had the highest COVID-19 death rates in 2020 (24.2), while those in large fringe metropolitan areas had the lowest rate (13.6). The rates in micropolitan (20.3) and large central metropolitan (19.8) areas were higher than in medium (15.8) and small (16.6) metropolitan areas.
- Differences in COVID-19 death rates between males and females under age 65 in 2020 were most pronounced in the large central metropolitan and large fringe metropolitan areas, where rates for males were about twice those of females.
Figure 3. COVID-19 death rates for people under age 65, by urbanicity of county of residence and sex: United States, 2020
1Rate significantly higher than for all other groups; p < 0.05.
2Rate significantly lower than for all other groups for males; p < 0.05.
3Rate significantly higher than for large fringe metropolitan; p < 0.05.
4Rate significantly higher than for large fringe metropolitan and micropolitan; p < 0.05.
5Rate significantly higher than for medium metropolitan and small metropolitan; p < 0.05.
6Rate significantly lower than for all other groups for females; p < 0.05.
7Rate significantly higher than for all other groups for females; p < 0.05.
NOTES: COVID-19 deaths are identified using the International Classification of Diseases, 10th Revision underlying cause-of-death code U07.1. Urban–rural classification of county of residence is based on the 2013 NCHS Urban–Rural Classification Scheme for Counties; see Data source and methods in this report. Access data table for Figure 3.
SOURCE: National Center for Health Statistics, National Vital Statistics System, Mortality.
Among males aged 65 and over, those in the most urban areas had the highest COVID-19 death rates; among females, rates were highest in the most urban and the most rural areas.
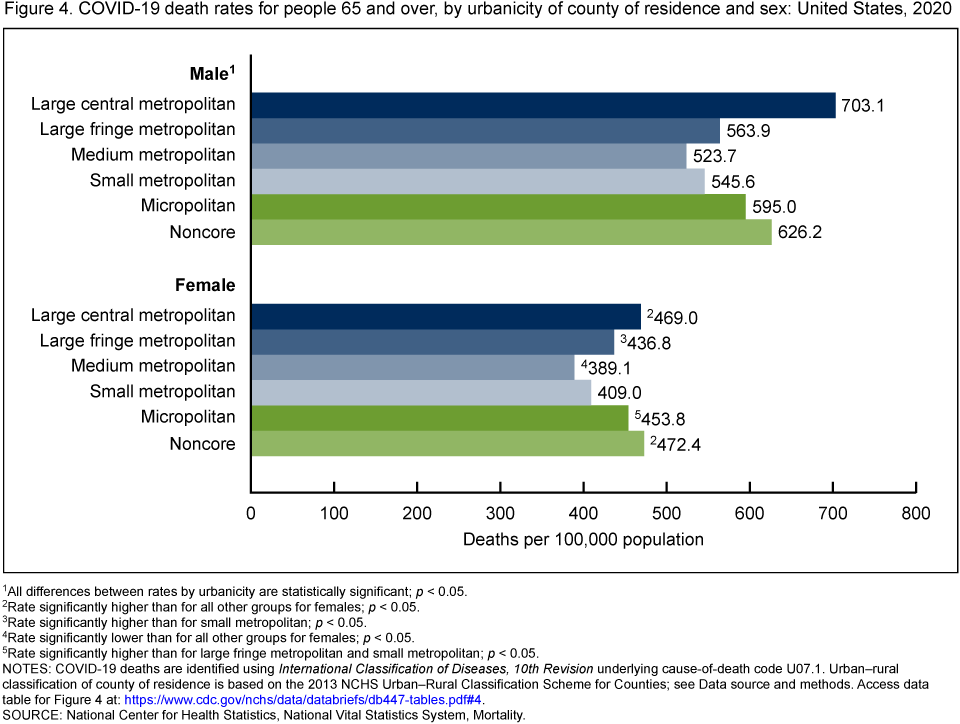
- For males aged 65 and over, those living in the most urban areas (large central metropolitan) had the highest COVID-19 death rate in 2020 (703.1 per 100,000), followed by noncore (626.2), micropolitan (595.0), large fringe metropolitan (563.9), and small metropolitan (545.6) areas (Figure 4).
- The medium metropolitan area had the lowest COVID-19 death rate in males aged 65 and over at 523.7.
- Females aged 65 and over in the most rural areas (noncore) (472.4) and the most urban areas (large central metropolitan) (469.0) had the two highest COVID-19 death rates in 2020, while those in medium metropolitan areas (389.1) had the lowest.
- COVID-19 death rates for females in micropolitan areas (453.8) were higher than in large fringe metropolitan (436.8) and small metropolitan (409.0) areas.
- The difference in COVID-19 death rates between males and females in 2020 was greatest in large central metropolitan areas, where the rate for males (703.1) was 50% higher than the rate for females (469.0).
Figure 4. COVID-19 death rates for people 65 and over, by urbanicity of county of residence and sex: United States, 2020
1All differences between rates by urbanicity are statistically significant; p < 0.05.
2Rate significantly higher than for all other groups for females; p < 0.05.
3Rate significantly higher than for small metropolitan; p < 0.05.
4Rate significantly lower than for all other groups for females; p < 0.05.
5Rate significantly higher than for large fringe metropolitan and small metropolitan; p < 0.05.
NOTES: COVID-19 deaths are identified using International Classification of Diseases, 10th Revision underlying cause-of-death code U07.1. Urban–rural classification of county of residence is based on the 2013 NCHS Urban–Rural Classification Scheme for Counties; see Data source and methods. Access data table for Figure 4.
SOURCE: National Center for Health Statistics, National Vital Statistics System, Mortality.
Summary
COVID-19 death rates were presented for six categories of urbanicity, ranging from the most urban (large central metropolitan) to the most rural (noncore). COVID-19 death rates for males were highest in the most urban areas for both those under and over age 65. For females, COVID-19 death rates were highest in the most rural areas for those under age 65 and in the most urban and most rural areas for those aged 65 and over. For both males and females, death rates were lowest in smaller urban areas, such as the large fringe metropolitan and small or medium metropolitan areas. These results show how a more detailed measure of urbanicity can result in a more precise analysis of COVID-19 death rates than is possible with the typical urban–rural dichotomy. For example, a previous study found that COVID death rates in 2020 were higher in nonmetropolitan (rural) than metropolitan (urban) counties in most months of 2020 (4). This report shows that both the highest and lowest death rates were experienced in areas classified as “urban” in most instances, so combining multiple levels of urbanicity into one group can mask these differences.
Death rates were always higher for males than females in all areas with the greatest differences in the large central metropolitan areas, where the male rate was twice that of the female rate for those under age 65 and 50% higher for those aged 65 and over.
Data source and methods
Data were analyzed using National Vital Statistics System multiple cause-of-death mortality files for 2020 and, along with population data, were tabulated using CDC WONDER’s underlying cause-of-death query tool (5). Population data for 2020 are July 1, 2020, postcensal estimates based on the 2010 census. Age-adjusted death rates in Figures 1 and 2 were calculated using the direct method and the 2000 U.S. standard population (6). Deaths to people assigned the International Classification of Diseases, 10th Revision underlying cause-of-death code for COVID-19 (U07.1) were selected (7). Analyses were restricted to U.S. residents.
The urbanization level of the decedent’s county of residence was categorized using the 2013 National Center for Health Statistics Urban–Rural Classification Scheme for Counties (3). Counties were classified into six urbanization levels based primarily on metropolitan–nonmetropolitan status and population distribution. The four metropolitan categories (large central metropolitan, large fringe metropolitan, medium metropolitan, and small metropolitan) were grouped as urban counties. The two nonmetropolitan categories (micropolitan and noncore) were grouped as rural counties.
Pairwise comparisons of rates in Figures 1–4 were conducted using the z test with an alpha level of 0.05 (6).
About the authors
Sally C. Curtin and Melonie Heron are with the National Center for Health Statistics, Division of Vital Statistics.
References
- Curtin SC, Spencer MR. Trends in death rates in urban and rural areas: United States, 1999–2019. NCHS Data Brief, no 417. Hyattsville, MD: National Center for Health Statistics. 2021. DOI: https://dx.doi.org/10.15620/cdc:109049.
- Xu JQ, Murphy SL, Kochanek KD, Arias E. Mortality in the United States, 2020. NCHS Data Brief, no 427. Hyattsville, MD: National Center for Health Statistics. 2021. DOI: https://dx.doi.org/10.15620/cdc:112079.
- Ingram DD, Franco SJ. 2013 NCHS urban–rural classification scheme for counties. National Center for Health Statistics. Vital Health Stat 2(166). 2014.
- Ullrich F, Mueller K. COVID-19 Cases and deaths, metropolitan and nonmetropolitan counties over time (update). Iowa City, IA: RUPRI Center for Rural Health Policy Analysis. 2022.
- Centers for Disease Control and Prevention. CDC WONDER. About underlying cause of death, 1999–2020. 2022.
- Murphy SL, Xu JQ, Kochannek KD. Arias E. Deaths: Final data for 2019. National Vital Statistics Reports; vol 70 no 8. Hyattsville, MD: National Center for Health Statistics. 2021. DOI: https://dx.doi.org/10.15620/cdc:106058.
- World Health Organization. International statistical classification of diseases and related health problems, 10th revision. 2008 ed. 2009.
Suggested citation
Curtin SC, Heron M. COVID-19 death rates in urban and rural areas: United States, 2020. NCHS Data Brief, no 447. Hyattsville, MD: National Center for Health Statistics. 2022. DOI: https://dx.doi.org/10.15620/cdc:121523.
Copyright information
All material appearing in this report is in the public domain and may be reproduced or copied without permission; citation as to source, however, is appreciated.
National Center for Health Statistics
Brian C. Moyer, Ph.D., Director
Amy M. Branum, Ph.D., Associate Director for Science
Division of Vital Statistics
Steven Schwartz, Ph.D., Director
Andrés A. Berruti, Ph.D., M.A., Associate Director for Science