COVID-19 Mortality in Adults Aged 65 and Over: United States, 2020
NCHS Data Brief No. 446, October 2022
PDF Version (542 KB)
Betzaida Tejada-Vera, M.S., and Ellen A. Kramarow, Ph.D.
- Key findings
- How did death rates for COVID-19 vary by age group and sex among adults aged 65 and over in 2020?
- How did age-adjusted COVID-19 death rates vary by race and ethnicity and sex among adults aged 65 and over in 2020?
- How did COVID-19 age-adjusted death rates for adults aged 65 and over vary by state in 2020?
- For adults aged 65 and over who died of COVID-19 in 2020, what was the percent distribution by place of death?
- Summary
Data from the National Vital Statistics System
- In 2020, the death rate for COVID-19 among adults aged 85 and over (1,645.0 per 100,000 population) was 2.8 times higher than the rate for ages 75–84 (589.8), and 7 times higher than that for ages 65–74 (234.3).
- Age-adjusted death rates for COVID-19 were higher for men than women for all race and Hispanic-origin groups among adults aged 65 and over.
- In 2020, age-adjusted death rates due to COVID-19 in the population aged 65 and over ranged from 90.5 in Hawaii to 872.0 in New Jersey.
- Among adults aged 85 and over, 38.9% of COVID-19 deaths occurred in a nursing home or long-term care facility compared with 19.2% among adults aged 75–84 and 9.7% among those aged 65–74.
COVID-19 was the underlying cause of death for a total of 350,381 deaths in the United States in 2020 (1). Although COVID-19 can affect people of any age, older adults were especially impacted during the first year of the pandemic: 81% of COVID-19 deaths in 2020 (282,836) occurred among those aged 65 and over. In this age group, COVID-19 was the third leading cause of death, after heart disease and cancer (1). This report describes COVID-19 mortality in 2020 by selected characteristics in the population aged 65 and over.
Keywords: older adults, death rates, race and ethnicity, National Vital Statistics System
How did death rates for COVID-19 vary by age group and sex among adults aged 65 and over in 2020?
- The COVID-19 age-adjusted death rate for the age 65 and over population was 533.5 per 100,000 standard population. The rate was 1.5 times higher for men (666.8) than women (433.0) (Figure 1).
- COVID-19 death rates were higher for men compared with women for all age groups: 65–74 (309.6 men, 168.5 women), 75–84 (757.5 men, 458.5 women), and 85 and over (1,925.3 men, 1,485.5 women).
- In 2020, the death rate for COVID-19 among those aged 65 and over increased with age. The rate for adults aged 85 and over (1,645.0) was 2.8 times higher than the rate for those aged 75–84 (589.8) and 7 times higher than that for age group 65–74 (234.3).
Figure 1. COVID-19 death rates for adults aged 65 and over, by age group and sex: United States, 2020
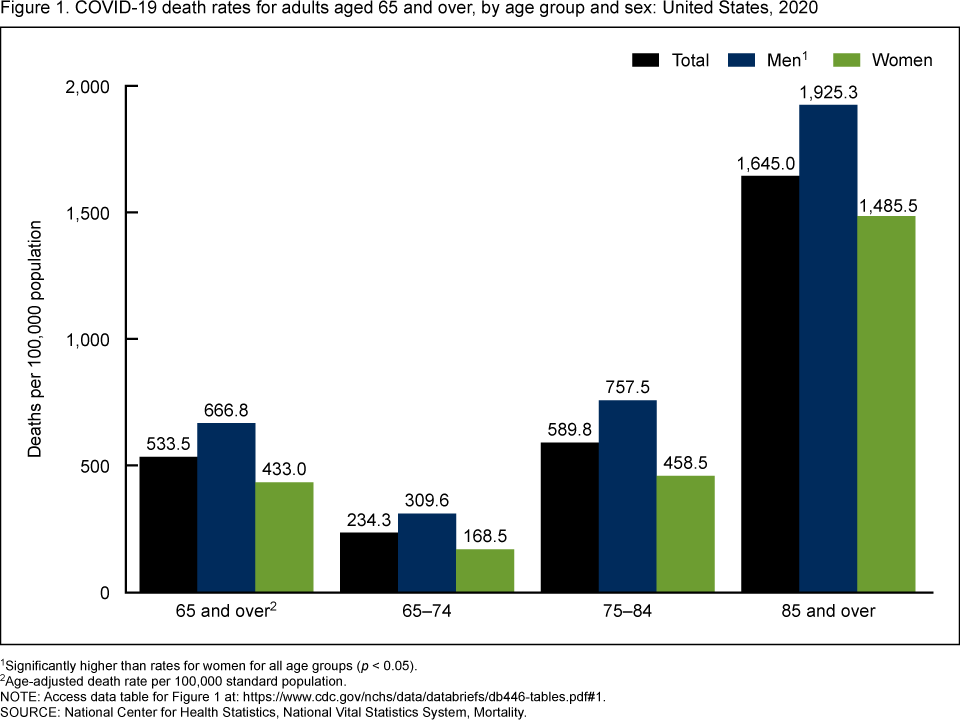
1Significantly higher than rates for women for all age groups (p < 0.05).
2Age-adjusted death rate per 100,000 standard population.
NOTE: Access data table for Figure 1.
SOURCE: National Center for Health Statistics, National Vital Statistics System, Mortality.
How did age-adjusted COVID-19 death rates vary by race and ethnicity and sex among adults aged 65 and over in 2020?
- Age-adjusted COVID-19 death rates were higher for men than women for all race and Hispanic-origin groups among adults aged 65 and over (Figure 2).
- Among men aged 65 and over, Hispanic men (1,228.1) experienced the highest death rate, followed by non-Hispanic Black (1,127.0) and non-Hispanic American Indian or Alaska Native (AIAN) (1,040.2) men.
- Non-Hispanic Native Hawaiian or Other Pacific Islander (NHOPI) men (608.1), non-Hispanic White men (563.1), and non-Hispanic Asian men (542.1) had the lowest death rates among men aged 65 and over, although the rate for non-Hispanic NHOPI men was not significantly different from the other two groups.
- Among women aged 65 and over, the highest COVID-19 death rate was for non-Hispanic AIAN women (768.2), followed by non-Hispanic Black (683.1) and Hispanic (664.7) women.
- Rates were lowest for women among non-Hispanic White (379.4), non-Hispanic NHOPI (371.1), and non-Hispanic Asian (307.8) women, although the rate for non-Hispanic NHOPI women was not significantly different from the other two groups.
Figure 2. Age-adjusted death rates due to COVID-19 for adults aged 65 and over, by single race, Hispanic origin, and sex: United States, 2020
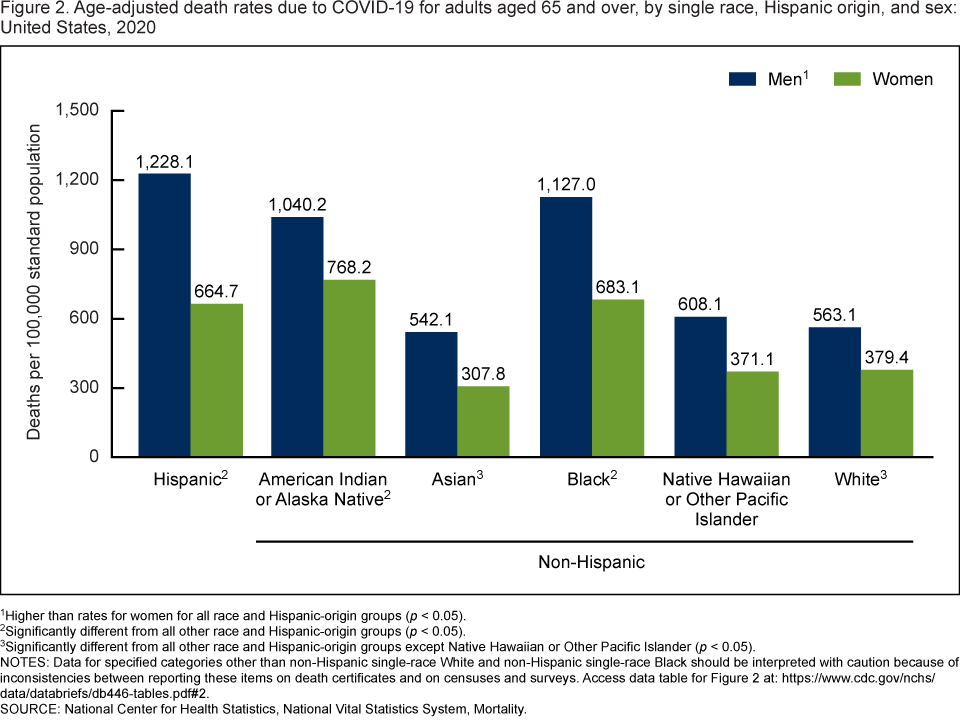
1Higher than rates for women for all race and Hispanic-origin groups (p < 0.05).
2Significantly different from all other race and Hispanic-origin groups (p < 0.05).
3Significantly different from all other race and Hispanic-origin groups except Native Hawaiian or Other Pacific Islander (p < 0.05).
NOTES: Data for specified categories other than non-Hispanic single-race White and non-Hispanic single-race Black should be interpreted with caution because of inconsistencies between reporting these items on death certificates and on censuses and surveys. Access data table for Figure 2.
SOURCE: National Center for Health Statistics, National Vital Statistics System, Mortality.
How did COVID-19 age-adjusted death rates for adults aged 65 and over vary by state in 2020?
- Among the 50 states and the District of Columbia (D.C.), age-adjusted COVID-19 death rates in the population aged 65 and over ranged from 90.5 in Hawaii to 872.0 in New Jersey. The average U.S. rate was 533.5 (Figure 3).
- The states with the highest COVID-19 age-adjusted death rates for adults aged 65 and over in 2020 were New Jersey (872.0), South Dakota (844.5), North Dakota (834.3), New York (831.9), Connecticut (772.8), and Rhode Island (729.1).
- The states with the lowest COVID-19 age-adjusted death rates for adults aged 65 and over were Hawaii (90.5), Vermont (113.9), Maine (142.8), Oregon (170.8), Alaska (234.1), and Washington (242.3).
Figure 3. Age-adjusted death rates due to COVID-19 for adults aged 65 and over, by state: United States, 2020
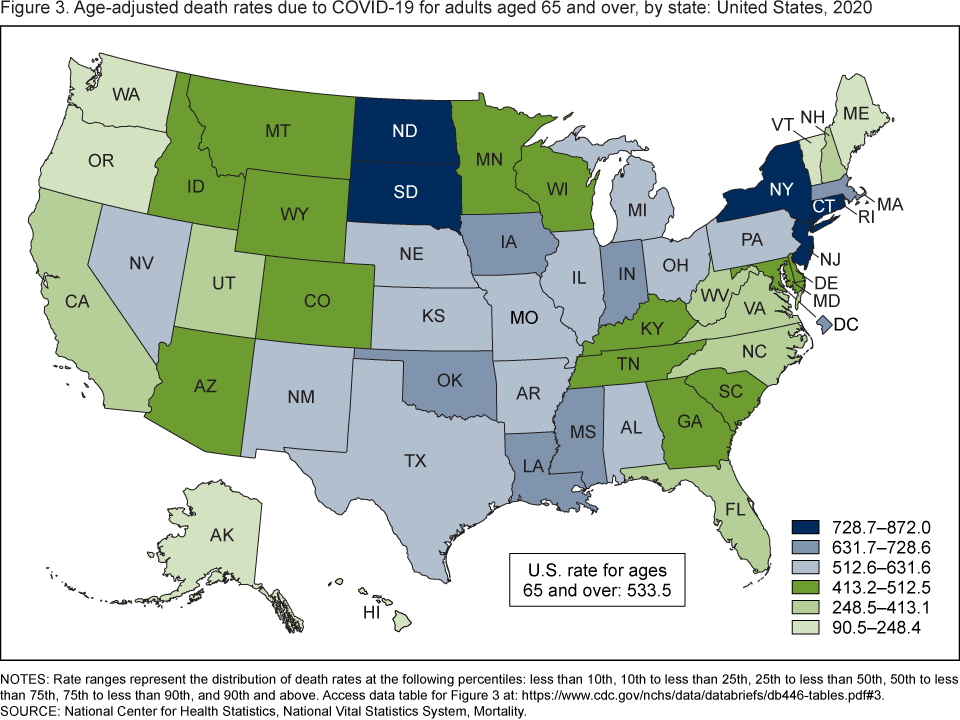
NOTES: Rate ranges represent the distribution of death rates at the following percentiles: less than 10th, 10th to less than 25th, 25th to less than 50th, 50th to less than 75th, 75th to less than 90th, and 90th and above. Access data table for Figure 3.
SOURCE: National Center for Health Statistics, National Vital Statistics System, Mortality.
For adults aged 65 and over who died of COVID-19 in 2020, what was the percent distribution by place of death?
- In 2020, 66.2% of deaths due to COVID-19 among adults aged 65 and over occurred in a healthcare setting compared with 24.3% in a nursing home or long-term care facility and 4.7% at home (Figure 4).
- The percentage of COVID-19 deaths that occurred in a healthcare setting decreased with age, from 82.8% among adults aged 65–74, to 72.0% among those aged 75–84, and 49.4% for those aged 85 and over.
- The percentage of COVID-19 deaths that took place in a nursing home or long-term care facility increased with age, from 9.7% among adults aged 65–74, to 19.2% among adults aged 75–84, and 38.9% among those aged 85 and over.
- The percentage of COVID-19 deaths that occurred at home was similar by age, with 4.9% for age groups 65–74 and 85 and over, and 4.4% among those aged 75–84.
Figure 4. Percent distribution of place of death for COVID-19 deaths in adults aged 65 and over: United States, 2020
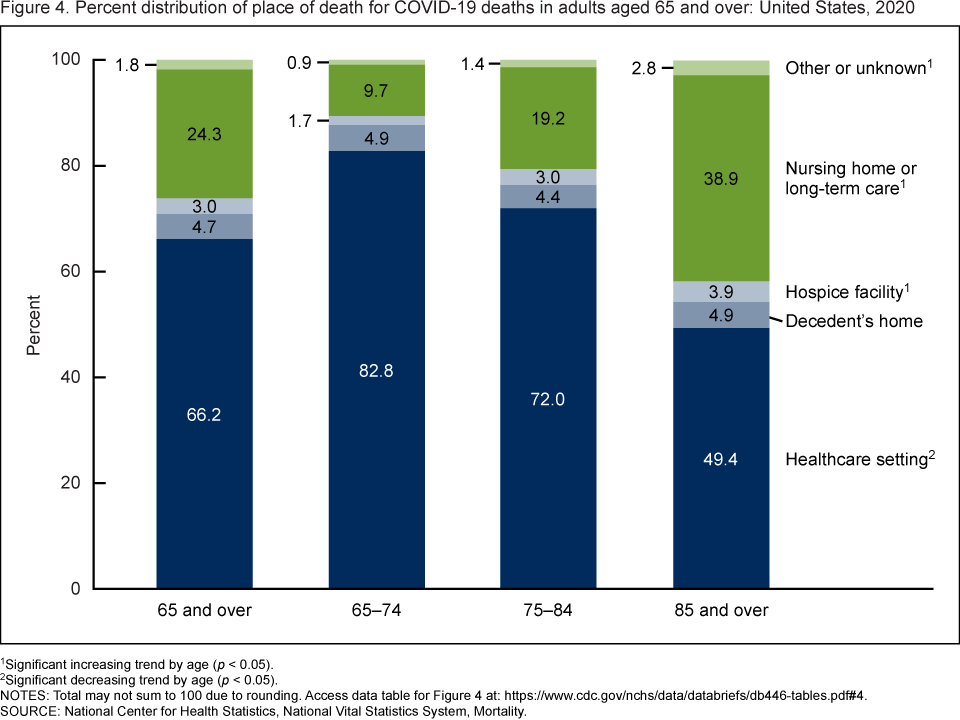
1Significant increasing trend by age (p < 0.05).
2Significant decreasing trend by age (p < 0.05).
NOTES: Total may not sum to 100 due to rounding. Access data table for Figure 4.
SOURCE: National Center for Health Statistics, National Vital Statistics System, Mortality.
Summary
This report presents U.S. mortality due to COVID-19 for the population aged 65 and over during 2020. Overall, the number of deaths among adults aged 65 and over for which COVID-19 was the underlying cause of death was 282,836, comprising 81% of total COVID-19 deaths in the United States in 2020 (1). COVID-19 mortality increased with age—the COVID-19 death rate among adults aged 85 and over was 2.8 times higher than the rate for adults aged 75–84 and 7 times higher than the rate for adults aged 65–74. Among both men and women aged 65 and over, age-adjusted death rates for COVID-19 were highest among Hispanic, non-Hispanic Black, and non-Hispanic AIAN adults compared with other race and Hispanic-origin groups. Overall, most COVID-19 deaths in people aged 65 and over occurred in healthcare settings. By comparison, 38.9% of COVID-19 deaths in adults aged 85 and over were in a nursing home or long-term care facility. COVID-19 death rates in 2020 varied widely by state, with the highest rates for adults aged 65 and over found in New Jersey, South Dakota, North Dakota, New York, Connecticut, and Rhode Island. The findings in this report are based on 2020 final mortality data and may differ from previously published provisional data.
Definitions
Cause of death: Based on medical information—including injury diagnoses and external causes of injury—entered on death certificates registered in the United States. This information is classified and coded according to the International Statistical Classification of Diseases and Related Health Problems, 10th Revision (2).
Death rates: Estimated for 2020 based on postcensal population estimates for July 1, 2020, that are consistent with the April 1, 2010, census. These population estimates are available on the CDC WONDER website (1). Age-adjusted death rates are useful when comparing different populations because they remove the potential bias that can occur when the populations being compared have different age structures (3).
Place of death: Reported on the death certificate and determined by where the death was pronounced and the physical location where the death occurred (4). Place of death responses on death certificates are: hospital (inpatient, emergency room or outpatient, or dead on arrival); hospice facility; nursing home or long-term care facility; decedent’s home; or other (5). Healthcare setting includes hospitals, clinics, medical facilities, or other licensed institutions providing diagnostic and therapeutic services by medical staff. Place of death reported on death certificates as other or unknown are presented as a single category.
Data source and methods
The data presented in this report reflect information collected by the National Center for Health Statistics for 2020 from death certificates filed in all 50 states and D.C. and compiled for the National Vital Statistics System. Death rates are calculated based on postcensal population estimates as of July 1, 2020, which are consistent with the April 1, 2010, census. The race and Hispanic-origin groups shown follow the 1997 Office of Management and Budget (OMB) standards and differ from the bridged-race categories used for data years before 2018 (6). Race and Hispanic origin were categorized based on the 1997 OMB standards with all race categories representing “single race,” meaning that only one race was reported on the death certificate. Data for the Hispanic population include people of any race. Death rates for non-Hispanic Asian, non-Hispanic AIAN, and Hispanic people may be affected by misclassification of race and Hispanic origin on death certificates. This misclassification could result in underreporting of deaths for these groups by about 3% for non-Hispanic Asian and Hispanic people, and by an estimated 33% for non-Hispanic AIAN people (7,8). Trends are statistically significant at the 0.05 level and were assessed using the Cochran–Armitage test for trends, a modified chi-squared test. Pairwise comparisons of rates (as in age-adjusted rates for men compared with women) were conducted using a z test with an alpha level of 0.05 (9).
About the authors
Betzaida Tejada-Vera is with the National Center for Health Statistics (NCHS), Division of Vital Statistics, and Ellen A. Kramarow is with the NCHS Division of Analysis and Epidemiology.
References
- Centers for Disease Control and Prevention. CDC WONDER. Single-race population estimates, 2018–2020.
- World Health Organization. International statistical classification of diseases and related health problems, 10th revision (ICD–10). 5th ed. 2016.
- Anderson RN, Rosenberg HM. Age standardization of death rates: Implementation of the year 2000 standard. National Vital Statistics Reports; vol 47 no. 3. Hyattsville, MD: National Center for Health Statistics. 1998.
- Curtin SC, Tolson G, Arias E, Anderson RN. Funeral director’s handbook: Death registration and fetal death reporting. Hyattsville, MD: National Center for Health Statistics. 2019.
- National Center for Health Statistics. U.S. Standard Certificate of Death. 2003.
- Office of Management and Budget. Revisions to the standards for the classification of federal data on race and ethnicity. Fed Regist 62(210):58782–90. 1997.
- Arias E, Heron M, Hakes JK. The validity of race and Hispanic-origin reporting on death certificates in the United States: An update. National Center for Health Statistics. Vital Health Stat 2(172). 2016.
- Arias E, Xu JQ, Curtin S, Bastian B, Tejada-Vera B. Mortality profile of the non-Hispanic American Indian or Alaska Native population, 2019. National Vital Statistics Reports; vol 70 no 12. Hyattsville, MD: National Center for Health Statistics. 2021. DOI: https://dx.doi.org/10.15620/cdc:110370.
- Xu JQ, Murphy SL, Kochanek KD, Arias E. Deaths: Final data for 2019. National Vital Statistics Reports; vol 70 no 8. Hyattsville, MD: National Center for Health Statistics. 2021. DOI: https://dx.doi.org/10.15620/cdc:106058.
Suggested citation
Tejada-Vera B, Kramarow EA. COVID-19 mortality in adults aged 65 and over: United States, 2020. NCHS Data Brief, no 446. Hyattsville, MD: National Center for Health Statistics. 2022. DOI: https://dx.doi.org/10.15620/cdc:121320.
Copyright information
All material appearing in this report is in the public domain and may be reproduced or copied without permission; citation as to source, however, is appreciated.
National Center for Health Statistics
Brian C. Moyer, Ph.D., Director
Amy M. Branum, Ph.D., Associate Director for Science
Division of Vital Statistics
Steven Schwartz, Ph.D., Director
Andrés A. Berruti, Ph.D., M.A., Associate Director for Science
Division of Analysis and Epidemiology
Irma E. Arispe, Ph.D., Director
Kevin C. Heslin, Ph.D., Associate Director for Science