Organized Sports Participation Among Children Aged 6–17 Years: United States, 2020
NCHS Data Brief No. 441, August 2022
PDF Version (437 KB) | Visual Abstract
Lindsey I. Black, M.P.H., Emily P. Terlizzi, M.P.H., and Anjel Vahratian, Ph.D., M.P.H.
- Key findings
- Participation in sports varied by race, but not significantly by sex or age group.
- Participation in sports varied by parental education.
- The percentage of children that participated in sports varied by family income and social vulnerability of county.
- Participation in sports varied by U.S. region.
- Summary
Data from the National Health Interview Survey
- In 2020, 54.1% of children aged 6–17 years participated in sports during the past 12 months.
- The higher the level of parents’ education, the more likely children and adolescents were to participate in sports.
- As family income increased, the more likely children and adolescents were to participate in sports.
- Children and adolescents in the South were less likely to participate in sports (48.7%) compared with all other regions of the country.
Sports team participation has been associated with increased levels of physical activity (1) and improved physical and mental health among children and adolescents (2,3). Disparities in sports participation have been found across age, sex, race, disability, and socioeconomic subgroups (4–6). This report describes national estimates of parent-reported organized sports participation during the past 12 months among children aged 6–17 years. Data from the 2020 National Health Interview Survey (NHIS) are analyzed by sociodemographic characteristics.
Keywords: physical activity, adolescents, team sports, National Health Interview Survey
Participation in sports varied by race, but not significantly by sex or age group.
In 2020, just over one-half of children aged 6–17 years (54.1%) participated in sports during the past 12 months (Figure 1). While the percentage of children that participated in sports was higher for boys (56.1%) compared with girls (52.0%) and for children aged 12–17 years (55.6%) compared with children aged 6–11 (52.5%), these observed differences were not significant. Non-Hispanic White children (60.4%) were more likely to have participated in sports compared with non-Hispanic Black (42.1%), Hispanic (46.9%), and non-Hispanic Asian (51.4%) children. All other observed differences by race and Hispanic origin were not significant.
Figure 1. Percentage of children aged 6–17 years that participated in sports in the past 12 months, by sex, age group, and race and Hispanic origin: United States, 2020
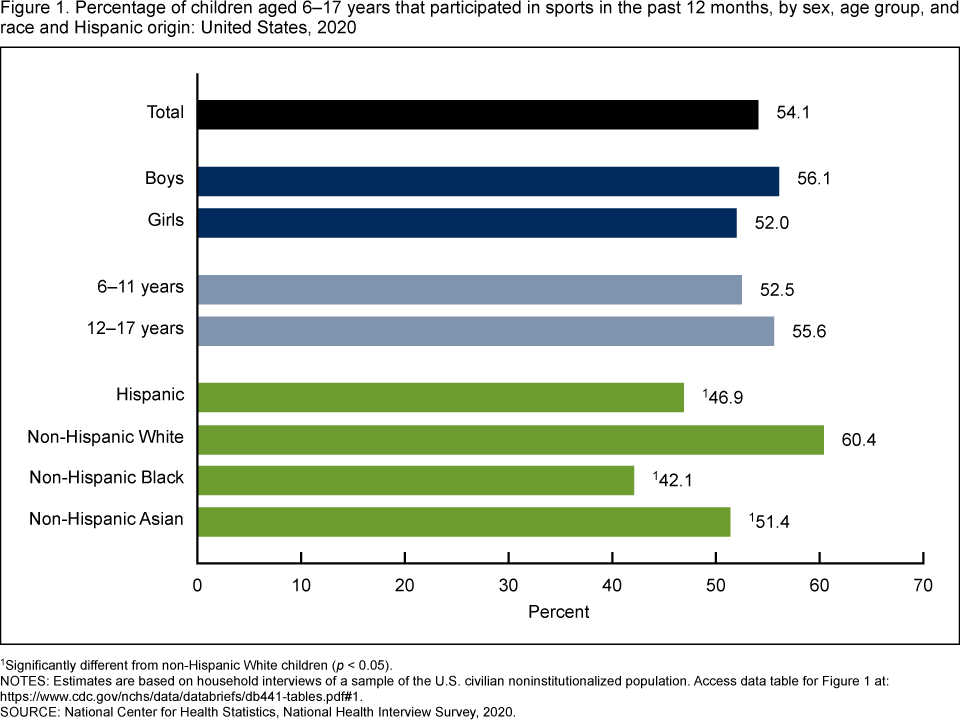
1Significantly different from non-Hispanic White children (p < 0.05).
NOTES: Estimates are based on household interviews of a sample of the U.S. civilian noninstitutionalized population. Access data table for Figure 1.
SOURCE: National Center for Health Statistics, National Health Interview Survey, 2020.
Participation in sports varied by parental education.
The percentage of children and adolescents that participated in sports increased with increasing parental education, from 36.8% of children who lived in households with parents who had a high school education or less to 67.6% of children who lived in households with parents who had a bachelor’s degree or higher (Figure 2).
Figure 2. Percentage of children aged 6–17 years that participated in sports in the past 12 months, by parental education: United States, 2020
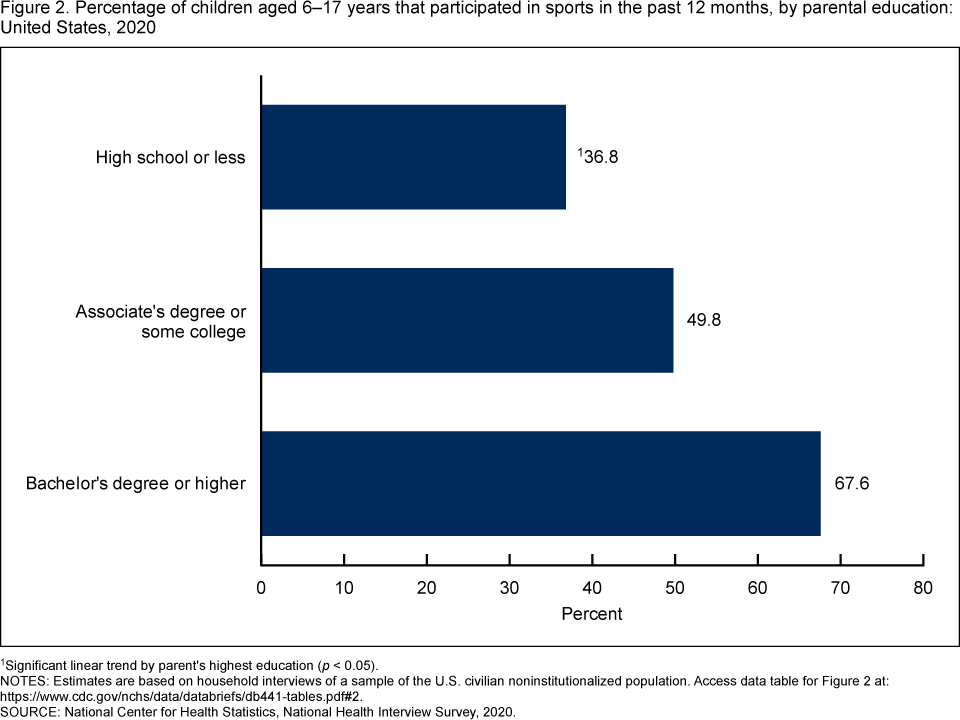
1Significant linear trend by parent’s highest education (p < 0.05).
NOTES: Estimates are based on household interviews of a sample of the U.S. civilian noninstitutionalized population. Access data table for Figure 2.
SOURCE: National Center for Health Statistics, National Health Interview Survey, 2020.
The percentage of children that participated in sports varied by family income and social vulnerability of county.
Sports participation increased with increasing family income, from 31.2% among children with a family income of less than 100% of the federal poverty level (FPL) to 70.2% among children with a family income of 400% or more of FPL (Figure 3). The percentage of children aged 6-17 years that participated in sports during the past 12 months decreased as the social vulnerability of the county they lived in increased. This ranged from 61.4% among those living in counties with little to no social vulnerability to 44.5% for those living in counties with high social vulnerability.
Figure 3. Percentage of children aged 6–17 years that participated in sports in the past 12 months, by family income as percentage of federal poverty level and social vulnerability of county: United States, 2020
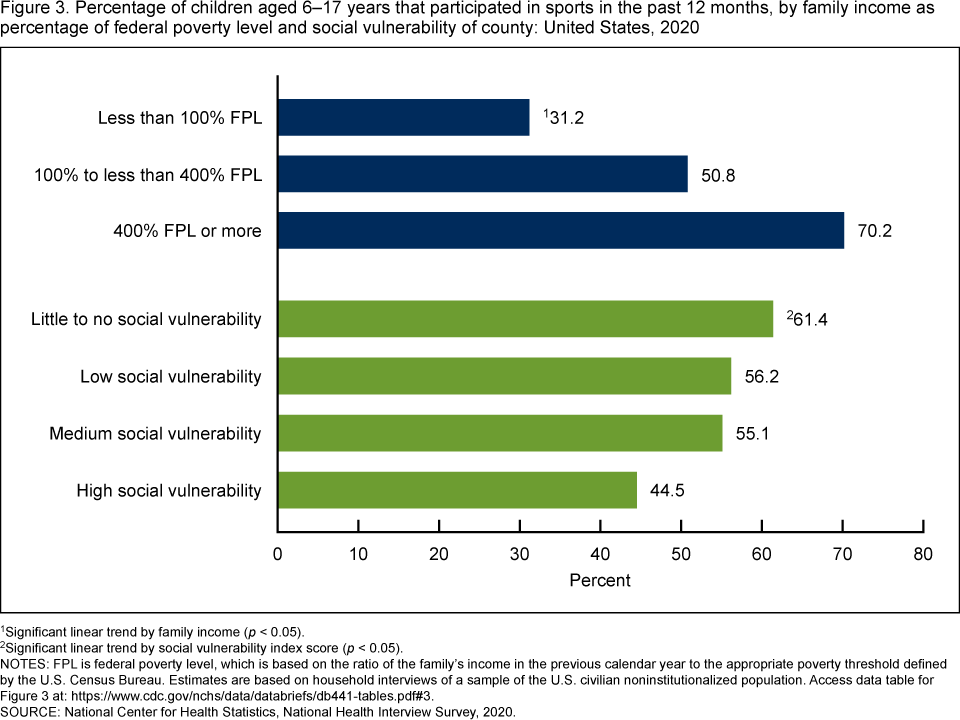
1Significant linear trend by family income (p < 0.05).
2Significant linear trend by social vulnerability index score (p < 0.05).
NOTES: FPL is federal poverty level, which is based on the ratio of the family’s income in the previous calendar year to the appropriate poverty threshold defined by the U.S. Census Bureau. Estimates are based on household interviews of a sample of the U.S. civilian noninstitutionalized population. Access data table for Figure 3.
SOURCE: National Center for Health Statistics, National Health Interview Survey, 2020.
Participation in sports varied by U.S. region.
Children were significantly less likely to participate in sports during the past 12 months if they lived in the South (48.7%) compared with those living in the Northeast (58.4%), Midwest (58.6%), and West (56.0%) (Figure 4). Children’s sports participation was similar by urbanicity, ranging from 51.2% in medium and small metropolitan areas to 56.7% in large central metropolitan areas.
Figure 4. Percentage of children aged 6–17 years that participated in sports in the past 12 months, by region and urbanicity: United States, 2020
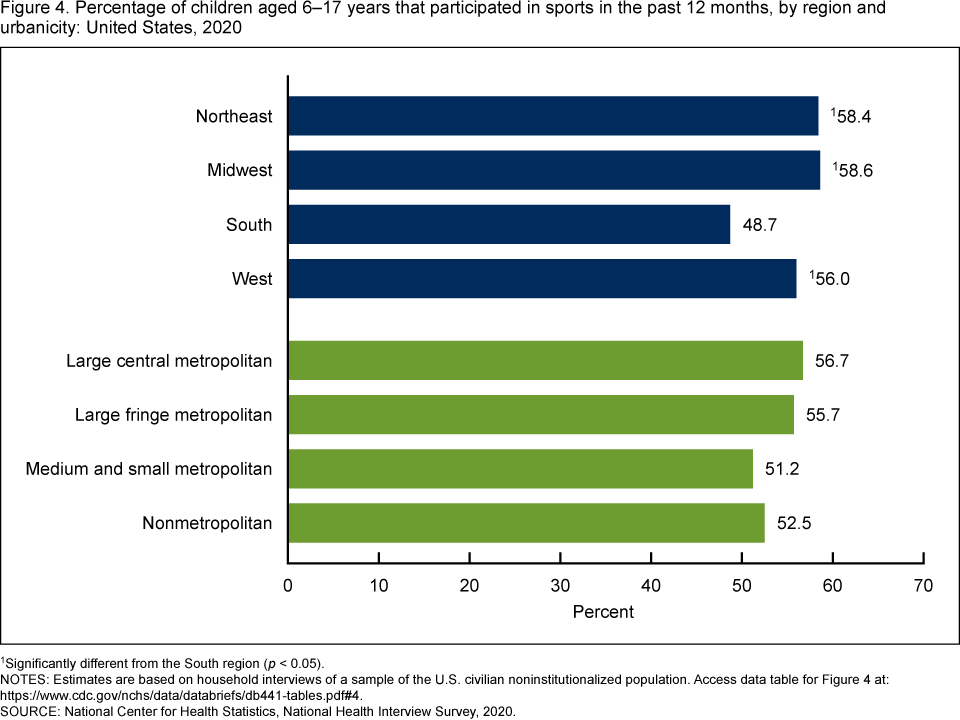
11Significantly different from the South region (p < 0.05).
NOTES: Estimates are based on household interviews of a sample of the U.S. civilian noninstitutionalized population. Access data table for Figure 4.
SOURCE: National Center for Health Statistics, National Health Interview Survey, 2020.
Summary
In 2020, 54.1% of children aged 6-17 years participated in sports in the past 12 months. However, differences in participation were reported across select demographic, socioeconomic, and geographic characteristics. Participation levels were lower among children from a racial and ethnic minority group, children whose parents had lower education levels and family income, children who lived in counties with higher social vulnerability, and children who lived in the South. Lack of participation in sports has been associated in other studies with lower levels of physical activity (1) and reduced physical and mental health among children and adolescents (2,3).
This measure of sports participation is based on a 12-month reference period and, as a result, cannot be used to determine if participation was before or during the COVID-19 pandemic. Consequently, the results of this report should not be interpreted as describing the percentage of children participating in sports during the COVID-19 pandemic. Data from the 2022 NHIS may provide an opportunity to further examine children’s sports participation as social distancing guidelines lessened and vaccination for COVID-19 became available among school-age children.
Definitions
Family income as a percentage of federal poverty level (FPL): Based on the ratio of a family’s income in the previous calendar year to the appropriate poverty threshold (given the family’s size and number of children) defined by the U.S. Census Bureau. The 2020 NHIS imputed income files were used to allow for imputed values when family income was not provided.
Race and Hispanic origin: Children categorized as Hispanic may be of any race or combination of races. Children categorized as non-Hispanic White, non-Hispanic Black, or non-Hispanic Asian indicated one race only. Estimates for non-Hispanic children of other races are not shown.
Region: In the geographic classification of the U.S. population, states are grouped into four regions defined by the U.S. Census Bureau:
- Northeast: Connecticut, Maine, Massachusetts, New Hampshire, New Jersey, New York, Pennsylvania, Rhode Island, and Vermont
- Midwest: Illinois, Indiana, Iowa, Kansas, Michigan, Minnesota, Missouri, Nebraska, North Dakota, Ohio, South Dakota, and Wisconsin
- South: Alabama, Arkansas, Delaware, District of Columbia, Florida, Georgia, Kentucky, Louisiana, Maryland, Mississippi, North Carolina, Oklahoma, South Carolina, Tennessee, Texas, Virginia, and West Virginia
- West: Alaska, Arizona, California, Colorado, Hawaii, Idaho, Montana, Nevada, New Mexico, Oregon, Utah, Washington, and Wyoming
Social vulnerability: Based on the Social Vulnerability Index (SVI), which uses U.S. Census Bureau data to determine the social vulnerability of every census tract. The index was developed at the Centers for Disease Control and Prevention (CDC) by the Agency for Toxic Substance and Disease Registry’s (ATSDR) Geospatial Research, Analysis, and Services Program (GRASP). SVI ranks each U.S. census tract on 15 social factors, which are then grouped into four related themes: socioeconomic status, household composition and disability, racial and ethnic minority status and language, and housing type and transportation. SVI indicates the relative vulnerability of every census tract as a percentile ranking ranging from 0 to 1, with higher values indicating greater vulnerability. The overall tract summary ranking variable for 2018 was used to categorize four quartiles of vulnerability: Scores from 0 to 0.2500 are categorized as “little to no social vulnerability,” 0.2501–0.500 are “low social vulnerability,” 0.5001–0.7500 are “medium social vulnerability,” and 0.7501–1.0 are “high social vulnerability.” For more information on SVI, visit the CDC/ATSDR GRASP website.
Sports participation: Based on an affirmative response to the survey question, “In the past 12 months, did [Sample Child] play or participate on a sports team or club or take sports lessons either at school or in the community?”
Urbanicity: Categorized by collapsing the 2013 National Center for Health Statistics (NCHS) urban-rural classification scheme for counties (7) into four categories: large central metropolitan, large fringe metropolitan, medium and small metropolitan, and nonmetropolitan (counties in micropolitan statistical areas and nonmetropolitan counties).
Data sources and methods
Data from the 2020 NHIS were used for this analysis. NHIS is a nationally representative household survey of the U.S. civilian noninstitutionalized population. It is conducted continuously throughout the year by NCHS. Interviews are typically conducted in respondents’ homes, but follow-ups to complete interviews may be held over the telephone. Because of the COVID-19 pandemic, data collection procedures in 2020 were disrupted: From April to June, interviews were conducted by telephone only, and from July to December, interviews were attempted by telephone first, with follow-ups to complete interviews by personal visit. For more information about NHIS, visit: https://www.cdc.gov/nchs/nhis.
Point estimates and corresponding confidence intervals for this analysis were calculated using SAS-callable SUDAAN software (8) to account for the complex sample design of NHIS. All estimates are based on parent or guardian report and meet NCHS data presentation standards for proportions (9). Differences between percentages were evaluated using two-sided significance tests at the 0.05 level. Trends by parental education, family income, social vulnerability, and urbanicity were evaluated using orthogonal polynomials in logistic regression.
About the authors
Lindsey I. Black, Emily P. Terlizzi, and Anjel Vahratian are with the NCHS Division of Health Interview Statistics.
References
- Loprinzi PD, Cardinal BJ, Cardinal MK, Corbin CB. Physical education and sport: Does participation relate to physical activity patterns, observed fitness, and personal attitudes and beliefs? Am J Health Promot 32(3):613-20. 2018.
- Ortega FB, Ruize JR, Castillo MJ, Sjöström M. Physical fitness in childhood and adolescence: A powerful marker of health. Int J Obes 32(1):1-11. 2008.
- Li X, Chi G, Taylor A, Chen ST, Memon AR, Zhang Y, et al. Lifestyle behaviors and suicide-related behaviors in adolescents: Cross-sectional study using the 2019 YRBS data. Front Public Health 9:766972. 2021.
- Owen KB, Nau T, Reece LJ, Bellew W, Rose C, Bauman A, et al. Fair play? Participation equity in organised sport and physical activity among children and adolescents in high income countries: A systematic review and meta-analysis. Int J Behav Nutr Phys Act 19(1):27. 2022.
- Ross SM, Smit E, Yun J, Bogart K, Hatfield B, Logan SW. Updated national estimates of disparities in physical activity and sports participation experienced by children and adolescents with disabilities: NSCH 2016-2017. J Phys Act Health 17(4):443-55. 2020.
- Pate RR, Saunders RP, Taverno Ross SE, Dowda M. Patterns of age-related change in physical activity during the transition from elementary to high school. Prev Med Rep 26:101712. 2022.
- Ingram DD, Franco SJ. 2013 NCHS urban-rural classification scheme for counties. National Center for Health Statistics. Vital Health Stat 2(166). 2014.
- RTI International. SUDAAN (Release 11.0.3) [computer software]. 2018.
- Parker JD, Talih M, Malec DJ, Beresovsky V, Carroll M, Gonzalez JF Jr, et al. National Center for Health Statistics data presentation standards for proportions. National Center for Health Statistics. Vital Health Stat 2(175). 2017.
Suggested citation
Black LI, Terlizzi EP, Vahratian A. Organized sports participation among children aged 6–17 years: United States, 2020. NCHS Data Brief, no 441. Hyattsville, MD: National Center for Health Statistics. 2022. DOI: https://dx.doi.org/10.15620/cdc:119026.
Copyright information
All material appearing in this report is in the public domain and may be reproduced or copied without permission; citation as to source, however, is appreciated.
National Center for Health Statistics
Brian C. Moyer, Ph.D., Director
Amy M. Branum, Ph.D., Associate Director for Science
Division of Health Interview Statistics
Stephen J. Blumberg, Ph.D., Director
Anjel Vahratian, Ph.D., M.P.H., Associate Director for Science