Physical, Speech, Rehabilitative, or Occupational Therapy Use Among Adults Aged 25–64, by Veteran Status: United States, 2019–2020
NCHS Data Brief No. 439, August 2022
PDF Version (501 KB) | Visual Abstract
Peter Boersma, M.P.H., and Robin A. Cohen, Ph.D.
- Key findings
- The percentage of adults aged 25–64 who received physical, speech, rehabilitative, or occupational therapy in the past 12 months varied by veteran status and varied by sex among nonveterans.
- Receipt of therapy differed by veteran status and age.
- Receipt of therapy increased with increasing education among veterans and nonveterans.
- Receipt of therapy was greater among veterans and nonveterans with disabilities.
- The percentage of adults who received therapy was higher among veterans than nonveterans for those in large fringe metropolitan, medium and small metropolitan, and nonmetropolitan areas.
Data from the National Health Interview Survey
- For 2019–2020, among adults aged 25–64, veterans (13.6%) were more likely than nonveterans (9.0%) to have received physical, speech, rehabilitative, or occupational therapy in the past 12 months.
- The percentage who received therapy was higher among veterans than nonveterans in all age groups examined.
- Among both veterans and nonveterans, receipt of therapy increased with increasing education level.
- For 2019–2020, 33.6% of veterans with disability and 23.9% of nonveterans with disability received therapy.
- Among veterans, the percentage who received therapy increased with decreasing levels of urbanicity.
The aim of physical, speech, rehabilitative, and occupational therapy is to restore health, independence, and quality of life by addressing a range of health-related conditions that limit people’s abilities to perform functional activities in their daily lives (1). Because functional ability is closely related to participation in society, it is an important dimension of health (2). Veterans have greater prevalence of disability and chronic pain than nonveterans (2,3), which may limit functional abilities. This report describes the use of physical, speech, rehabilitative, or occupational therapy in the past 12 months by veteran status and selected sociodemographic characteristics among adults aged 25–64.
Keywords: treatment, rehabilitation, National Health Interview Survey, NHIS
The percentage of adults aged 25–64 who received physical, speech, rehabilitative, or occupational therapy in the past 12 months varied by veteran status and varied by sex among nonveterans.
- For 2019–2020, the percentage of adults aged 25–64 who received physical, speech, rehabilitative, or occupational therapy in the past 12 months was higher among veterans (13.6%) than among nonveterans (9.0%) (Figure 1).
- Among men, veterans (13.4%) were more likely than nonveterans (7.3%) to receive therapy. Similar differences between veterans (14.8%) and nonveterans (10.5%) were seen among women.
- Among veterans, men (13.4%) were as likely as women (14.8%) to receive therapy.
- Among nonveterans, men (7.3%) were less likely than women (10.5%) to receive therapy.
Figure 1. Percentage of adults aged 25–64 who received physical, speech, rehabilitative, or occupational therapy in the past 12 months, by veteran status and sex: United States, 2019–2020
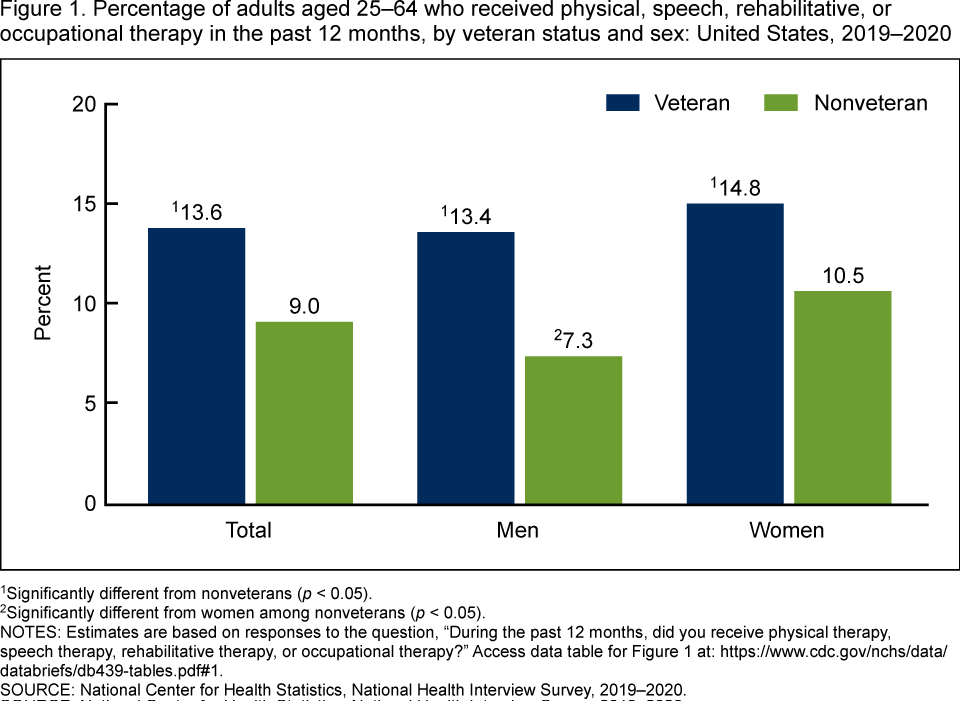
1Significantly different from nonveterans (p < 0.05).
2Significantly different from women among nonveterans (p < 0.05).
NOTES: Estimates are based on responses to the question, “During the past 12 months, did you receive physical therapy, speech therapy, rehabilitative therapy, or occupational therapy?” Access data table for Figure 1 .
SOURCE: National Center for Health Statistics, National Health Interview Survey, 2019–2020.
Receipt of therapy differed by veteran status and age.
- Among veterans, the percentage who received therapy was 12.4% among those aged 25–34, 11.9% among those aged 35–49, and 15.2% among those aged 50–64 (Figure 2). The trend by age was not significant.
- Among nonveterans, the percentage of adults who received therapy increased with increasing age, from 5.2% for those aged 25–34 and 8.5% for those aged 35–49, to 12.3% for those aged 50–64.
Figure 2. Percentage of adults aged 25–64 who received physical, speech, rehabilitative, or occupational therapy in the past 12 months, by veteran status and age group: United States, 2019–2020
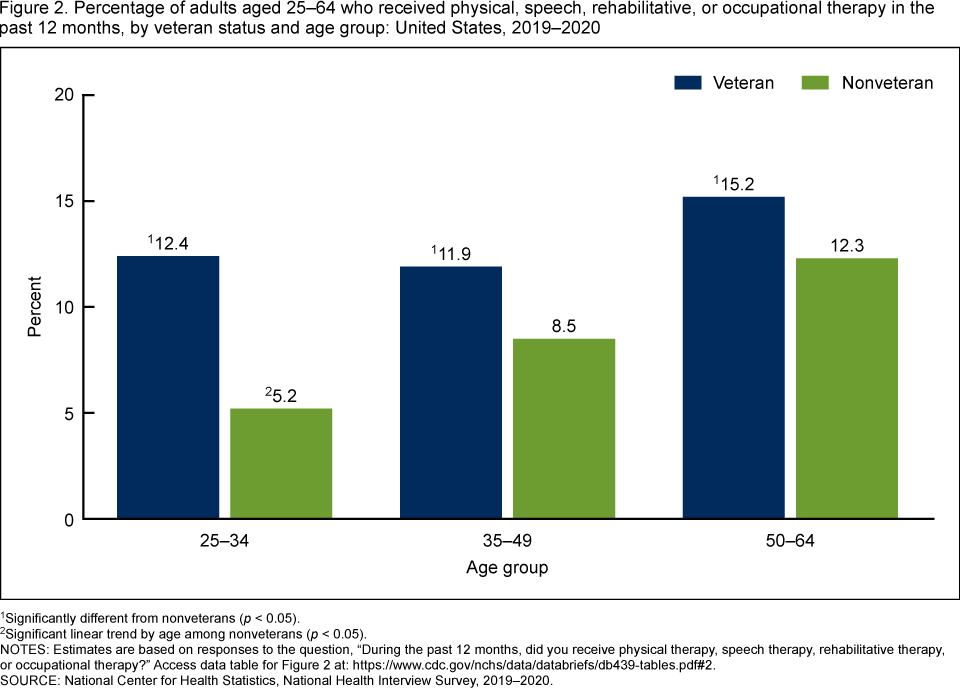
1Significantly different from nonveterans (p < 0.05).
2Significant linear trend by age among nonveterans (p < 0.05).
NOTES: Estimates are based on responses to the question, “During the past 12 months, did you receive physical therapy, speech therapy, rehabilitative therapy, or occupational therapy?” Access data table for Figure 2.
SOURCE: National Center for Health Statistics, National Health Interview Survey, 2019–2020.
Receipt of therapy increased with increasing education among veterans and nonveterans.
- Among veterans, the percentage of adults who received therapy increased with increasing education level: from 11.5% among those with a high school diploma or less, to 13.1% among those with some college, to 16.2% among those with a college degree or higher (Figure 3).
- Among nonveterans, the percentage who received therapy increased from 7.9% among those with a high school diploma or less, to 9.4% among those with some college, to 9.8% among those with a college degree or higher.
Figure 3. Percentage of adults aged 25–64 who received physical, speech, rehabilitative, or occupational therapy in the past 12 months, by veteran status and education level: United States, 2019–2020
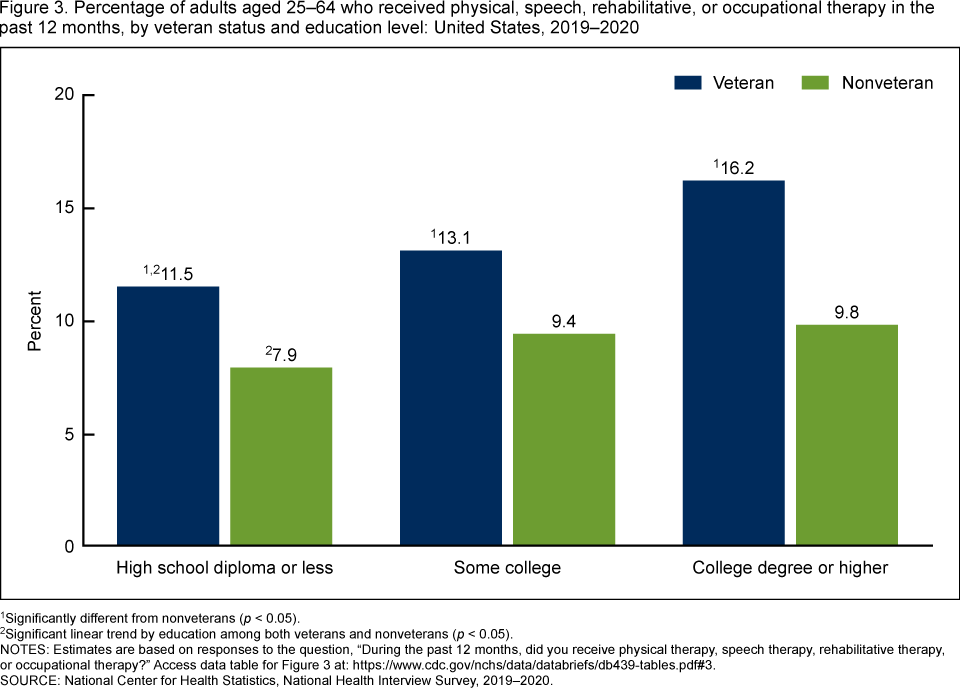
1Significantly different from nonveterans (p < 0.05).
2Significant linear trend by education among both veterans and nonveterans (p < 0.05).
NOTES: Estimates are based on responses to the question, “During the past 12 months, did you receive physical therapy, speech therapy, rehabilitative therapy, or occupational therapy?” Access data table for Figure 3.
SOURCE: National Center for Health Statistics, National Health Interview Survey, 2019–2020.
Receipt of therapy was greater among veterans and nonveterans with disabilities.
- The percentage of adults who received therapy was almost three times higher among those with disability than those without disability for both veterans and nonveterans (Figure 4).
- Among adults with disability, 33.6% of veterans and 23.9% of nonveterans received therapy in the past 12 months. Among adults without disability, 11.7% of veterans and 8.0% of nonveterans received therapy.
Figure 4. Percentage of adults aged 25–64 who received physical, speech, rehabilitative, or occupational therapy in the past 12 months, by veteran status and disability status: United States, 2019–2020
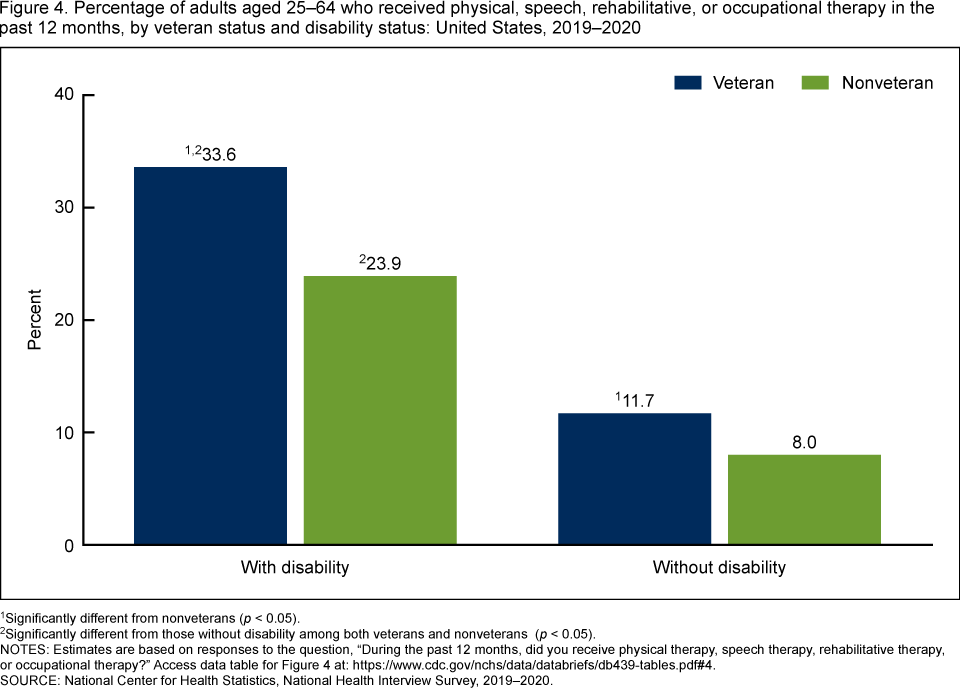
1Significantly different from nonveterans (p < 0.05).
2Significantly different from those without disability among both veterans and nonveterans (p < 0.05).
NOTES: Estimates are based on responses to the question, “During the past 12 months, did you receive physical therapy, speech therapy, rehabilitative therapy, or occupational therapy?” Access data table for Figure 4
SOURCE: National Center for Health Statistics, National Health Interview Survey, 2019–2020.
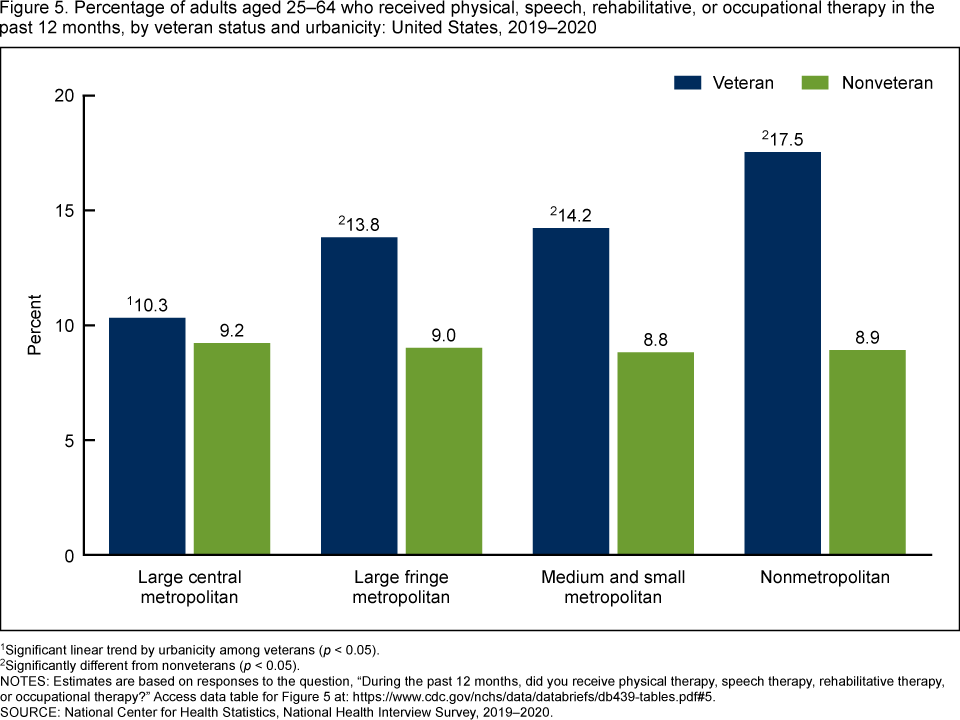
The percentage of adults who received therapy was higher among veterans than nonveterans for those in large fringe metropolitan, medium and small metropolitan, and nonmetropolitan areas.
- Among veterans, the percentage of adults who received therapy increased as urbanization level decreased, from 10.3% in large central metropolitan areas to 17.5% in nonmetropolitan areas (Figure 5).
- Among nonveterans, no significant trends were found by urbanization level, with around 9% receiving therapy.
- Among adults in large fringe metropolitan, medium and small metropolitan, and nonmetropolitan areas, veterans were more likely than nonveterans to receive therapy. No significant difference was found by veteran status among adults in large central metropolitan areas.
Figure 5. Percentage of adults aged 25–64 who received physical, speech, rehabilitative, or occupational therapy in the past 12 months, by veteran status and urbanicity: United States, 2019–2020
1Significant linear trend by urbanicity among veterans (p < 0.05).
2Significantly different from nonveterans (p < 0.05).
NOTES: Estimates are based on responses to the question, “During the past 12 months, did you receive physical therapy, speech therapy, rehabilitative therapy, or occupational therapy?” Access data table for Figure 5
SOURCE: National Center for Health Statistics, National Health Interview Survey, 2019–2020.
Summary
During 2019–2020, 13.6% of veterans and 9.0% of nonveterans had received physical, speech, rehabilitative, or occupational therapy in the past 12 months. Veterans were more likely than nonveterans to have received therapy across all sociodemographic and disability subgroups except for adults living in large central metropolitan counties. Among both veterans and nonveterans, the percentage of adults who received therapy increased with increasing education level, and was also higher among adults with disability than among adults without disability. Among nonveterans, women were more likely than men to have received therapy, the percentage of adults who received therapy increased with increasing age, and no trends were observed by urbanization level. Among veterans, the difference between men and women was not significant, a linear relationship between participation in therapy and age was not observed, and participation in therapy increased as urbanization level decreased.
Definitions
Disability: For adults, defined by the reported level of difficulty (no difficulty, some difficulty, a lot of difficulty, or cannot do at all) in six functioning domains: seeing (even if wearing glasses), hearing (even if wearing hearing aids), mobility (walking or climbing stairs), communication (understanding or being understood by others), cognition (remembering or concentrating), and self-care (such as washing all over or dressing). Adults who responded “a lot of difficulty” or “cannot do at all” to at least one question were considered to have disability.
Physical, speech, rehabilitative, or occupational therapy: Estimates are based on responses to the question, “During the past 12 months, did you receive physical therapy, speech therapy, rehabilitative therapy, or occupational therapy?”
Urbanicity: Categorized by condensing the 2013 National Center for Health Statistics (NCHS) Urban–Rural Classification Scheme for Counties (4) into four categories: large central metropolitan, large fringe metropolitan, medium and small metropolitan, and nonmetropolitan (counties in micropolitan statistical areas and nonmetropolitan counties).
Veterans: Defined as adults who had ever served on active duty in the U.S. Armed Forces, military reserves, or National Guard, and were not currently on full-time active duty with the Armed Forces.
Data source and methods
Data from the 2019 and 2020 National Health Interview Survey (NHIS) were used for this analysis. NHIS is a nationally representative household survey of the U.S. civilian noninstitutionalized population. It is conducted continuously throughout the year by NCHS. Interviews are typically conducted in respondents’ homes, with follow-up by telephone, if needed. Because of the COVID-19 pandemic, data collection procedures in 2020 were disrupted. Consequently, from April through June, all interviews were conducted by telephone only, and from July through December, interviews were attempted by telephone first, with follow-ups to complete interviews by personal visit. For more information about NHIS, visit: https://www.cdc.gov/nchs/nhis/2020nhisdata.htm.
Because there are few veterans under age 25 in the general population and among NHIS respondents, analysis was limited to adults aged 25–64. Additionally, veterans are typically older than nonveterans (5). Limiting this report to adults aged 25–64 provides a comparison between veterans and nonveterans that may be less impacted by age differences.
Point estimates and corresponding confidence intervals were calculated using SAS-callable SUDAAN software (6) to account for the complex sample design of NHIS. Differences between percentages were evaluated using two-sided significance tests at the 0.05 level. Tests for linear trends were evaluated using logistic regression. All estimates in this report met NCHS data presentation standards for proportions (7).
About the authors
Peter Boersma and Robin A. Cohen are with the NCHS Division of Health Interview Statistics.
References
- U.S. Department of Veterans Affairs. Rehabilitation and prosthetic services.
- Weeks JD, Dahlhamer JM, Madans JH, Maitland A. Measuring disability: An examination of differences between the Washington Group Short Set on Functioning and the American Community Survey disability questions. National Health Statistics Reports; no 161. Hyattsville, MD: National Center for Health Statistics. 2021. DOI: https://dx.doi.org/10.15620/cdc:107202.
- Dahlhamer J, Lucas J, Zelaya C, Nahin R, Mackey S, DeBar L, et al. Prevalence of chronic pain and high-impact chronic pain among adults—United States, 2016. Morb Mortal Wkly Rep 67(36):1001–6. 2018. DOI: https://dx.doi.org/10.15585/mmwr.mm6736a2.
- Ingram DD, Franco SJ. 2013 NCHS urban–rural classification scheme for counties. National Center for Health Statistics. Vital Health Stat 2(166). 2014. .
- Boersma P, Cohen RA, Zelaya CE, Moy E. Multiple chronic conditions among veterans and nonveterans: United States, 2015–2018. National Health Statistics Reports; no 153. Hyattsville, MD: National Center for Health Statistics. 2021. DOI: https://doi.org/10.15620/cdc:101659.
- RTI International. SUDAAN (Release 11.0.3) [computer software]. 2018.
- Parker JD, Talih M, Malec DJ, Beresovsky V, Carroll M, Gonzalez JF Jr, et al. National Center for Health Statistics data presentation standards for proportions. National Center for Health Statistics. Vital Health Stat 2(175). 2017.
Suggested citation
Boersma P, Cohen RA. Physical, speech, rehabilitative, or occupational therapy use among adults aged 25–64, by veteran status: United States, 2019–2020. NCHS Data Brief, no 439. Hyattsville, MD: National Center for Health Statistics. 2022. DOI: https://dx.doi.org/10.15620/cdc:118600.
Copyright information
All material appearing in this report is in the public domain and may be reproduced or copied without permission; citation as to source, however, is appreciated.
National Center for Health Statistics
Brian C. Moyer, Ph.D., Director
Amy M. Branum, Ph.D., Associate Director for Science
Division of Health Interview Statistics
Stephen J. Blumberg, Ph.D., Director
Anjel Vahratian, Ph.D., M.P.H., Associate Director for Science