Characteristics of Visits to Health Centers: United States, 2020
NCHS Data Brief No. 438, June 2022
PDF Version (408 KB)
- Key findings
- What was the rate of visits to health centers in 2020, and did it vary by patient age and sex?
- What was the primary expected source of payment at health center visits?
- What were the major reasons for health center visits?
- What services were ordered or provided at health center visits?
- Summary
Data from the National Ambulatory Medical Care Survey—Community Health Centers
- In 2020, an estimated 12.4 health center visits per 100 people occurred.
- Most health center visits were made by patients with Medicaid as the primary expected source of payment.
- Most visits to health centers were for preventive care (33.4%), new problems (32.8%), or chronic problems (32.1%).
- Screenings, examinations, and health education or counseling were provided at 60.0% of health center visits, and laboratory tests were provided at 40.5% of visits.
Health centers provide comprehensive medical care in medically underserved communities (1). The number of health centers has expanded in the last decade from 1,124 sites in 2010 to 1,375 sites in 2020 (2,3). In 2020, nearly 29 million people received medical care from health centers regardless of their insurance status or ability to pay for care (3). This report examines health center visit rates by various characteristics, like age, sex, insurance status, reason for visit, and services, using data from the 2020 National Ambulatory Medical Care Survey—Community Health Centers (NAMCS—CHC).
Keywords: ambulatory health care, federally qualified health centers, FQHC, National Ambulatory Medical Care Survey—Community Health Centers
What was the rate of visits to health centers in 2020, and did it vary by patient age and sex?
- An estimated 12.4 health center visits per 100 people occurred in 2020 (Figure 1).
- Health center visit rates did not vary significantly by age group, with 10.3 visits per 100 people under age 26, 14.1 per 100 people aged 26–44, and 13.0 per 100 people aged 45 and over.
- The visit rate for females (16.3 visits per 100 females) was higher than the rate for males (8.2 visits per 100 males).
Figure 1. Health center visit rates, by selected demographics: United States, 2020

1Significantly lower than female.
NOTES: Based on a sample of 1,667 community health center visits, representing 40,095,680 visits. Visit rates are based on the July 1, 2020, set of estimates of the U.S. civilian noninstitutionalized population, from the U.S. Census Bureau, Population Division. Total visits includes all visits by patients of all ages. Access data table for Figure 1 .
SOURCE: National Center for Health Statistics, National Ambulatory Medical Care Survey—Community Health Centers, 2020.
What was the primary expected source of payment at health center visits?
- Medicaid was the primary expected source of payment at approximately one-half (49.9%) of all health center visits (Figure 2).
- The percentage of health center visits where private insurance was the primary expected source of payment (23.6%) was higher than the percentage of visits by uninsured patients (6.2%).
- Medicare was the primary expected source of payment at 17.6% of visits.
Figure 2. Percentage of visits to health centers, by primary expected source of payment: United States, 2020
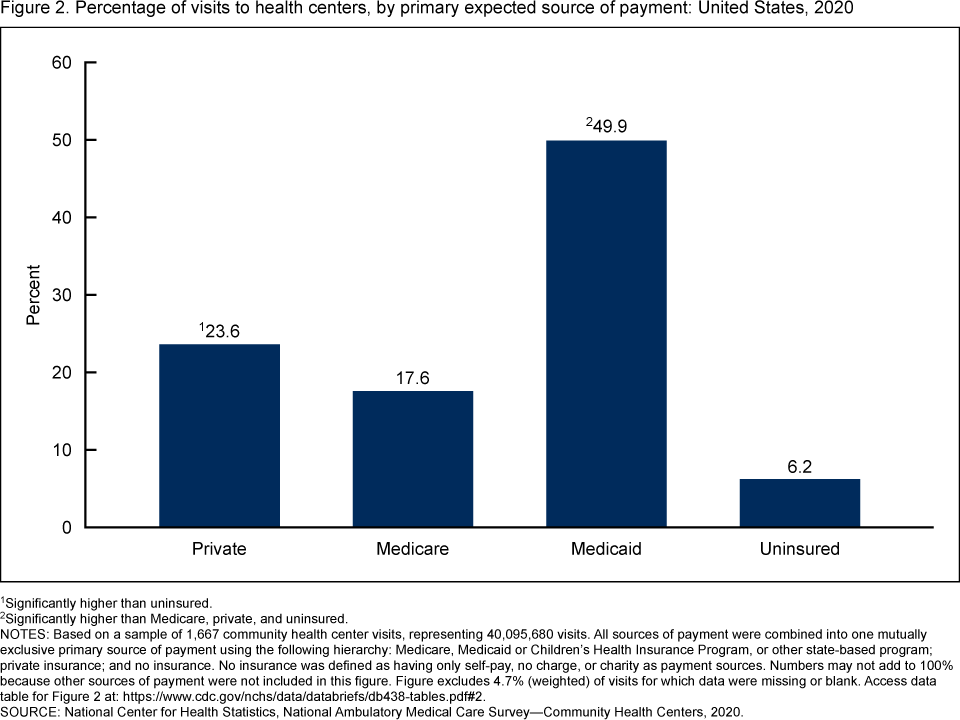
1Significantly higher than uninsured.
2Significantly higher than Medicare, private, and uninsured.
NOTES: Based on a sample of 1,667 community health center visits, representing 40,095,680 visits. All sources of payment were combined into one mutually exclusive primary source of payment using the following hierarchy: Medicare, Medicaid or Children’s Health Insurance Program, or other state-based program; private insurance; and no insurance. No insurance was defined as having only self-pay, no charge, or charity as payment sources. Numbers may not add to 100% because other sources of payment were not included in this figure. Figure excludes 4.7% (weighted) of visits for which data were missing or blank. Access data table for Figure 2.
SOURCE: National Center for Health Statistics, National Ambulatory Medical Care Survey—Community Health Centers, 2020.
What were the major reasons for health center visits?
- Preventive care (33.4%), new problems (32.8%), and chronic problems (32.1%) were the main reasons for health center visits (Figure 3).
- Pre- or postsurgery care was the major reason for visit at 1.6% of health center visits.
Figure 3. Percentage of visits to health centers, by major reason for visit: United States, 2020
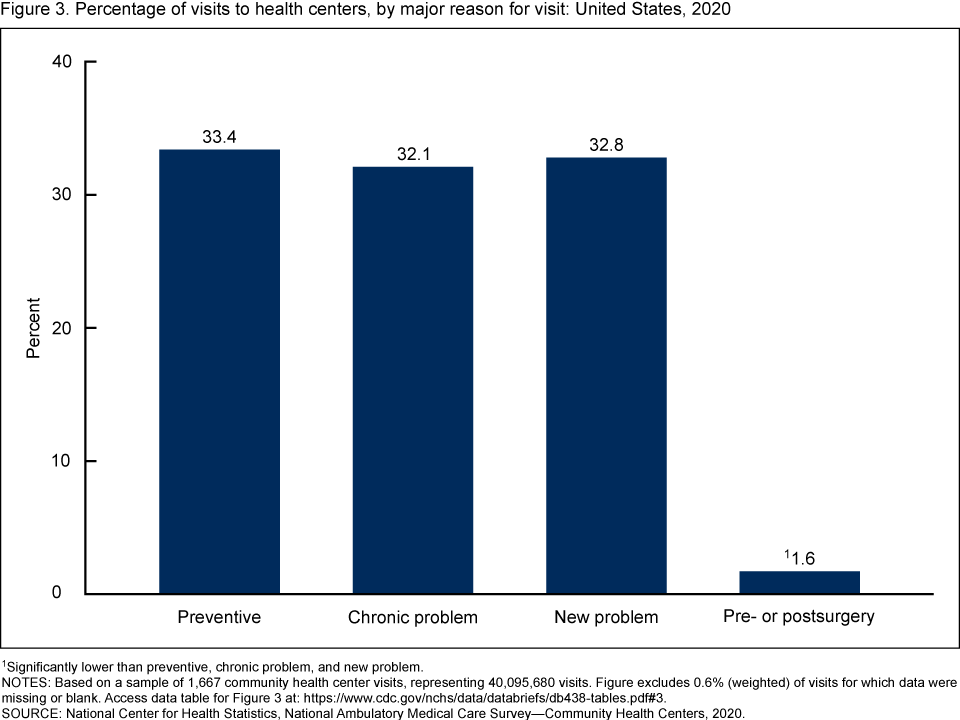
1Significantly lower than preventive, chronic problem, and new problem.
NOTES: Based on a sample of 1,667 community health center visits, representing 40,095,680 visits. Figure excludes 0.6% (weighted) of visits for which data were missing or blank. Access data table for Figure 3.
SOURCE: National Center for Health Statistics, National Ambulatory Medical Care Survey—Community Health Centers, 2020.
What services were ordered or provided at health center visits?
- Examinations, screenings, and health education or counseling (60.0%) were the type of services most likely to be ordered or provided at health center visits, followed by laboratory tests (40.5%), imaging services (11.0%), and procedures (8.1%) (Figure 4).
Figure 4. Percentage of visits to health centers, by selected services ordered or provided: United States, 2020
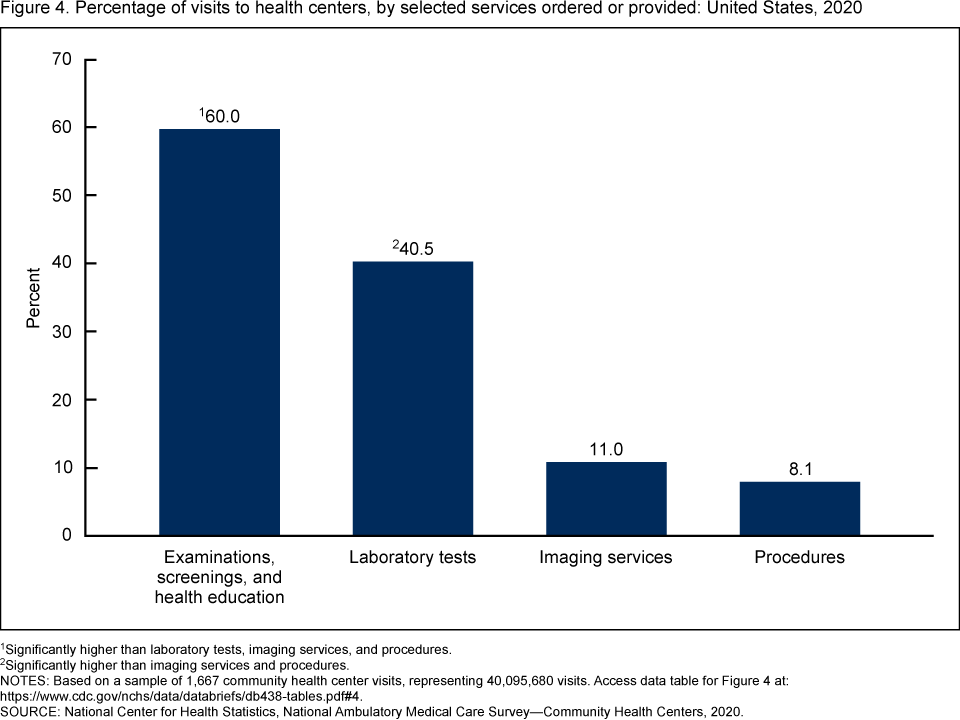
1Significantly higher than laboratory tests, imaging services, and procedures.
2Significantly higher than imaging services and procedures.
NOTES: Based on a sample of 1,667 community health center visits, representing 40,095,680 visits. Access data table for Figure 4.
SOURCE: National Center for Health Statistics, National Ambulatory Medical Care Survey—Community Health Centers, 2020.
Summary
During 2020, the overall rate of health center visits was 12.4 visits per 100 people. The visit rate for females was higher than the rate for males. One-half of health center visits listed Medicaid as the primary expected source of payment, and 6.2% of health center visits were made by people with no insurance. Preventive care was the major reason for 33.4% of all health center visits; visits for new problems (32.8%) and visits for chronic problems (32.1%) were also prominent. Sixty percent of all health center visits included an ordered or provided examination, screening, or health education or counseling. Health centers continue to serve medically underserved populations (4); monitoring the use and provision of care in this setting sheds light on a vital component of ambulatory medical care in the United States.
Definitions
Major reason for visit: Refers to the provider-assessed major reason for this visit. The four categories for major reason for visit included:
- Chronic condition: A visit primarily to receive care or examination for a preexisting chronic condition or illness (onset of condition was 3 months or more before this visit). Includes both routine visits and visits for flare-ups (sudden exacerbation of a preexisting chronic condition).
- New problem: A visit for a condition or illness having a relatively sudden or recent onset (within 3 months of this visit).
- Pre- or postsurgery: A visit scheduled primarily for care required before or following surgery (for example, presurgery tests or removing sutures).
- Preventive care: General medical examinations and routine periodic examinations. Includes prenatal care, annual physicals, well-child examinations, screening, and insurance examinations.
Primary expected source of payment: During data collection, all sources of payment were collected. For patients with more than one source of payment, the hierarchy below was used to collapse payments into one mutually exclusive variable (primary expected source of payment).
- Medicare: Partial or full payment by Medicare plan includes payments made directly to the hospital and payments reimbursed to the patient. Charges covered under a Medicare-sponsored prepaid plan are included.
- Medicaid or Children’s Health Insurance Program (CHIP) or other state-based program: Partial or full payment by Medicaid or CHIP or other state-based program includes payments made directly to the hospital or reimbursed to the patient. Charges covered under a Medicaid-sponsored prepaid plan (health maintenance organization or HMO) or “managed Medicaid” are included.
- Private: Partial or full payment by a private insurer (for example, BlueCross BlueShield), either directly to the hospital or reimbursed to the patient. Charges covered under a private insurance-sponsored prepaid plan are included.
- Uninsured: Includes self-pay and no charge or charity. Self-pay are charges paid by the patient or patient’s family that will not be reimbursed by a third party. Self-pay includes visits for which the patient is expected to be responsible for most of the bill, even if the patient never actually pays it. This does not include copayments or deductibles. No charge or charity are visits for which no fee is charged (such as charity, special research, or teaching).
Selected services: Services that were ordered or provided during the sampled visit for the purpose of screening (early detection of health problems in asymptomatic people), diagnosis (identification of health problems causing people to be symptomatic), and health education or counseling are included. Each selected service item was grouped into one of four categories:
- Examinations, screenings, and health education or counseling: Includes alcohol misuse screening, depression screening, domestic violence screening, substance abuse screening, breast examination, foot examination, neurologic examination, pelvic examination, rectal examination, retinal or eye examination, skin examination, alcohol abuse counseling, asthma education, asthma action plan given to patient, diabetes education, diet or nutrition education, exercise education, family planning or contraception counseling, genetic counseling, growth or development counseling, injury prevention education, sexually transmitted disease prevention education, stress management counseling, substance abuse counseling, tobacco use or exposure education, weight reduction education, and encounter for COVID-19 based on the presence of selected diagnosis codes.
- Imaging services: Includes bone mineral density, computed tomography (CT) scan, echocardiogram, ultrasound, mammography, magnetic resonance imaging (MRI), and X-ray.
- Laboratory tests: Includes basic metabolic panel, complete blood count, comprehensive metabolic panel, creatinine or renal function panel, culture (blood, throat, urine, or other), glucose test, chlamydia test, gonorrhea test, HbA1c, hepatitis test, HIV test, human papillomavirus DNA test, lipid profile, liver enzymes or hepatic function panel, pap test, pregnancy or HCG test, prostate-specific antigen, rapid strep test, thyroid-stimulating hormone or thyroid panel, urinalysis, and vitamin D test.
- Procedures: Includes audiometry, biopsy, cardiac stress test, colonoscopy, cryosurgery or destruction of tissue, EKG or ECG, electroencephalogram, electromyogram, excision of tissue, fetal monitoring, peak flow, sigmoidoscopy, spirometry, tonometry, tuberculosis skin test, and upper gastrointestinal endoscopy.
Visit rates: Calculated by dividing the number of health center visits by estimates of the U.S. civilian noninstitutionalized population (from the U.S. Census Bureau’s Population Division) for age and sex.
Data source and methods
Data for this report are from NAMCS—CHC (available from https://www.cdc.gov/nchs/ahcd/rdc_data.htm), which is conducted by the National Center for Health Statistics. NAMCS—CHC is an annual, nationally representative survey of ambulatory care visits made to both physicians and advanced practice providers (physician assistants, nurse practitioners, and nurse midwives) at health centers in the United States. Starting in 2012, NAMCS—CHC was redesigned as a stand-alone national survey that produced national estimates of visits to health centers.
The sampling frame for the 2020 NAMCS—CHC was compiled from a list of Federally Qualified Health Center (FQHC) service delivery sites from the Health Resources & Services Administration’s (HRSA) Bureau of Primary Health Care and a list of sites from the Indian Health Service. Three types of health centers were eligible for NAMCS—CHC: FQHCs that received Public Health Service Act, Section 330 funding; FQHC “look-alikes,” community-based health care providers that met the requirements of the HRSA Health Center Program but did not receive Health Center Program funding; and urban Indian Health Service outpatient clinics. Health center service delivery sites were excluded from the sampling frame if either the clinic names indicated that the clinic provided only dental services or the clinic exclusively served institutionalized populations (for example, nursing homes).
Data analyses were performed using the statistical packages SAS version 9.4 (SAS Institute, Cary, N.C.) and SAS-callable SUDAAN version 11.0 (RTI International, Research Triangle Park, N.C.). Differences in the distribution of selected characteristics of health center visits were based on chi-square tests (p < 0.05). If a difference was found to be statistically significant, additional pairwise tests were performed. Statements of difference in paired estimates were based on two-tailed t tests with statistical significance at the p < 0.05 level. Terms like “higher” or “lower” indicate that the differences were statistically significant.
About the authors
Loredana Santo, Susan M. Schappert, and Jill J. Ashman are with the National Center for Health Statistics, Division of Health Care Statistics.
References
- Taylor J. The fundamentals of community health centers. National Health Policy Forum background paper. 2004.
- National Association of Community Health Centers. Community health center chartbook. 2020.
- U.S. Department of Health and Human Services, Health Resources & Services Administration. 2020 health center data.
- Saloner B, Wilk AS, Levin J. Community health centers and access to care among underserved populations: A synthesis review. Med Care Res Rev 77(1):3–18. 2020.
Suggested citation
Santo L, Schappert SM, Ashman JJ. Characteristics of visits to health centers: United States, 2020. NCHS Data Brief, no 438. Hyattsville, MD: National Center for Health Statistics. 2022. DOI: https://dx.doi.org/10.15620/cdc:117898.
Copyright information
All material appearing in this report is in the public domain and may be reproduced or copied without permission; citation as to source, however, is appreciated.
National Center for Health Statistics
Brian C. Moyer, Ph.D., Director
Amy M. Branum, Ph.D., Associate Director for Science
Division of Health Care Statistics
Carol J. DeFrances, Ph.D., Acting Director
Alexander Strashny, Ph.D., Associate Director for Science