Regular Bedtimes Among Children Aged 5–17 Years: United States, 2020
NCHS Data Brief No. 437, June 2022
PDF Version (403 KB)
Amanda E. Ng, M.P.H., Dzifa Adjaye-Gbewonyo, Ph.D., and Lindsey I. Black, M.P.H.
- Key findings
- Overall, what percentage of children had a regular bedtime in a typical school week?
- Did the percentage of children aged 5–17 years who had a regular bedtime every day or most days in a typical school week vary by sociodemographic characteristics?
- Were there differences in the percentage of children aged 5–17 years who had a regular bedtime every day or most days in a typical school week by family type, SVI, family income, or urbanicity?
- Were there differences in the percentage of children aged 5–17 years who were tired during the day either most days or every day in a typical school week by regular bedtime status?
- Summary
Data from the National Health Interview Survey
- In 2020, 84.4% of children aged 5–17 years had a regular bedtime every day or most days during a typical school week.
- Children aged 12–17 years (78.9%) were less likely than children aged 5–11 years (89.6%) to have a regular bedtime every day or most days in a typical school week.
- Just over three-quarters of children living in families with a single parent and those with incomes less than 100% of the federal poverty level had a regular bedtime every day or most days in a typical school week.
- Children with a regular bedtime every day or most days were about one-half as likely (5.9%) to be tired during the day every day or most days compared with children with a regular bedtime on some days or never (13.0%).
The American Academy of Sleep Medicine recommends 9–12 hours of sleep for children aged 6–12 years and 8–10 hours for those aged 13–18 (1), yet only two-thirds of children meet these recommendations (2). This report uses 2020 National Health Interview Survey (NHIS) data to describe regular bedtimes, defined as going to sleep at the same time most days or every day in a typical school week, among children aged 5–17 years. Estimates are presented by sociodemographic characteristics, family type, Social Vulnerability Index (SVI), family income, and urbanicity of residence.
Keywords: sleep routine, health behavior, pediatric, National Health Interview Survey
Overall, what percentage of children had a regular bedtime in a typical school week?
- In 2020, among children aged 5–17 years, 47.1% had a regular bedtime every day, 37.3% most days, 10.5% some days, and 5.0% never had a regular bedtime during a typical school week (Figure 1).
Figure 1. Percent distribution of how often school-aged children (5–17 years) had a regular bedtime in a typical school week: United States, 2020
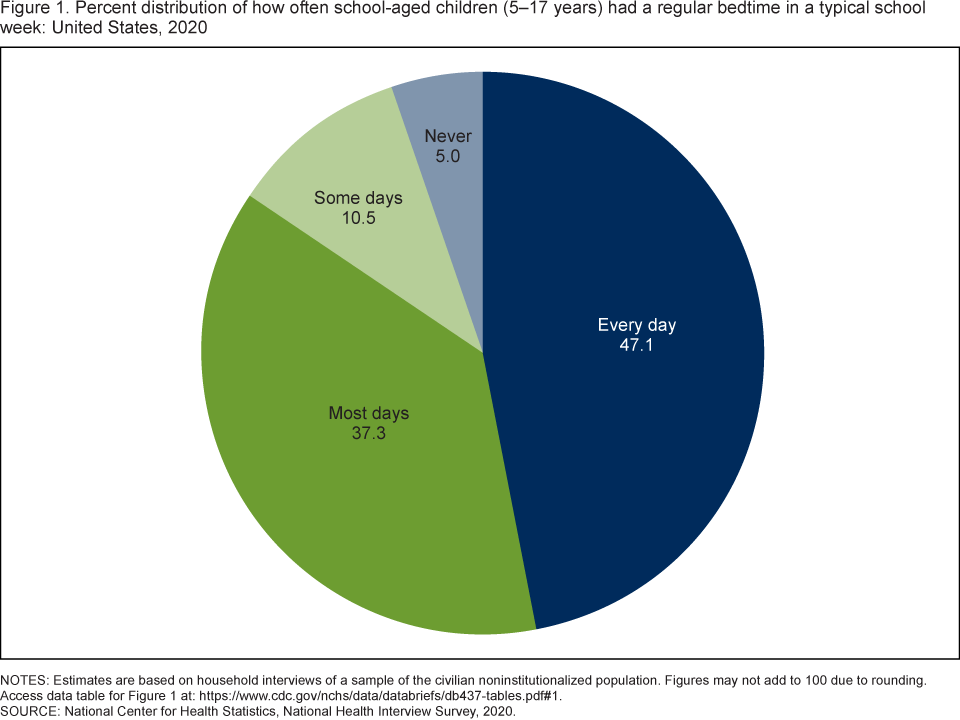
NOTES: Estimates are based on household interviews of a sample of the civilian noninstitutionalized population. Figures may not add to 100 due to rounding. Access data table for Figure 1.
SOURCE: National Center for Health Statistics, National Health Interview Survey, 2020.
Did the percentage of children aged 5–17 years who had a regular bedtime every day or most days in a typical school week vary by sociodemographic characteristics?
- Boys (84.7%) were as likely as girls (84.2%) to have a regular bedtime every day or most days in a typical school week (Figure 2).
- Children aged 12–17 years (78.9%) were less likely to have a regular bedtime every day or most days compared with children aged 5–11 years (89.6%).
- Non-Hispanic Black children (77.3%) and Hispanic children (83.0%) were less likely to have a regular bedtime every day or most days than non-Hispanic White (86.9%) and non-Hispanic Asian (88.5%) children.
Figure 2. Percentage of children aged 5–17 years who had a regular bedtime every day or most days in a typical school week, by sex, age group, and race and Hispanic origin: United States, 2020
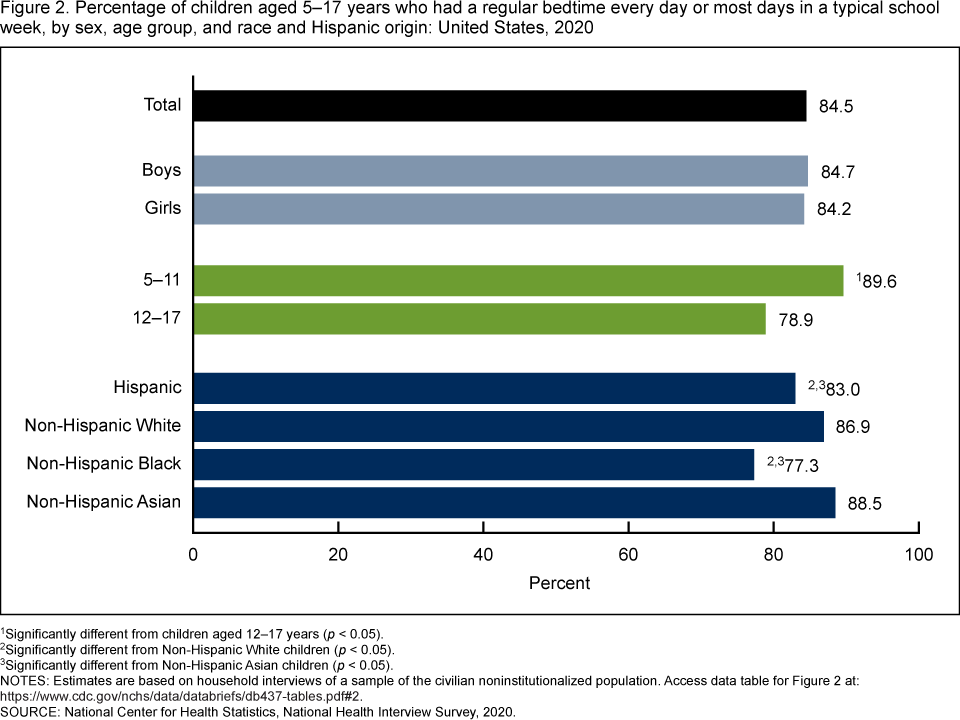
1Significantly different from children aged 12–17 years (p < 0.05).
2Significantly different from Non-Hispanic White children (p < 0.05).
3Significantly different from Non-Hispanic Asian children (p < 0.05).
NOTES: Estimates are based on household interviews of a sample of the civilian noninstitutionalized population. Access data table for Figure 2.
SOURCE: National Center for Health Statistics, National Health Interview Survey, 2020.
Were there differences in the percentage of children aged 5–17 years who had a regular bedtime every day or most days in a typical school week by family type, SVI, family income, or urbanicity?
- Children living in single-parent families were less likely to have a regular bedtime every day or most days (77.7%) compared with children in two-parent families (86.8%) (Figure 3). The observed difference in the percentage of children with a regular bedtime between single-parent families and other types of families (82.3%) was not significant.
- The percentage of children who had a regular bedtime every day or most days was higher among those living in areas of little to no social vulnerability (88.3%) compared with children living in low (84.8%), medium (82.3%), and high (84.0%) areas of social vulnerability.
- The percentage of children who had a regular bedtime every day or most days increased with increasing family income, from 76.1% of children from families with incomes less than 100% of the federal poverty level (FPL) to 82.5% of children from families with incomes between 100%–199% of FPL to 87.2% of children from families with incomes greater than or equal to 200% of FPL.
- The observed difference between the percentage of children who had a regular bedtime every day or most days in rural areas (86.7%) and urban areas (84.0%) was not significant.
Figure 3. Percentage of children aged 5–17 years who had a regular bedtime every day or most days in a typical school week, by family type, social vulnerability, family income, and urbanicity: United States, 2020
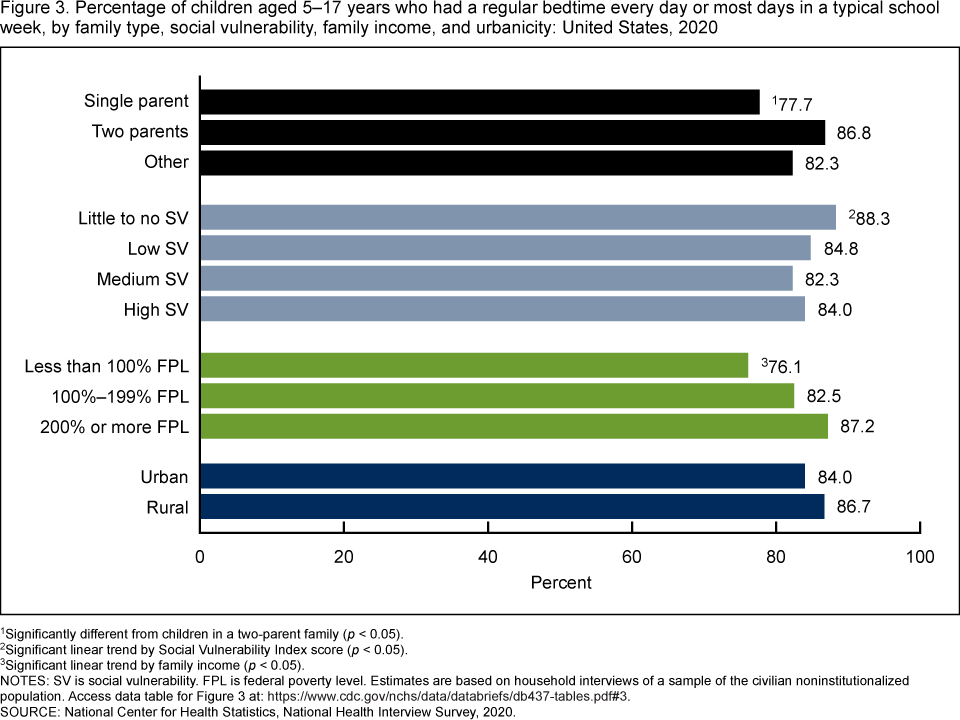
1Significantly different from children in a two-parent family (p < 0.05).
2Significant linear trend by Social Vulnerability Index score (p < 0.05).
3Significant linear trend by family income (p < 0.05)
NOTES: SV is social vulnerability. FPL is federal poverty level. Estimates are based on household interviews of a sample of the civilian noninstitutionalized population. Access data table for Figure 3.
SOURCE: National Center for Health Statistics, National Health Interview Survey, 2020.
Were there differences in the percentage of children aged 5–17 years who were tired during the day either most days or every day in a typical school week by regular bedtime status?
- Children who had a regular bedtime every day or most days were less likely (5.9%) to be tired during the day most days or every day compared with children who had a regular bedtime on some days or never (13.0%) (Figure 4).
Figure 4. Percentage of children aged 5–17 years who were tired during the day most days or every day in a typical school week, by regular bedtime status: United States, 2020
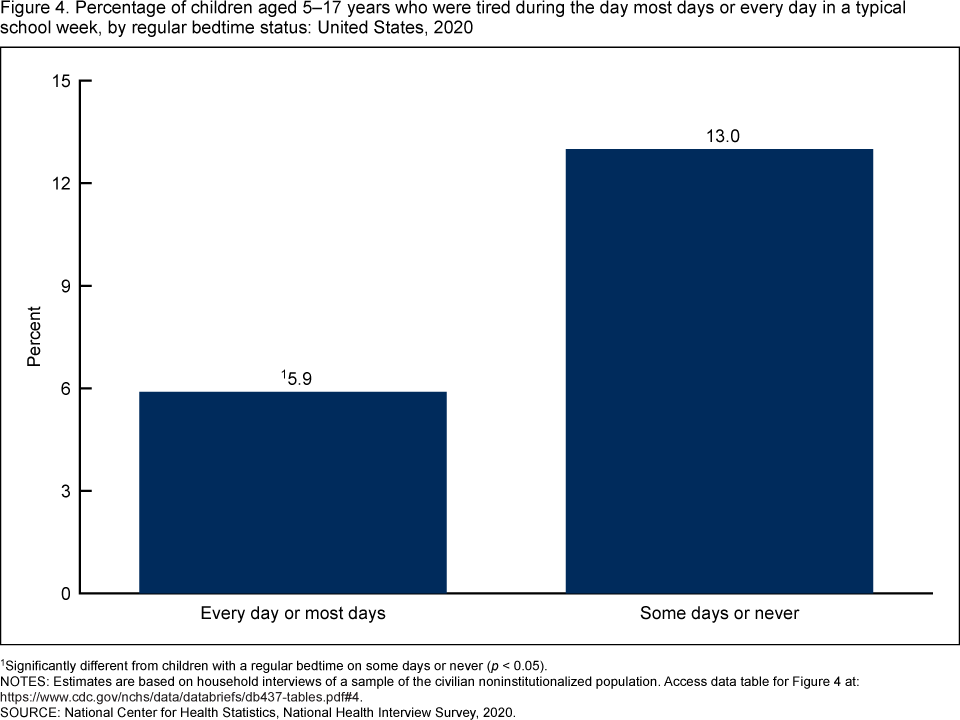
1Significantly different from children with a regular bedtime on some days or never (p < 0.05).
NOTES: Estimates are based on household interviews of a sample of the civilian noninstitutionalized population. Access data table for Figure 4.
SOURCE: National Center for Health Statistics, National Health Interview Survey, 2020.
Summary
This report uses data from the 2020 NHIS to describe regular bedtimes among U.S. children aged 5–17 years. Overall, 84.4% of children aged 5–17 had a regular bedtime every day or most days in a typical school week. However, this percentage varied by selected characteristics. The percentage of children with a regular bedtime was similar among boys and girls but varied by age, with older children less likely to have a regular bedtime compared with younger children. Children who were non-Hispanic Black, Hispanic, living in single-parent families, living in communities with higher social vulnerability, and living in families with lower incomes were also less likely to have a regular bedtime. Children with a regular bedtime every day or most days were less likely to be tired during the day than children who had a regular bedtime on some days or never.
Previous research has documented disparities for short sleep duration and regular bedtime by race and ethnicity and age (2,3). This report expands the understanding of children’s bedtime routines by describing differences by a broad range of indicators and social determinants of health. Implementing a consistent bedtime has been shown to help ensure sufficient sleep duration for children (4).
Definitions
Being tired: Based on responses to the question, “In a typical school week, how often does (sample child) complain about being tired during the day? Would you say never, some days, most days, or every day?”
Centers for Disease Control and Prevention (CDC) Social Vulnerability Index: Developed at CDC by the Agency for Toxic Substance and Disease Registry’s Geospatial Research, Analysis, and Services Program (GRASP), SVI uses U.S. Census Bureau data to determine the social vulnerability of every census tract. SVI ranks each tract on 15 social factors. The factors are then grouped into four related themes: socioeconomic status, household composition and disability, racial and ethnic minority status and language, and housing type and transportation, as well as an overall ranking. SVI indicates the relative vulnerability of every U.S. census tract as a percentile ranking ranging from 0 to 1, with higher values indicating greater vulnerability. The overall tract summary ranking variable for 2018 was used to categorize four quartiles of vulnerability: Scores from 0 to 0.2500 are categorized as little to no social vulnerability; from 0.2501 to 0.5000, low social vulnerability; from 0.5001 to 0.7500, medium social vulnerability; and from 0.7501 to 1.0, high social vulnerability. For more information on SVI, please visit the CDC/ATSDR’s GRASP website.
Family income as a percentage of FPL: Based on the federal poverty level, which was calculated from the family’s income in the previous calendar year and family size using the U.S. Census Bureau’s poverty thresholds (5). Family income was imputed when missing (6).
Family type: Children were categorized as living in single-parent families if they had a 1) single parent, never married or 2) single parent, ever married. Children were categorized as living in two-parent families if they had married parents living in the same household as the child, or cohabitating parents living in the same household as the child. Children categorized as other family type include those who had at least one related or unrelated adult (not a parent) in the same household as the child.
Race and Hispanic origin: Children categorized as Hispanic may be of any race or combination of races. Children categorized as non-Hispanic White, non-Hispanic Black, or non-Hispanic Asian indicated one race only. Estimates for non-Hispanic children of other races or multiple races are not shown.
Regular bedtime: Based on responses to the question, “In a typical school week, how often does (sample child) go to bed at the same time? Would you say never, some days, most days, or every day?”
Urbanization level: Counties were classified according to their metropolitan status using the National Center for Health Statistics (NCHS) Urban–Rural Classification Scheme (7). Urban counties include large central counties (inner cities); the fringes of large counties (suburbs); and medium and small counties. Rural counties include micropolitan statistical areas and noncore areas, including open countryside, rural towns (populations of less than 2,500), and areas with populations of 2,500–49,999 that are not part of larger labor market areas (urban areas).
Data source and methods
NHIS is a nationally representative household survey of the civilian noninstitutionalized U.S. population. It is conducted continuously throughout the year by NCHS. Interviews are typically conducted in respondents’ homes, but follow-ups to complete interviews may be conducted over the telephone. Due to the COVID-19 pandemic, data collection procedures in 2020 were disrupted. From April through June all interviews were conducted by telephone only, and from July through December interviews were attempted by telephone first with follow-ups to complete interviews by personal visit. For more information about NHIS, visit: https://www.cdc.gov/nchs/nhis.
Point estimates and the corresponding confidence intervals for this analysis were calculated using SAS-callable SUDAAN software (8) to account for the complex sample design of NHIS. All estimates are based on parent or guardian report and meet NCHS data presentation standards for proportions (9). Differences between percentages were evaluated using two-sided significance tests at the 0.05 level. Linear and quadratic trends by age group, family income, and SVI quartile were evaluated using Proc Descript, poly option.
About the authors
Amanda E. Ng, Dzifa Adjaye-Gbewonyo, and Lindsey I. Black are with NCHS’ Division of Health Interview Statistics.
References
- Paruthi S, Brooks LJ, D’Ambrosio C, Hall WA, Kotagal S, Lloyd RM, et al. Recommended amount of sleep for pediatric populations: A consensus statement of the American Academy of Sleep Medicine. J Clin Sleep Med 12(6):785–6. 2016.
- Wheaton AG, Claussen AH. Short sleep duration among infants, children, and adolescents aged 4 months–17 years—United States, 2016–2018. MMWR Morb Mortal Wkly Rep 70(38):1315–21. 2021.
- Smith JP, Hardy ST, Hale LE, Gazmararian JA. Racial disparities and sleep among preschool aged children: A systematic review. Sleep Health 5(1):49–57. 2019.
- Pyper E, Harrington D, Manson H. Do parents’ support behaviours predict whether or not their children get sufficient sleep? A cross-sectional study. BMC Public Health 17(1):432. 2017.
- United States Census Bureau. Poverty thresholds. 2021.
- National Center for Health Statistics. Multiple imputation of family income in 2020 National Health Interview Survey: Methods. 2021.
- Ingram DD, Franco SJ. 2013 NCHS urban–rural classification scheme for counties. National Center for Health Statistics. Vital Health Stat 2(166). 2014.
- RTI International. SUDAAN (Release 11.0.3) [computer software]. 2018.
- Parker JD, Talih M, Malec DJ, Beresovsky V, Carroll M, Gonzalez Jr JF, et al. National Center for Health Statistics data presentation standards for proportions. National Center for Health Statistics. Vital Health Stat 2(175). 2017.
Suggested citation
Ng AE, Adjaye-Gbewonyo D, Black LI. Regular bedtimes among children aged 5–17 years: United States, 2020. NCHS Data Brief, no 437. Hyattsville, MD: National Center for Health Statistics. 2022. DOI: https://dx.doi.org/10.15620/cdc:117489
Copyright information
All material appearing in this report is in the public domain and may be reproduced or copied without permission; citation as to source, however, is appreciated.
National Center for Health Statistics
Brian C. Moyer, Ph.D., Director
Amy M. Branum, Ph.D., Associate Director for Science
Division of Health Interview Statistics
Stephen J. Blumberg, Ph.D., Director
Anjel Vahratian, Ph.D., M.P.H., Associate Director for Science