Children Living in Households That Experienced Food Insecurity: United States, 2019–2020
NCHS Data Brief No. 432, February 2022
PDF Version (465 KB) | Visual Abstract
Heidi Ullmann, Ph.D., Julie D. Weeks, Ph.D., and Jennifer H. Madans, Ph.D.
- Key findings
- In 2019–2020, the percentage of children aged 0–17 years who lived in households that experienced food insecurity did not vary by the sex or age of the child.
- The percentage of children living in households that experienced food insecurity varied by race and Hispanic origin and disability status.
- The percentage of children living in food-insecure households varied by urbanicity.
- Family characteristics, such as family structure and the number of children in the household, were associated with household food insecurity.
- Summary
Data from the National Health Interview Survey
- In 2019–2020, 10.8% of children aged 0–17 years lived in households that experienced food insecurity during the past 30 days.
- The percentage of children who lived in food-insecure households was higher for non-Hispanic Black (18.8%) than Hispanic (15.7%) children, and higher for both non-Hispanic Black and Hispanic children than for non-Hispanic White children (6.5%).
- A greater percentage of children with disability (19.3%) lived in food-insecure households compared with children without disability (9.8%).
- The percentage of children living in households that experienced food insecurity varied by urbanicity.
- Family characteristics, such as family structure and the number of children in the household, were associated with household food insecurity.
Food insecurity, which affects an estimated 15 million Americans (1), is the limited or uncertain availability of safe and nutritionally adequate foods, or the limited or uncertain ability to acquire acceptable foods in socially acceptable ways (2). Food insecurity has been consistently associated with poor health outcomes in children, including poorer overall health status, acute and chronic health problems, and limited healthcare access (3). This report describes the percentage of children aged 0–17 years living in food-insecure households during the past 30 days by selected sociodemographic and family characteristics using 2019–2020 National Health Interview Survey data.
Keywords: household food security, food insecure conditions, nutrition, disparities, National Health Interview Survey (NHIS)
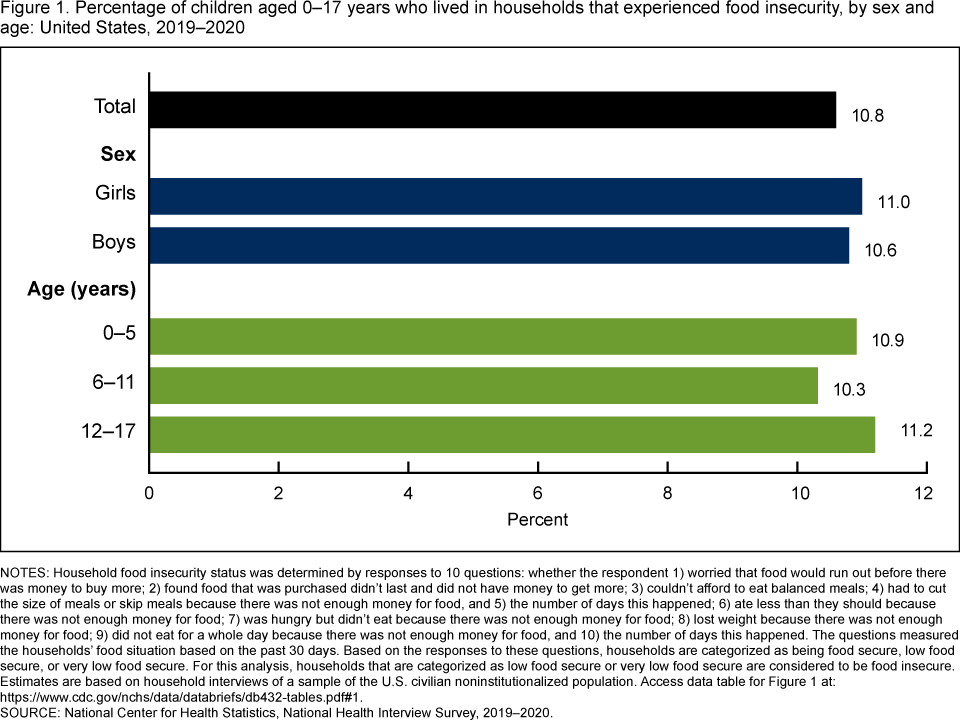
In 2019–2020, the percentage of children aged 0–17 years who lived in households that experienced food insecurity did not vary by the sex or age of the child.
- In 2019–2020, 10.8% of children aged 0–17 years lived in households that experienced food insecurity (Figure 1).
- The percentage of children living in food-insecure households was similar for girls (11.0%) and boys (10.6%).
- The percentages of children living in households that experienced food insecurity were similar across age groups: 10.9% of those aged 5 and under, 10.3% of those aged 6–11, and 11.2% of those aged 12–17.
Figure 1. Percentage of children aged 0–17 years who lived in households that experienced food insecurity, by sex and age: United States, 2019–2020
NOTES: Household food insecurity status was determined by responses to 10 questions: whether the respondent 1) worried that food would run out before there was money to buy more; 2) found food that was purchased didn’t last and did not have money to get more; 3) couldn’t afford to eat balanced meals; 4) had to cut the size of meals or skip meals because there was not enough money for food, and 5) the number of days this happened; 6) ate less than they should because there was not enough money for food; 7) was hungry but didn’t eat because there was not enough money for food; 8) lost weight because there was not enough money for food; 9) did not eat for a whole day because there was not enough money for food, and 10) the number of days this happened. The questions measured the households’ food situation based on the past 30 days. Based on the responses to these questions, households are categorized as being food secure, low food secure, or very low food secure. For this analysis, households that are categorized as low food secure or very low food secure are considered to be food insecure. Estimates are based on household interviews of a sample of the U.S. civilian noninstitutionalized population. Access data table for Figure 1 .
SOURCE: National Center for Health Statistics, National Health Interview Survey, 2019–2020.
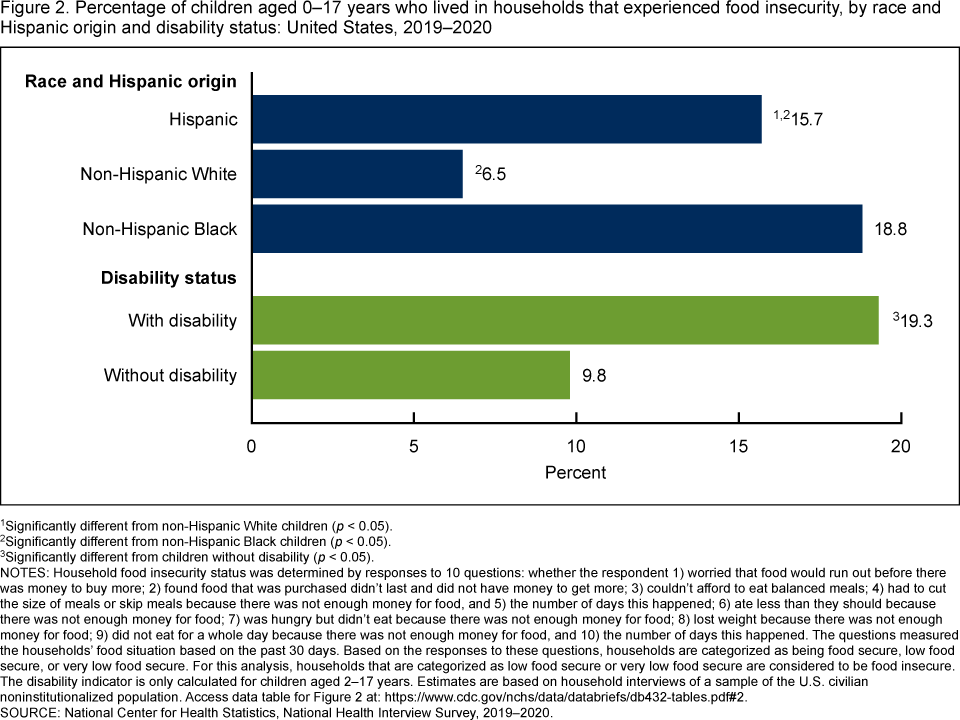
The percentage of children living in households that experienced food insecurity varied by race and Hispanic origin and disability status.
- Non-Hispanic Black (18.8%) and Hispanic (15.7%) children were more likely to live in food-insecure households compared with non-Hispanic White children (6.5%) (Figure 2).
- Non-Hispanic Black children were more likely than Hispanic children to live in households that experienced food insecurity.
- The percentage of children aged 17 and under who lived in food-insecure households was higher for children with disability (19.3%) compared with children without disability (9.8%).
Figure 2. Percentage of children aged 0–17 years who lived in households that experienced food insecurity, by race and Hispanic origin and disability status: United States, 2019–2020
1Significantly different from non-Hispanic White children (p < 0.05).
2Significantly different from non-Hispanic Black children (p < 0.05).
3Significantly different from children without disability (p < 0.05).
NOTES: Household food insecurity status was determined by responses to 10 questions: whether the respondent 1) worried that food would run out before there was money to buy more; 2) found food that was purchased didn’t last and did not have money to get more; 3) couldn’t afford to eat balanced meals; 4) had to cut the size of meals or skip meals because there was not enough money for food, and 5) the number of days this happened; 6) ate less than they should because there was not enough money for food; 7) was hungry but didn’t eat because there was not enough money for food; 8) lost weight because there was not enough money for food; 9) did not eat for a whole day because there was not enough money for food, and 10) the number of days this happened. The questions measured the households’ food situation based on the past 30 days. Based on the responses to these questions, households are categorized as being food secure, low food secure, or very low food secure. For this analysis, households that are categorized as low food secure or very low food secure are considered to be food insecure. The disability indicator is only calculated for children aged 2–17 years. Estimates are based on household interviews of a sample of the U.S. civilian noninstitutionalized population. Access data table for Figure 2.
SOURCE: National Center for Health Statistics, National Health Interview Survey, 2019–2020.
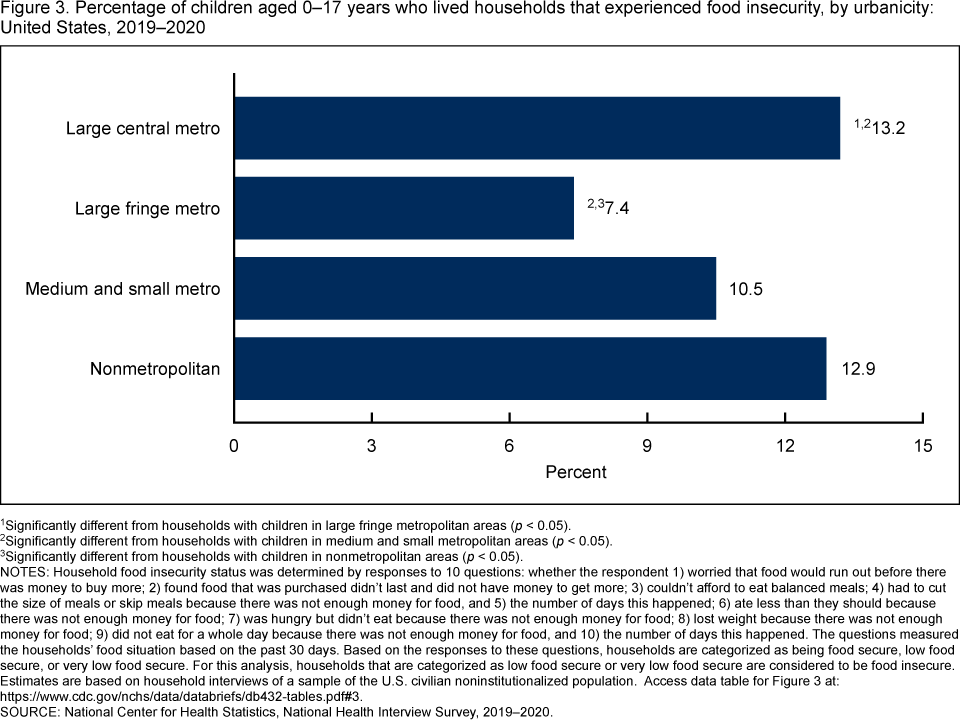
The percentage of children living in food-insecure households varied by urbanicity.
- Children in large central metropolitan areas (13.2%) were more likely than those in large fringe metropolitan (7.4%) and medium and small metropolitan (10.5%) areas to live in households that were food-insecure (Figure 3).
- Children living in large fringe metropolitan areas (7.4%) were less likely to live in food-insecure households compared with those in medium and small metropolitan (10.5%) and nonmetropolitan (12.9%) areas.
- The observed difference in living in a food-insecure household between children in medium and small metropolitan areas and those in nonmetropolitan areas was not significant.
Figure 3. Percentage of children aged 0–17 years who lived households that experienced food insecurity, by urbanicity: United States, 2019–2020
1Significantly different from households with children in large fringe metropolitan areas (p < 0.05).
2Significantly different from households with children in medium and small metropolitan areas (p < 0.05).
3Significantly different from households with children in nonmetropolitan areas (p < 0.05).
NOTES: Household food insecurity status was determined by responses to 10 questions: whether the respondent 1) worried that food would run out before there was money to buy more; 2) found food that was purchased didn’t last and did not have money to get more; 3) couldn’t afford to eat balanced meals; 4) had to cut the size of meals or skip meals because there was not enough money for food, and 5) the number of days this happened; 6) ate less than they should because there was not enough money for food; 7) was hungry but didn’t eat because there was not enough money for food; 8) lost weight because there was not enough money for food; 9) did not eat for a whole day because there was not enough money for food, and 10) the number of days this happened. The questions measured the households’ food situation based on the past 30 days. Based on the responses to these questions, households are categorized as being food secure, low food secure, or very low food secure. For this analysis, households that are categorized as low food secure or very low food secure are considered to be food insecure. Estimates are based on household interviews of a sample of the U.S. civilian noninstitutionalized population. Access data table for Figure 3.
SOURCE: National Center for Health Statistics, National Health Interview Survey, 2019–2020.
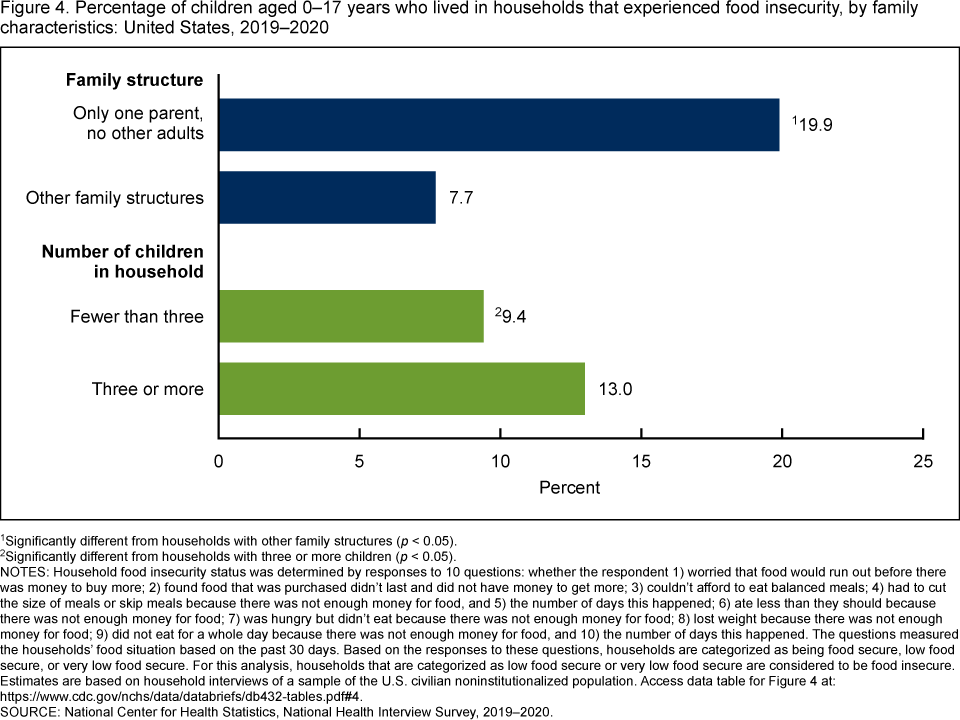
Family characteristics, such as family structure and the number of children in the household, were associated with household food insecurity.
- Among children aged 17 and under, those living with only one parent and no other adults (19.9%) were more likely to experience food insecurity compared with children living in other household structures (7.7%) (Figure 4).
- The percentage of children living in food-insecure households increased with the number of children in the household, from 9.4% of children in households with fewer than three children to 13.0% of children in households with three or more children.
Figure 4. Percentage of children aged 0–17 years who lived in households that experienced food insecurity, by family characteristics: United States, 2019–2020
1Significantly different from households with other family structures (p < 0.05).
2Significantly different from households with three or more children (p < 0.05).
NOTES: Household food insecurity status was determined by responses to 10 questions: whether the respondent 1) worried that food would run out before there was money to buy more; 2) found food that was purchased didn’t last and did not have money to get more; 3) couldn’t afford to eat balanced meals; 4) had to cut the size of meals or skip meals because there was not enough money for food, and 5) the number of days this happened; 6) ate less than they should because there was not enough money for food; 7) was hungry but didn’t eat because there was not enough money for food; 8) lost weight because there was not enough money for food; 9) did not eat for a whole day because there was not enough money for food, and 10) the number of days this happened. The questions measured the households’ food situation based on the past 30 days. Based on the responses to these questions, households are categorized as being food secure, low food secure, or very low food secure. For this analysis, households that are categorized as low food secure or very low food secure are considered to be food insecure. Estimates are based on household interviews of a sample of the U.S. civilian noninstitutionalized population. Access data table for Figure 4.
SOURCE: National Center for Health Statistics, National Health Interview Survey, 2019–2020.
Summary
In 2019–2020, 10.8% of children aged 0–17 years lived in a household that experienced food insecurity during the past 30 days. Disparities in food insecurity were observed by race and Hispanic origin, disability status, urbanicity, and family characteristics, but not by the sex or age of the child. The percentage of non-Hispanic Black children (18.8%) living in food-insecure households was higher than for non-Hispanic White (6.5%) and Hispanic (15.7%) children. Hispanic children were also more likely to live in households that experienced food insecurity compared with non-Hispanic White children. While 19.3% of children with disability lived in food-insecure households, 9.8% of children without disability lived in such households. Regarding urbanicity, children in large central metropolitan areas (13.2%) were more likely to live in food-insecure households compared with children in medium and small metropolitan areas (10.5%). Also, among the four urbanicity categories considered, the percentage of children living in food-insecure households was lowest for those in large fringe metropolitan areas (7.4%). The percentage of children living with only one parent and no other adults that experienced food insecurity (19.9%) was more than double the percentage of children living in other household structures (7.7%). Finally, children aged 0–17 years who lived in households with three or more children (13.0%) were more likely to have experienced food insecurity compared with children in households with fewer than three children (9.4%).
Access to sufficient and nutritious food is a key social determinant of health (4). As such, disparities in food insecurity may contribute to inequalities in child health status. Information that characterizes disparities in food insecurity may help target interventions to reduce these disparities and promote positive child health outcomes.
Definitions
Disability status: Disability is defined by the reported level of difficulty (no difficulty, some difficulty, a lot of difficulty, or cannot do at all) in 13 core functioning domains: seeing, hearing, mobility, self-care, communication, learning, remembering, concentrating, accepting change, controlling behavior, making friends, anxiety, and depression. Children who are reported to have “a lot of difficulty” or “cannot do at all” to at least one domain of functioning or with “daily” anxiety or depression are considered to have disability.
Family structure: Children were categorized as living with only one parent and no other adults if they resided with a never-married or ever-married single parent and no other adults. Children were categorized as living in other household structures if they resided with married or cohabiting parents, or with at least one related or unrelated adult (in addition to a parent) in the same household.
Food insecurity: Household food insecurity status was determined by responses to 10 questions: whether the respondent 1) worried that food would run out before there was money to buy more; 2) found food that was purchased didn’t last and did not have money to get more; 3) couldn’t afford to eat balanced meals; 4) had to cut the size of meals or skip meals because there was not enough money for food, and 5) the number of days this happened; 6) ate less than they should because there was not enough money for food; 7) was hungry but didn’t eat because there was not enough money for food; 8) lost weight because there was not enough money for food; 9) did not eat for a whole day because there was not enough money for food, and 10) the number of days this happened. The questions measured the household’s food situation based on the past 30 days. Based on the responses, households are categorized as being food secure, low food secure, or very low food secure. For this analysis, households that are categorized as low food secure or very low food secure are considered to be food insecure (5).
Race and Hispanic origin: Children categorized as Hispanic may be of any race or combination of races. Children categorized as non-Hispanic White or non-Hispanic Black indicated one race only. Estimates for non-Hispanic children of races other than White only or Black only, or of multiple races, are not shown.
Urbanization level: Categories were determined using the “2013 NCHS Urban–Rural Classification Scheme for Counties” (6) and were assigned based on the county of household residence. Metropolitan (or urban) counties include large central counties (inner cities); the fringes of large counties (suburban); and medium and small counties. Nonmetropolitan (or rural) counties include micropolitan statistical areas and noncore areas, including open countryside, rural towns (populations of less than 2,500), and areas with populations of 2,500–49,999 that are not part of larger labor market areas (metropolitan areas).
Data source and methods
Data from the 2019 and 2020 National Health Interview Survey (NHIS) were used for this analysis. NHIS is a nationally representative household survey of the U.S. civilian noninstitutionalized population. It is conducted continuously throughout the year by the National Center for Health Statistics (NCHS). Interviews are typically conducted in respondents’ homes with follow-up by telephone, if needed. Due to the COVID-19 pandemic, data collection procedures in 2020 were disrupted, and from April through June all interviews were conducted by telephone only, and from July through December interviews were attempted by telephone first, with follow-ups to complete interviews by personal visit. Questions about the child’s health and the household are answered by a knowledgeable adult, usually a parent. For more information about NHIS, visit: https://www.cdc.gov/nchs/nhis.htm.
Point estimates and their corresponding confidence intervals were calculated using Stata software (7) to account for the complex sample design of NHIS. Differences between percentages were evaluated using two-sided significance tests at the 0.05 level. All estimates meet NCHS standards of reliability as specified in “National Center for Health Statistics Data Presentation Standards for Proportions” (8).
About the authors
Heidi Ullmann and Julie D. Weeks are with the National Center for Health Statistics (NCHS), Division of Analysis and Epidemiology. Jennifer H. Madans is a Guest Researcher with NCHS, Office of the Director.
References
- Coleman-Jensen A, Rabbitt MP, Gregory CA, Singh A. Statistical supplement to household food security in the United States in 2017. Washington, DC: Economic Research Service. 2018.
- Economic Research Service. Measurement. 2021.
- Thomas MMC, Miller DP, Morrissey TW. Food insecurity and child health. Pediatrics 144(4):e20190397. 2019.
- U.S. Department of Health and Human Services, Office of Disease Prevention and Health Promotion. Healthy People 2030: Social determinants of health.
- Economic Research Service. U.S. household food security survey module: Three-stage design, with screeners. 2012.
- Ingram DD, Franco SJ. 2013 NCHS urban–rural classification scheme for counties. National Center for Health Statistics. Vital Health Stat 2(166). 2014.
- StataCorp. Stata Statistical Software (Release 16) [computer software]. 2019.
- Parker JD, Talih M, Malec DJ, Beresovsky V, Carroll M, Gonzalez JF Jr, et al. National Center for Health Statistics data presentation standards for proportions. National Center for Health Statistics. Vital Health Stat 2(175). 2017.
Suggested citation
Ullmann H, Weeks JD, Madans JH. Children living in households that experienced food insecurity: United States, 2019–2020. NCHS Data Brief, no 432. Hyattsville, MD: National Center for Health Statistics. 2021. DOI: https://dx.doi.org/10.15620/cdc:113966.
Copyright information
All material appearing in this report is in the public domain and may be reproduced or copied without permission; citation as to source, however, is appreciated.
National Center for Health Statistics
Brian C. Moyer, Ph.D., Director
Amy M. Branum, Ph.D., Associate Director for Science
Division of Analysis and Epidemiology
Irma E. Arispe, Ph.D., Director
Kevin C. Heslin, Ph.D., Associate Director for Science