Exploring the Decline in the Singleton Preterm Birth Rate in the United States, 2019–2020
NCHS Data Brief No. 430, January 2022
PDF Version (514 KB)
Joyce A. Martin, M.P.H., and Michelle J.K. Osterman, M.H.S.
- Key findings
- The singleton preterm birth rate declined by less than 1% between 2019 and 2010.
- Preterm birth rates declined for births to non-Hispanic White mothers between 2019 and 2020.
- The largest declines in singleton preterm birth rates in 2020 occurred in March, April, and November.
- Singleton preterm birth rates were essentially unchanged for most states between 2019 and 2020.
- Summary
Data from the National Vital Statistics System
- Following increases from 2014 to 2019, the singleton preterm birth rate declined by less than 1% from 2019 (8.47%) to 2020 (8.42%).
- A decline was also observed for early preterm births between 2019 (2.14%) and 2020 (2.11%).
- The singleton preterm birth rate among births to non-Hispanic White mothers declined 1%; changes in rates for non-Hispanic Black, non-Hispanic American Indian Alaska Native, and Hispanic mothers were not significant.
- By month, the largest declines in rates between 2019 and 2020 occurred in March (4%), April (3%), and November (3%).
- Singleton preterm birth rates declined in four states and increased in two states between 2019 and 2020.
Preterm birth (delivery prior to 37 completed weeks of gestation) is a leading cause of infant mortality in the United States and around the world and has also been associated with long-term adverse outcomes in children (1,2). In the United States, the preterm birth rate rose 7% from 2014 to 2019, and then declined 1% from 2019 to 2020 (3). Changes in multiple births can impact overall preterm birth rates because of the greater likelihood of preterm delivery among infants born in multiple gestation pregnancies (3,4). Accordingly, to better identify factors associated with the 2019–2020 decline in preterm births, this report is limited to singleton births and describes trends in preterm birth rates from 2014 through 2020 and changes in rates between 2019 and 2020 by maternal race and Hispanic origin, age, and state of residence.
Keywords: gestational age, race and Hispanic origin, birth month, state of residence, National Vital Statistics System
The singleton preterm birth rate declined by less than 1% between 2019 and 2020.
- The singleton preterm birth rate increased by an average annual rate of 2% from 2014 through 2019 (from 7.74% to 8.47%). The rate then declined slightly in 2020 by less than 1% (0.6%), to 8.42% (Figure 1).
- The late preterm singleton rate rose at an average annual rate of 2% each year from 2014 to 2019 (from 5.67% to 6.32%). The decline in the late preterm rate between 2019 and 2020 (6.32% to 6.30%) was not significant.
- The early preterm singleton preterm rate increased by an average of less than 1% annually from 2014 to 2019 (2.07% to 2.14%). The rate then declined 1% in 2020, to 2.11%.
Figure 1. Singleton preterm birth rates: United States, 2014–2020
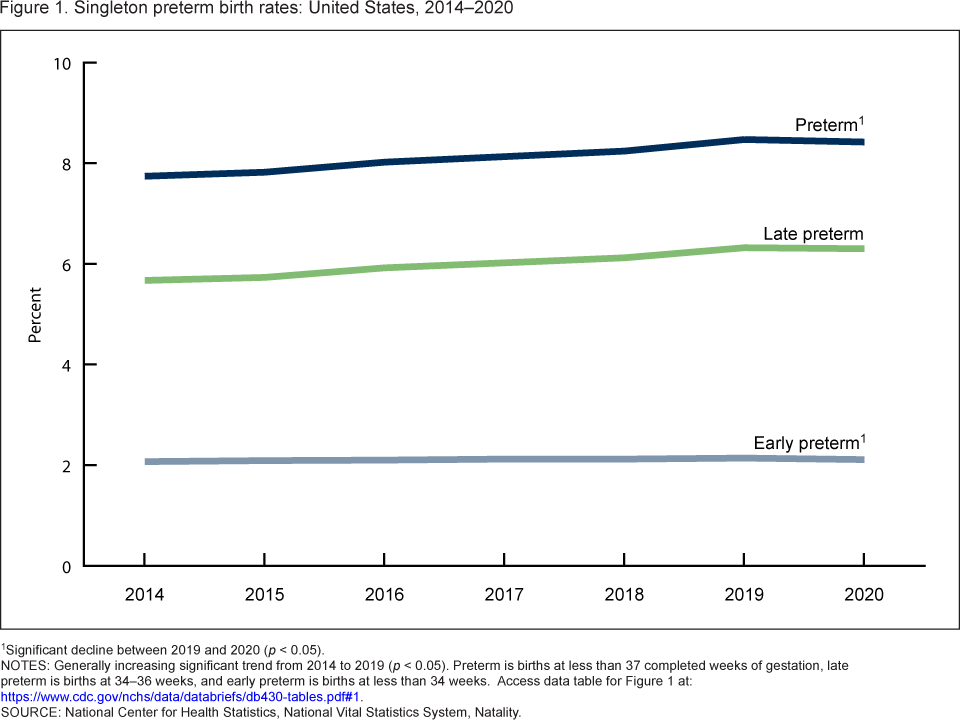
1Significant decline between 2019 and 2020 (p < 0.05).
NOTES: Generally increasing significant trend from 2014 to 2019 (p < 0.05). Preterm is births at less than 37 completed weeks of gestation, late preterm is births at 34–36 weeks, and early preterm is births at less than 34 weeks. Access data table for Figure 1 .
SOURCE: National Center for Health Statistics, National Vital Statistics System, Natality.
Preterm birth rates declined for births to non-Hispanic White mothers between 2019 and 2020.
- The singleton preterm birth rate declined 1% for births to non-Hispanic White mothers from 2019 to 2020 (7.44% to 7.36%) (Figure 2). Declines for births to non-Hispanic Asian (7.32% to 7.29%) and Hispanic (8.60% to 8.54%) mothers were not significant.
- Increases in singleton preterm rates for births to non-Hispanic Black (12.12% to 12.18%) and non-Hispanic American Indian or Alaska Native (10.26% to 10.30%) mothers were not significant.
- In 2020, singleton preterm rates were about 65% higher for births to non-Hispanic Black mothers compared with births to non-Hispanic White and non-Hispanic Asian mothers.
Figure 2. Singleton preterm birth rates, by race and Hispanic origin of mother: United States, 2019 and 2020
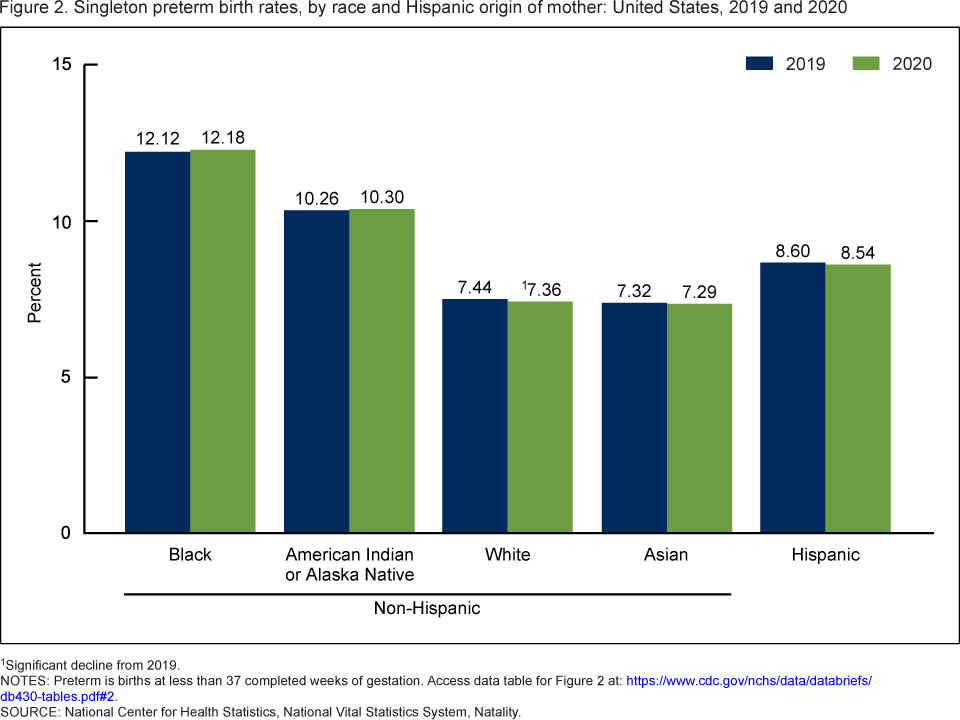
1Significant decline from 2019.
NOTES: Preterm is births at less than 37 completed weeks of gestation. Access data table for Figure 2.
SOURCE: National Center for Health Statistics, National Vital Statistics System, Natality.
The largest declines in singleton preterm birth rates in 2020 occurred in March, April, and November.
- Singleton preterm birth rates rose in January and February by 4%–5% but then declined from March through July by 2%–4%, with the largest declines occurring in March (4%) and April (3%) (Figure 3).
- From August through December, singleton preterm rates fluctuated. Rates increased 1% in October and declined 3% in November. Changes for August (1% increase), September (0.5% decrease), and December (1% decrease) were not significant.
Figure 3. Percent change in singleton preterm birth rates, by month of birth: United States, 2019 and 2020
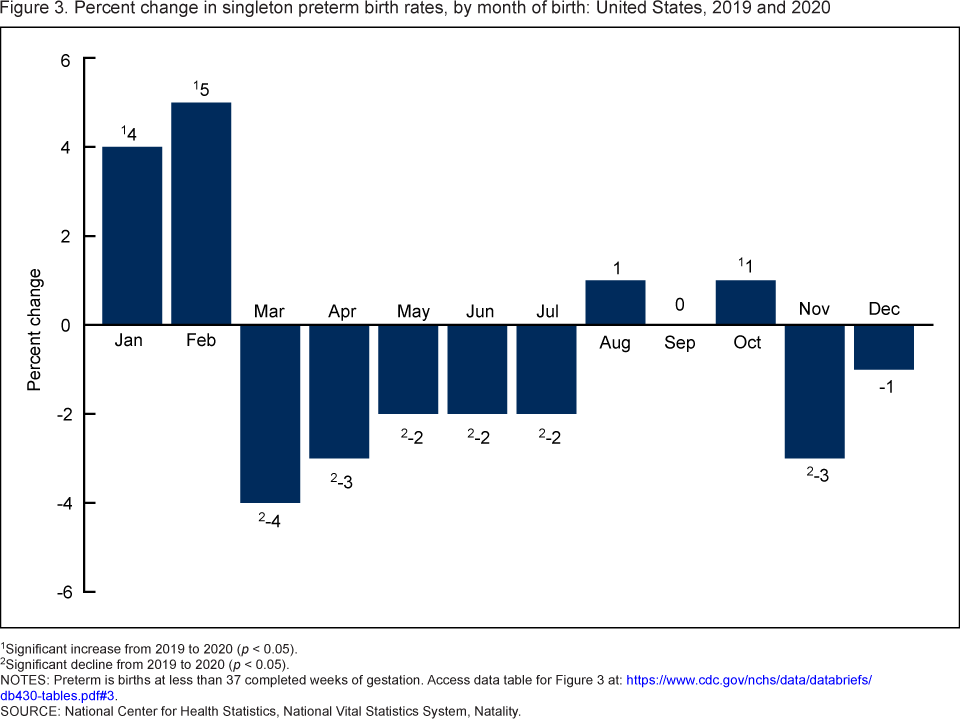
1Significant increase from 2019 to 2020 (p < 0.05).
2Significant decline from 2019 to 2020 (p < 0.05).
NOTES: Preterm is births at less than 37 completed weeks of gestation. Access data table for Figure 3.
SOURCE: National Center for Health Statistics, National Vital Statistics System, Natality.
Singleton preterm birth rates were essentially unchanged for most states between 2019 and 2020.
- Preterm birth rates for singletons declined by 1%–5% in four states between 2019 and 2020 (Illinois, Minnesota, Pennsylvania, and Texas) and increased by 4–5% in two states (Iowa and Missouri) (Figure 4).
- Singleton preterm birth rates did not change significantly in the remaining 44 states and the District of Columbia between 2019 and 2020.
Figure 4. Change in singleton preterm birth rates, by state: United States, 2019 and 2020
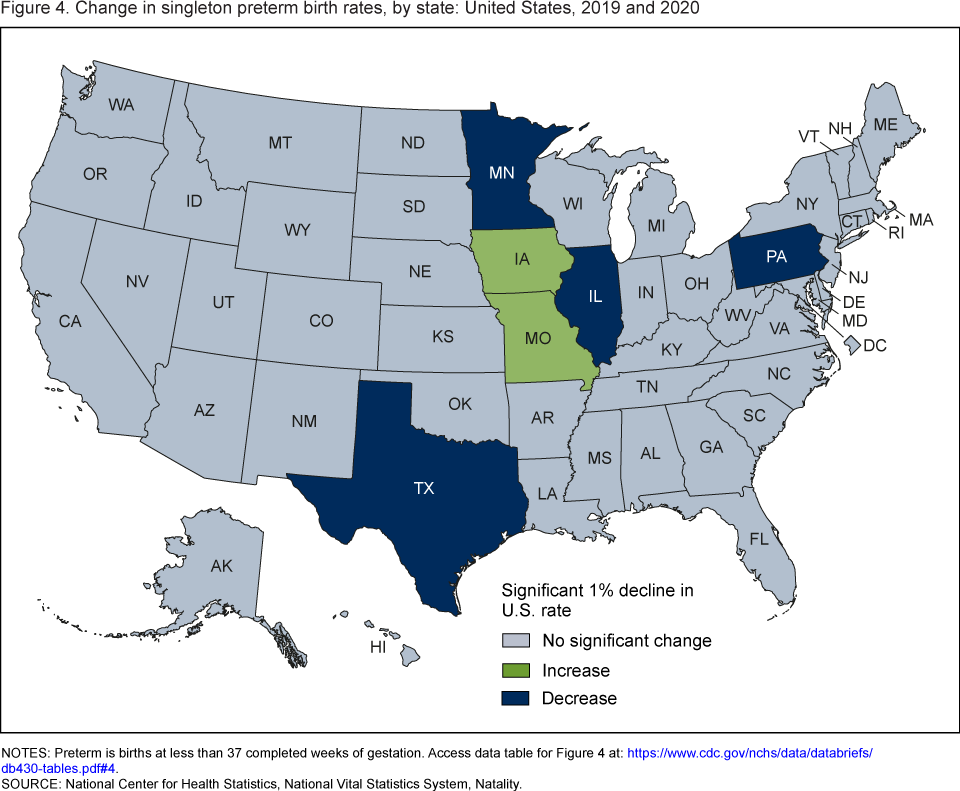
NOTES: Preterm is births at less than 37 completed weeks of gestation. Access data table for Figure 4.
SOURCE: National Center for Health Statistics, National Vital Statistics System, Natality.
Summary
Following average annual increases of 2% from 2014 to 2019, the singleton preterm birth rate declined by less than 1% in 2020. Early and late preterm rates also rose during 2014–2019 and declined by 1% or less between 2019 and 2020 (the decline in the late preterm birth rate was not significant).
Declines in singleton preterm birth rates for 2019–2020 were not seen across all race and Hispanic-origin groups, months, or state of birth. The rate declined 1% among births to non-Hispanic White mothers, but declines for births to non-Hispanic Asian and Hispanic mothers and increases for non-Hispanic Black and non-Hispanic American Indian Alaska Native mothers were not significant. After increasing in January and February of 2020 from 2019, singleton preterm births declined from March through July but then fluctuated for August through December. Declines in singleton preterm birth rates were observed in only four states, and increases were seen in two states.
Provisional data for the first 6 months of 2021 indicate that the preterm birth rate for all births generally increased (5).
Definitions
Preterm birth rate: Births delivered prior to 37 completed weeks of gestation per 100 births. Gestational age is based on the obstetric estimate of gestation.
- Early preterm birth rate: Births delivered at less than 34 completed weeks of gestation per 100 births.
- Late preterm birth rate: Births delivered at 34–36 completed weeks of gestation per 100 births.
Singleton births: Births in pregnancies for which only one fetus is delivered, live or dead, at any time during the pregnancy.
Data source and methods
This report uses data from the Natality Data File from the National Vital Statistics System. The vital statistics natality file is based on information from birth certificates and includes information for all births occurring in the United States (6).
The race and Hispanic-origin groups shown follow the 1997 Office of Management and Budget standards and differ from the bridged-race categories shown in reports prior to 2016 (6). Singleton preterm birth rates by state are based on the mother’s state of residence.
Trends were evaluated using the Cochran-Armitage test for trends, a modified chi-squared test. References to increases or decreases in rates or percentages indicate that differences are statistically significant at the 0.05 level based on a two-tailed z test. Computations exclude records for which information is unknown.
About the authors
Joyce A. Martin and Michelle J.K. Osterman are with the National Center for Health Statistics, Division of Vital Statistics.
References
- Institute of Medicine of the National Academies, Committee on Understanding Premature Birth and Assuring Healthy Outcomes. Preterm birth: Causes, consequences, and prevention. Washington, DC: National Academies Press. 2007.
- Simmons LE, Rubens CE, Darmstadt GL, Gravett MG. Preventing preterm birth and neonatal mortality: Exploring the epidemiology, causes, and interventions. Semin Perinatol 34(6):408–15. 2010.
- Osterman MJK, Hamilton BE, Martin JA, Driscoll AK, Valenzuela CP. Births: Final data for 2020. National Vital Statistics Reports; vol 70 no 17. Hyattsville, MD: National Center for Health Statistics. 2022 [Forthcoming].
- Chauhan SP, Scardo JA, Hayes E, Abuhamad AZ, Berghella V. Twins: Prevalence, problems, and preterm births. Am J Obstet Gynecol 203(4):305–15. 2010.
- National Center for Health Statistics. Provisional estimates for selected maternal and infant outcomes by month, 2018–2021.
- National Center for Health Statistics. User guide to the 2020 natality public use file.
Suggested citation
Martin JA, Osterman MJK. Exploring the decline in the singleton preterm birth rate in the United States, 2019–2020. NCHS Data Brief, no 430. Hyattsville, MD: National Center for Health Statistics. 2022. DOI: https://dx.doi.org/10.15620/cdc:112969.
Copyright information
All material appearing in this report is in the public domain and may be reproduced or copied without permission; citation as to source, however, is appreciated.
National Center for Health Statistics
Brian C. Moyer, Ph.D., Director
Amy M. Branum, Ph.D., Associate Director for Science
Division of Vital Statistics
Steven Schwartz, Ph.D., Director
Isabelle Horon, Dr.P.H., Acting Associate Director for Science