Emergency Department Visits Among Adults With Mental Health Disorders: United States, 2017–2019
NCHS Data Brief No. 426, December 2021
PDF Version (410 KB)
- Key findings
- What were the adult ED visit rates for patients with mental health disorders in 2017–2019, and did they differ by age?
- Did the percentage of adult ED visits lasting 4 hours or more differ by age for patients with and without mental health disorders?
- Did the percentage of adult ED visits that resulted in a hospital admission differ by age for patients with and without mental health disorders?
- Did the primary expected source of payment for adult ED visits differ for patients with and without mental health disorders?
- Summary
Data from the National Hospital Ambulatory Medical Care Survey, 2017–2019
- In 2017–2019, the emergency department (ED) visit rate for adults with mental health disorders was 52.9 per 1,000 adults and decreased with age.
- The percentage of ED visits lasting 4 hours or more was higher among visits by adults with mental health disorders than visits by adults without mental health disorders.
- The percentage of ED visits that resulted in a hospital admission increased with age among those both with and without mental health disorders.
- Among all adults, 41.9% of ED visits by adults with mental health disorders had Medicaid as their primary expected payment source compared with 29.5% of visits by adults without mental health disorders.
Mental health disorders, which include mental illnesses and substance use disorders, are a group of conditions characterized by alterations in thinking, emotions, or behavior (1). In 2019, 61.2 million adults aged 18 and over in the United States had a mental health disorder in the past year (2). This report presents data on emergency department (ED) visits by adults with mental health disorders.
Keywords: emergency care, mental illness, National Hospital Ambulatory Medical Care Survey
What were the adult ED visit rates for patients with mental health disorders in 2017–2019, and did they differ by age?
- In 2017–2019, the ED visit rate for patients with mental health disorders was 52.9 per 1,000 adults (Figure 1).
- The ED visit rates for patients with mental health disorders decreased with increasing age, from 64.9 per 1,000 adults aged 18–44 to 47.5 for adults aged 45–64 to 34.9 for adults aged 65 and over.
Figure 1. Emergency department visit rates for adults with mental health disorders, by age group: United States, 2017–2019
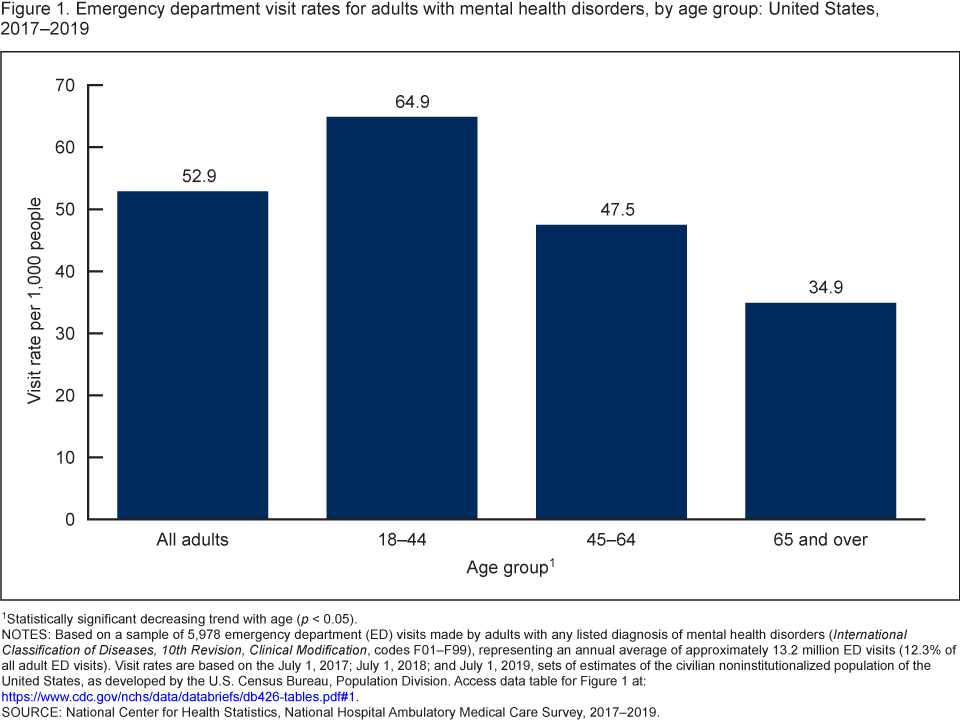
1Statistically significant decreasing trend with age (p < 0.05)
NOTES: Based on a sample of 5,978 emergency department (ED) visits made by adults with any listed diagnosis of mental health disorders (International Classification of Diseases, 10th Revision, Clinical Modification, codes F01–F99), representing an annual average of approximately 13.2 million ED visits (12.3% of all adult ED visits). Visit rates are based on the July 1, 2017; July 1, 2018; and July 1, 2019, sets of estimates of the civilian noninstitutionalized population of the United States, as developed by the U.S. Census Bureau, Population Division. Access data table for Figure 1.
SOURCE: National Center for Health Statistics, National Hospital Ambulatory Medical Care Survey, 2017–2019.
Did the percentage of adult ED visits lasting 4 hours or more differ by age for patients with and without mental health disorders?
- During 2017–2019, the percentage of adult ED visits lasting 4 hours or more was higher for patients with mental health disorders compared with patients without mental health disorders, for all age groups (Figure 2).
- The percentage of adult ED visits with or without mental health disorders lasting 4 hours or more increased with increasing age, from 40.7% among patients aged 18–44 to 51.6% among patients aged 65 and over with mental health disorders, and from 25.6% among patients aged 18–44 to 42.5% among patients aged 65 and over without mental health disorders.
Figure 2. Percentage of adult emergency department visits lasting 4 hours or more made by patients with and without mental health disorders, by age group: United States, 2017–2019
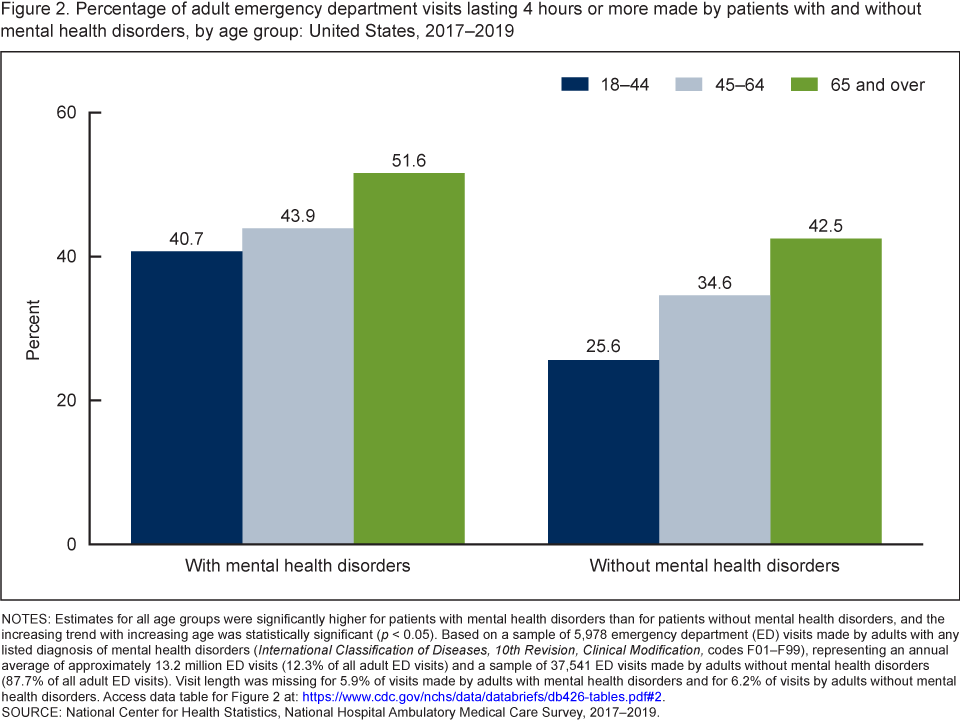
NOTES: Estimates for all age groups were significantly higher for patients with mental health disorders than for patients without mental health disorders, and the increasing trend with increasing age was statistically significant (p < 0.05). Based on a sample of 5,978 emergency department (ED) visits made by adults with any listed diagnosis of mental health disorders (International Classification of Diseases, 10th Revision, Clinical Modification, codes F01–F99), representing an annual average of approximately 13.2 million ED visits (12.3% of all adult ED visits) and a sample of 37,541 ED visits made by adults without mental health disorders (87.7% of all adult ED visits). Visit length was missing for 5.9% of visits made by adults with mental health disorders and for 6.2% of visits by adults without mental health disorders. Access data table for Figure 2.
SOURCE: National Center for Health Statistics, National Hospital Ambulatory Medical Care Survey, 2017–2019.
Did the percentage of adult ED visits that resulted in a hospital admission differ by age for patients with and without mental health disorders?
- During 2017–2019, the percentage of ED visits by patients with mental health disorders that resulted in a hospital admission was higher than visits by patients without mental health disorders among adults aged 18–44 (8.7% compared with 5.7%) and lower among those aged 65 and over (23.7% compared with 27.5%); however, the difference among adults aged 65 and over was not statistically significant (Figure 3). The percentage of ED visits resulting in hospital admission was similar among those with and without mental health disorders among adults aged 45–64.
- The percentage of adult ED visits by patients with and without mental health disorders that resulted in hospital admissions increased with age.
Figure 3. Percentage of adult emergency department visits with and without mental health disorders that resulted in a hospital admission, by age group: United States, 2017–2019
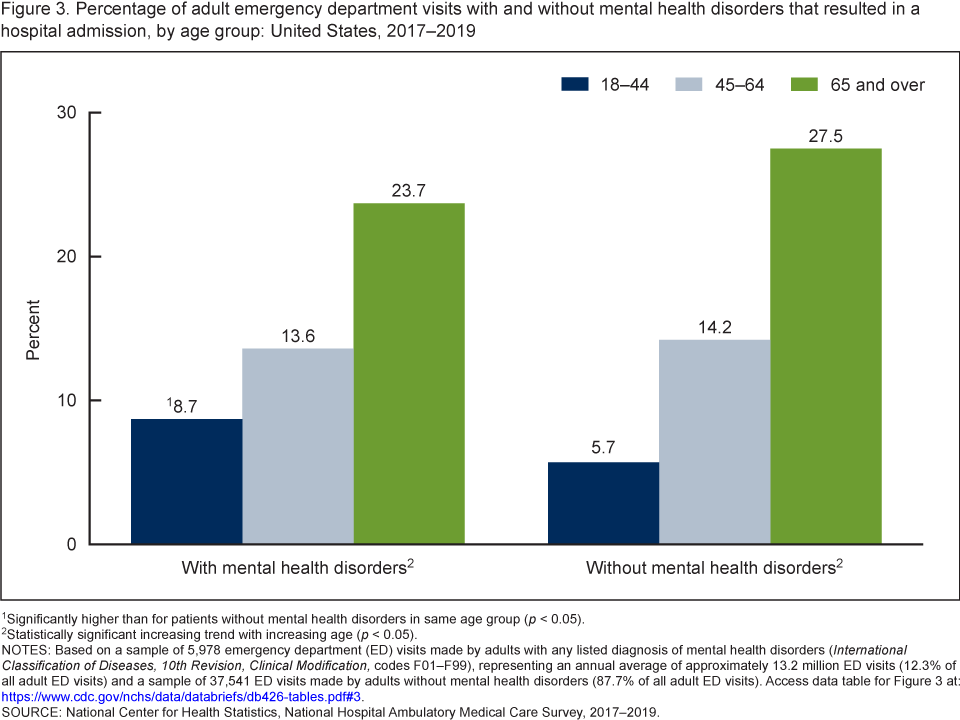
1Significantly higher than for patients without mental health disorders in same age group (p < 0.05).
2Statistically significant increasing trend with increasing age (p < 0.05).
NOTES: Based on a sample of 5,978 emergency department (ED) visits made by adults with any listed diagnosis of mental health disorders (International Classification of Diseases, 10th Revision, Clinical Modification, codes F01–F99), representing an annual average of approximately 13.2 million ED visits (12.3% of all adult ED visits) and a sample of 37,541 ED visits made by adults without mental health disorders (87.7% of all adult ED visits). Access data table for Figure 3.
SOURCE: National Center for Health Statistics, National Hospital Ambulatory Medical Care Survey, 2017–2019.
Did the primary expected source of payment for adult ED visits differ for patients with and without mental health disorders?
- During 2017–2019, the percentage of adult ED visits for patients with a primary expected source of payment of private insurance was lower for those with mental health disorders (22.9%) than for those without mental health disorders (28.8%) (Figure 4).
- The percentage of adult ED visits for patients with a primary expected source of payment of Medicare was lower for those with mental health disorders (23.8%) than for those without mental health disorders (30.3%).
- The percentage of adult ED visits for patients with a primary expected source of payment of Medicaid was higher for those with mental health disorders (41.9%) than for those without mental health disorders (29.5%).
Figure 4. Percentage of adult emergency department visits made by patients with and without mental health disorders, by primary expected source of payment: United States, 2017–2019
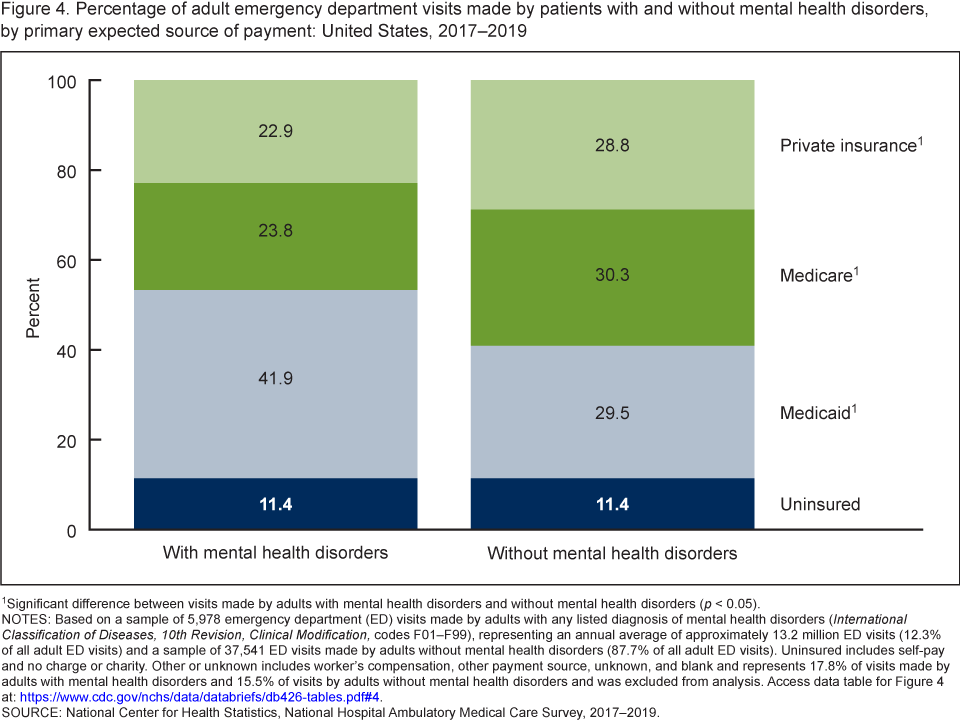
1Significant difference between visits made by adults with mental health disorders and without mental health disorders (p < 0.05).
NOTES: Based on a sample of 5,978 emergency department (ED) visits made by adults with any listed diagnosis of mental health disorders (International Classification of Diseases, 10th Revision, Clinical Modification, codes F01–F99), representing an annual average of approximately 13.2 million ED visits (12.3% of all adult ED visits) and a sample of 37,541 ED visits made by adults without mental health disorders (87.7% of all adult ED visits). Uninsured includes self-pay and no charge or charity. Other or unknown includes worker’s compensation, other payment source, unknown, and blank and represents 17.8% of visits made by adults with mental health disorders and 15.5% of visits by adults without mental health disorders and was excluded from analysis. Access data table for Figure 4.
SOURCE: National Center for Health Statistics, National Hospital Ambulatory Medical Care Survey, 2017–2019.
Summary
In 2017–2019, the ED visit rate for patients with mental health disorders was 52.9 per 1,000 adults. Differences by age in the duration of ED visits and the admission status were identified as well as differences in the primary expected source of payment. The ED visit rate for mental health disorders was higher among younger adults than older adults. A higher percentage of adult ED visits made by patients with mental health disorders had visits lasting 4 hours or more than visits made by patients without mental health disorders. A higher percentage of adult ED visits made by patients aged 18–44 with mental health disorders resulted in hospital admission (8.7%) than visits made by patients without mental health disorders in the same age group (5.7%). Overall, 41.9% of ED visits made by adults with mental health disorders had Medicaid as the primary expected source of payment compared with 29.5% of ED visits for adults without mental health disorders. This may partly reflect differences in ED visit rates for mental health disorders by age, with younger adults being more represented among visits compared with older adults. With the COVID-19 pandemic impacting people’s mental health (3) and the possible link between pre-existing mental health disorders and increased risk of adverse outcomes in patients with COVID-19 infection (4), monitoring ED visits for patients with mental health disorders will continue to inform surveillance efforts.
Definitions
ED visits by adults with mental health disorders: A visit to the ED made by patients aged 18 and over with any listed diagnosis of a mental health disorder. Diagnoses are coded according to the International Classification of Diseases, 10th Revision, Clinical Modification (ICD–10–CM) coding system (5) (ICD–10–CM, codes F01–F99).
ED visit rate: Calculated by dividing the number of adult ED visits by patients with any diagnosis of a mental health disorder by the July 1, 2017; July 1, 2018; and July 1, 2019, estimates of the adult civilian noninstitutionalized population of the United States (obtained from the U.S. Census Bureau’s Population Division) for each demographic group.
Primary expected source of payment: During data collection, all sources of payment were collected. For patients with more than one source of payment, the hierarchy below was used (with Medicare counted first and self-pay and no charge counted last) to collapse payments into one mutually exclusive variable (primary expected source of payment).
- Medicare: Partial or full payment by Medicare plan includes payments made directly to the hospital or reimbursed to the patient. Charges covered under a Medicare-sponsored prepaid plan are included.
- Medicaid: Partial or full payment by Medicaid plan includes payments made directly to the hospital or reimbursed to the patient. Charges covered under a Medicaid-sponsored prepaid plan (health maintenance organization) or “managed Medicaid” are included.
- Private: Partial or full payment by a private insurer (for example, BlueCross BlueShield), either directly to the hospital or reimbursed to the patient. Charges covered under a private insurance-sponsored prepaid plan are included.
- Uninsured: Self-pay are charges that are paid by the patient or patient’s family, which will not be reimbursed by a third party. Self-pay includes visits for which the patient is expected to be ultimately responsible for most of the bill, even if the patient never actually pays it. This does not include copayments or deductibles. No charge or charity are visits for which no fee is charged (for example, charity, special research, or teaching).
Data source and methods
Data for this report are from the National Hospital Ambulatory Medical Care Survey (NHAMCS), an annual nationally representative survey of nonfederal, general, and short-stay hospitals. NHAMCS uses a multistage probability design with samples of geographic primary sampling units (PSUs), hospitals within PSUs, and patient visits within EDs. Additional information on the methodology of NHAMCS is available (6–8). This report presents combined data for 2017–2019 to enable more detailed subgroup analyses. Estimates of the weighted number of visits are based on 3-year annual averages.
Data analyses were performed using the statistical packages SAS version 9.4 (SAS Institute, Cary, N.C.) and SAS-callable SUDAAN version 11.0 (RTI International, Research Triangle Park, N.C.). Linear regression was used to test the significance of slopes for age trends. All percentage estimates presented meet NCHS guidelines for presentation of proportions (9) and follow NCHS trend analysis guidelines (10). Differences among subgroups were evaluated using two-sided significance tests at the 0.05 level.
About the authors
Loredana Santo, Zachary J. Peters, and Carol J. DeFrances are with the National Center for Health Statistics, Division of Health Care Statistics.
References
- Reeves WC, Strine TW, Pratt LA, Thompson W, Ahluwalia I, Dhingra SS, et al. Mental illness surveillance among adults in the United States. MMWR Suppl 60(3):1–29.
- Substance Abuse and Mental Health Services Administration. Key substance use and mental health indicators in the United States: Results from the 2019 National Survey on Drug Use and Health. Rockville, MD: Center for Behavioral Health Statistics and Quality. 2020.
- COVID-19 and mental health. Lancet Psychiatry 8(2):87. 2021. DOI: https://doi.org/10.1016/S2215-0366(21)00005-5.
- Wang Q, Xu R, Volkow ND. Increased risk of COVID-19 infection and mortality in people with mental disorders: Analysis from electronic health records in the United States. World Psychiatry 20(1):124–30. 2020. DOI: https://doi.org/10.1002/wps.20806.
- National Center for Health Statistics. International classification of diseases, 10th revision, clinical modification (ICD–10–CM).
- National Center for Health Statistics. 2017 NHAMCS micro-data file documentation. 2018.
- National Center for Health Statistics. 2018 NHAMCS micro-data file documentation. 2020.
- National Center for Health Statistics. 2019 NHAMCS micro-data file documentation. 2021.
- Parker JD, Talih M, Malec DJ, Beresovsky B, Carroll M, Gonzalez JF Jr, et al. National Center for Health Statistics data presentation standards for proportions. National Center for Health Statistics. Vital Health Stat 2(175). 2017.
- Ingram DD, Malec DJ, Makuc DM, Kruszon-Moran D, Gindi RM, Albert M, et al. National Center for Health Statistics guidelines for analysis of trends. National Center for Health Statistics. Vital Health Stat 2(179). 2018.
Suggested citation
Santo L, Peters ZJ, DeFrances CJ. Emergency department visits among adults with mental health disorders: United States, 2017–2019. NCHS Data Brief, no 426. Hyattsville, MD: National Center for Health Statistics. 2021. DOI: https://dx.doi.org/10.15620/cdc:112081.
Copyright information
All material appearing in this report is in the public domain and may be reproduced or copied without permission; citation as to source, however, is appreciated.
National Center for Health Statistics
Brian C. Moyer, Ph.D., Director
Amy M. Branum, Ph.D., Associate Director for Science
Division of Health Care Statistics
Carol J. DeFrances, Ph.D., Acting Director
Alexander Strashny, Ph.D., Associate Director for Science