State Declines in Heart Disease Mortality in the United States, 2000–2019
NCHS Data Brief No. 425, December 2021
PDF Version (736KB)
- Key findings
- What was the national trend in heart disease death rates from 2000 to 2019?
- How did heart disease death rates vary by state in 2019?
- How did the change in heart disease death rates from 2000 to 2011 vary by state?
- How did the change in heart disease death rates from 2011 to 2019 vary by state?
- Summary
Data from the National Vital Statistics System
-
During 2000–2011, the U.S. age-adjusted heart disease death rate declined an average of 3.7% per year but slowed to a decline of 0.7% per year during 2011–2019.
-
In 2019, age-adjusted heart disease death rates ranged from a low of 116.7 deaths per 100,000 population in Minnesota to a high of 231.4 in Oklahoma.
-
From 2000 to 2011, age-adjusted death rates for heart disease declined in all states.
-
From 2011 to 2019, age-adjusted death rates for heart disease declined in one-half of states and the District of Columbia, did not change in 24 states, and increased in one state.
Heart disease was the leading cause of death nationally in 2019, consistent with historical patterns since 1921 (1,2). Age-adjusted death rates for heart disease have shown a steady decline since the mid-1960s, and death rates, as well as changes in rates, vary by state. This report examines changes in heart disease death rates from 2000 through 2019 for the United States and for each state and the District of Columbia (D.C.).
Keywords: cause of death, death rates, National Vital Statistics System
What was the national trend in heart disease death rates from 2000 to 2019?
- In the United States, the overall age-adjusted heart disease death rate decreased from 257.6 deaths per 100,000 population in 2000 to 161.5 in 2019 (Figure 1).
- During 2000–2011, the average annual decline in the age-adjusted death rate for heart disease was 3.7% (from 257.6 to 173.7 deaths per 100,000 population).
- During 2011–2019, the average annual decline in the age-adjusted heart disease death rate slowed to 0.7% (from 173.7 to 161.5).
Figure 1. Age-adjusted heart disease death rate: United States,
2000–2019
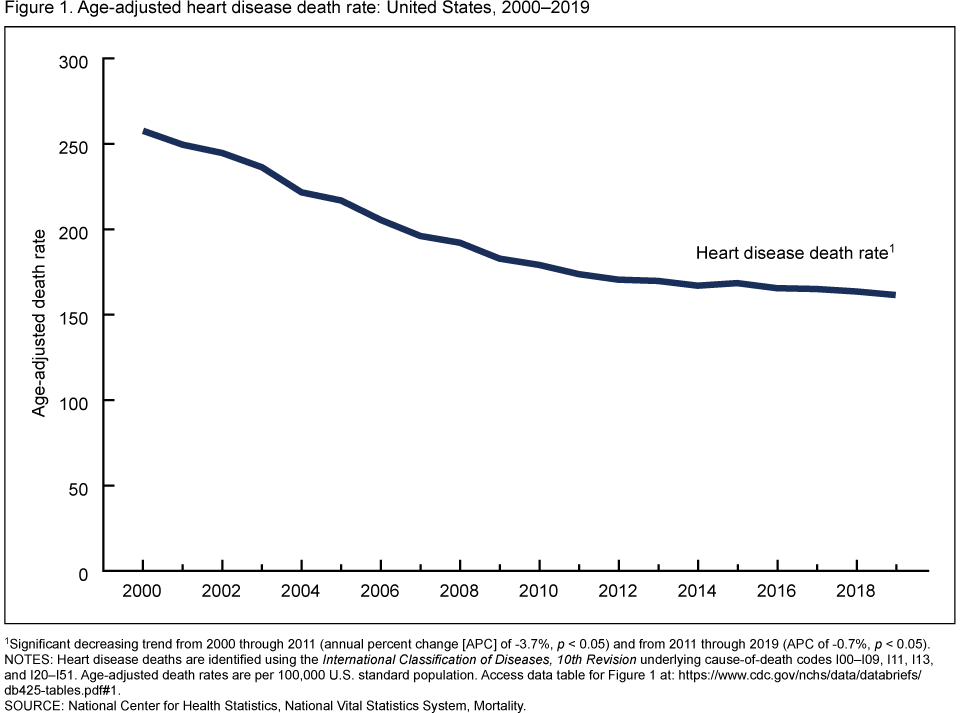
1Significant decreasing trend from 2000 through 2011 (annual percent change [APC] of -3.7%, p < 0.05) and from 2011 through 2019 (APC of -0.7%, p < 0.05).
NOTES: Heart disease deaths are identified using the International Classification of Diseases, 10th Revision underlying cause-of-death codes I00–I09, I11, I13, and I20–I51. Age-adjusted death rates are per 100,000 U.S. standard population. Access data table for Figure 1.
SOURCE: National Center for Health Statistics, National Vital Statistics System, Mortality.
How did heart disease death rates vary by state in 2019?
- In 2019, the age-adjusted heart disease death rates varied by state, ranging from 116.7 per 100,000 in Minnesota to 231.4 in Oklahoma (Figure 2).
- Heart disease death rates tended to be lower in the West and Northeast, although Florida and Minnesota were also in the lowest quartile of rates. Minnesota (116.7), Hawaii (120.3), Massachusetts (127.2), Colorado (127.7), and Alaska (129.7) were the five states with the lowest rates.
- Heart disease death rates tended to be higher in the South and Midwest, although Nevada was in the highest quartile of rates. Louisiana (207.8), Alabama (219.6), Arkansas (226.5), Mississippi (226.7), and Oklahoma (231.4) were the five states with the highest rates.
Figure 2. Age-adjusted heart disease death rate, by state:
United States, 2019
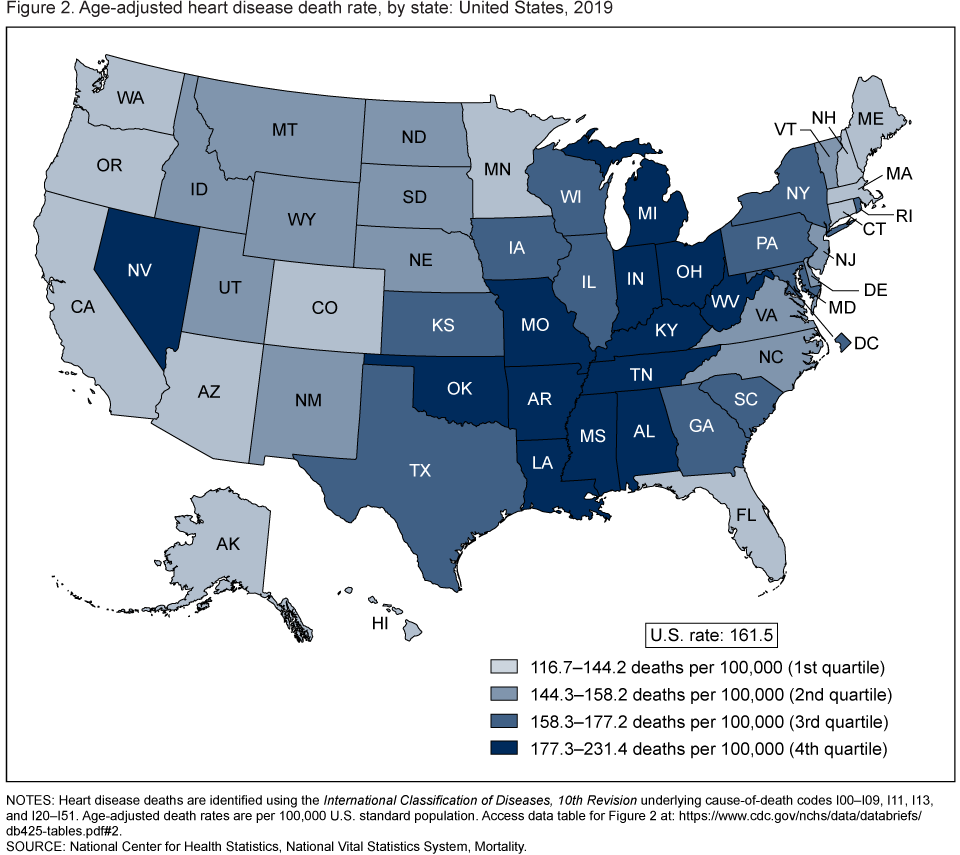
NOTES: Heart disease deaths are identified using the International Classification of Diseases, 10th Revision underlying cause-of-death codes I00–I09, I11, I13, and I20–I51. Age-adjusted death rates are per 100,000 U.S. standard population. Access data table for Figure 2.
SOURCE: National Center for Health Statistics, National Vital Statistics System, Mortality.
How did the change in heart disease death rates from 2000 to 2011 vary by state?
- Declines from 2000 to 2011 in age-adjusted heart disease death rates by state ranged from 23.1% in Nevada to 37.4% in D.C. (Figure 3).
- Age-adjusted heart disease death rates decreased by 30.0%–39.9% in 35 states and D.C., primarily on the East and West coasts and in the Midwest.
- Age-adjusted heart disease death rates decreased by 20.0%–29.9% in 15 states, predominantly in the South and Mountain states.
- No states had age-adjusted heart disease death rates that increased or stayed the same.
Figure 3. Change in age-adjusted heart disease death rate, by state: United States, 2000 and 2011
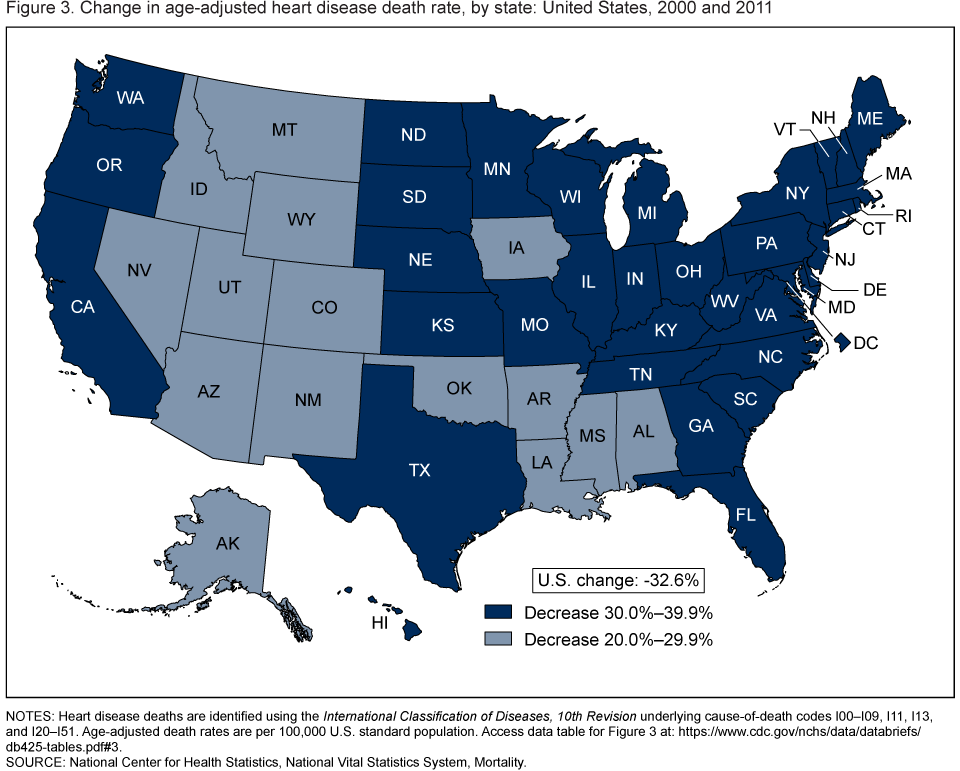
NOTES: Heart disease deaths are identified using the International Classification of Diseases, 10th Revision underlying cause-of-death codes I00–I09, I11, I13, and I20–I51. Age-adjusted death rates are per 100,000 U.S. standard population. Access data table for Figure 3.
SOURCE: National Center for Health Statistics, National Vital Statistics System, Mortality.
How did the change in heart disease death rates from 2011 to 2019 vary by state?
- State-specific changes in age-adjusted heart disease death rates from 2011 to 2019 ranged from a decline of 14.0% in New York to an increase of 5.9% in Arkansas (Figure 4).
- Age-adjusted heart disease death rates decreased by 10.0%–19.9% in six states and D.C.
- Age-adjusted heart disease death rates decreased by less than 10.0% in 19 states, particularly in the Midwest and South.
- No changes occurred in age-adjusted heart disease death rates in 24 states, mostly in the Midwest and Mountain states. In one state, Arkansas, the age-adjusted heart disease death rate increased during this period.
Figure 4. Change in age-adjusted heart disease death rate, by state: United States, 2011 and 2019
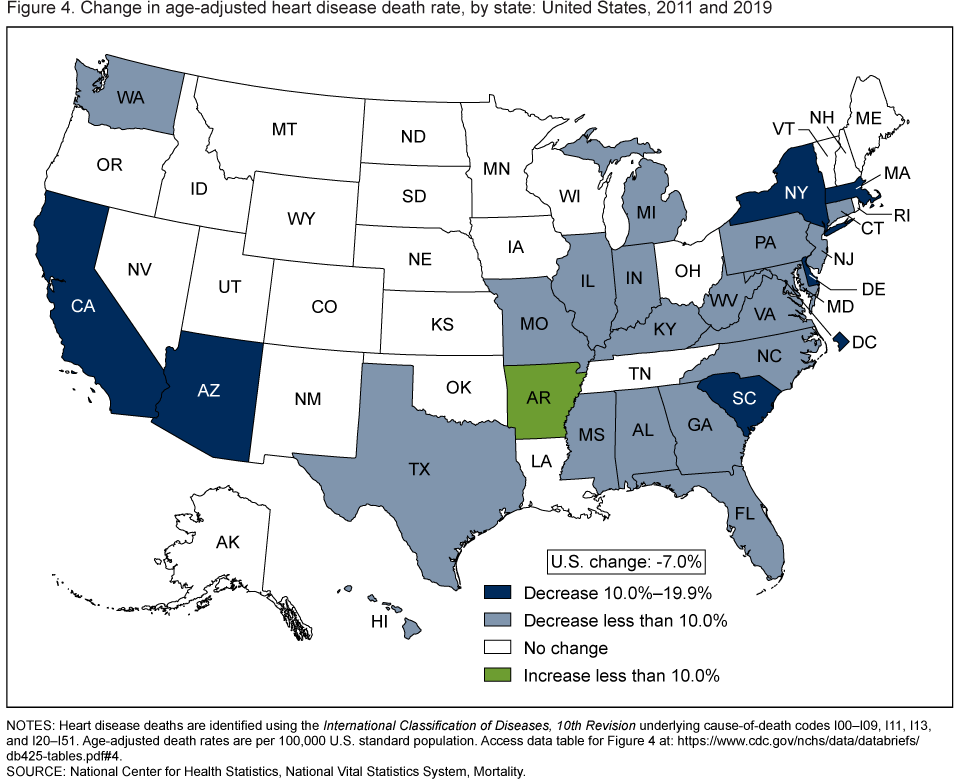
NOTES: Heart disease deaths are identified using the International Classification of Diseases, 10th Revision underlying cause-of-death codes I00–I09, I11, I13, and I20–I51. Age-adjusted death rates are per 100,000 U.S. standard population. Access data table for Figure 4.
SOURCE: National Center for Health Statistics, National Vital Statistics System, Mortality.
Summary
This report presents changes in the rates of death due to heart disease during 2000–2019 nationally and examines how the changes in rates varied by state and over time. During 2000–2011, the U.S. age-adjusted heart disease death rate declined an average of 3.7% per year, slowing during 2011–2019 to a decline of 0.7% per year. In 2019, age-adjusted heart disease death rates varied by state, from 116.7 deaths per 100,000 population in Minnesota to 231.4 in Oklahoma. From 2000 to 2011, age-adjusted heart disease death rates decreased in all states, and most decreased by 30.0%–39.9%. From 2011 to 2019, about one-half of states decreased by less than 20.0%, and about one-half did not change. Although heart disease remains the leading cause of death, this report’s findings are consistent with the long-term trend in heart disease death rates. Heart disease death rates declined rapidly beginning in the mid-1960s, but that decline slowed in the 2010s. Changes in state heart disease death rates are also consistent with this pattern, with larger declines in state heart disease death rates earlier in the 2000s and smaller declines or no changes in state heart disease death rates in the 2010s.
Definitions
Region: The four regions of the United States, based on U.S. Census Bureau definitions, are Northeast, Midwest, South, and West.
- The Northeast consists of the New England and Middle Atlantic states: Connecticut, Maine, Massachusetts, New Hampshire, New Jersey, New York, Pennsylvania, Rhode Island, and Vermont.
- The Midwest includes the East North Central and West North Central states: Illinois, Indiana, Iowa, Kansas, Michigan, Minnesota, Missouri, Nebraska, North Dakota, Ohio, South Dakota, and Wisconsin.
- The South consists of the South Atlantic, East South Central, and West South Central divisions, which include Alabama, Arkansas, Delaware, D.C., Florida, Georgia, Kentucky, Louisiana, Maryland, Mississippi, North Carolina, Oklahoma, South Carolina, Tennessee, Texas, Virginia, and West Virginia.
- The West includes the Mountain and Pacific states of Alaska, Arizona, California, Colorado, Hawaii, Idaho, Montana, Nevada, New Mexico, Oregon, Utah, Washington, and Wyoming (3).
Data source and methods
Data from all death certificates registered from 2000 through 2019 in the 50 states and D.C. were analyzed to calculate age-adjusted heart disease death rates by year and state. Cause of death is based on medical information reported by certifiers—usually a physician, medical examiner, or coroner—on death certificates registered in the United States. This information is classified and coded in accordance with the International Statistical Classification of Diseases and Related Health Problems, 10th Revision (ICD–10) (4). Heart disease deaths are defined as death records with underlying cause-of-death ICD–10 codes I00–I09, I11, I13, and I20–I51.
For 2019, death rates are based on population estimates for July 1, 2019, that are consistent with the April 1, 2010, census. These population estimates (as well as population figures for the 2010 census) are available from the CDC WONDER website (5). Age-adjusted death rates are useful when comparing different populations because they remove the potential bias that can occur when the populations being compared have different age structures. The National Center for Health Statistics uses the direct method of standardization; see Technical Notes in “Deaths: Final Data for 2018” (6) for more information.
The National Cancer Institute’s Joinpoint software (Version 4.7.0.0) was used to analyze the trend in age-adjusted heart disease death rates from 2000 through 2019. A linear weighted least-squares model was fitted and log transformed. The grid search algorithm method was used and a maximum of three joinpoints were allowed (only on an actual data year), with a minimum of two observations required between joinpoints as well as between a joinpoint and the end of the data. An uncorrelated errors model was fitted, a permutation test was used for the model selection method, and the parametric method was used for the annual percent change/average annual percent change/tau confidence intervals. The alpha was set at 0.05. All differences are statistically significant unless otherwise noted.
A joinpoint was found at 2011, so state changes in heart disease mortality were evaluated for 2000 to 2011 and then 2011 to 2019. Changes in death rates were evaluated by comparing 95% confidence intervals.
About the authors
Anthony Sawyer and Lee Anne Flagg are with the National Center for Health Statistics, Division of Vital Statistics.
References
- Kochanek KD, Xu JQ, Arias E. Mortality in the United States, 2019. NCHS Data Brief, no 395. Hyattsville, MD: National Center for Health Statistics. 2020.
- National Center for Health Statistics. Leading causes of death, 1900–1998. Hyattsville, MD.
- U.S. Census Bureau. Census regions and divisions of the United States.
- World Health Organization. International statistical classification of diseases and related health problems, 10th revision (ICD–10), vol 1. 5th ed. Geneva, Switzerland. 2016.
- Centers for Disease Control and Prevention. CDC WONDER. Underlying cause of death. 1999–2019: Underlying cause of death by bridged-race categories.
- Murphy SL, Xu JQ, Kochanek KD, Arias E, Tejada-Vera B. Deaths: Final data for 2018. National Vital Statistics Reports; vol 69 no 13. Hyattsville, MD: National Center for Health Statistics. 2021.
Suggested citation
Sawyer A, Flagg LA. State declines in heart disease mortality in the United States, 2000–2019. NCHS Data Brief, no 425. Hyattsville, MD: National Center for Health Statistics. 2021. DOI: https://dx.doi.org/10.15620/cdc:112339.
Copyright information
All material appearing in this report is in the public domain and may be reproduced or copied without permission; citation as to source, however, is appreciated.
National Center for Health Statistics
Brian C. Moyer, Ph.D., Director
Amy M. Branum, Ph.D., Associate Director for Science
Division of Vital Statistics
Steven Schwartz, Ph.D., Director
Isabelle Horon, Dr.P.H., Acting Associate Director for Science