Perceived Social and Emotional Support Among Adults: United States, July–December 2020
NCHS Data Brief No. 420, October 2021
PDF Version (554 KB) | Visual Abstract
- Key findings
- More than three-quarters of adults aged 18 and over always or usually received the social and emotional support they needed.
- The percentage of adults who always or usually received the social and emotional support they needed varied by age and race and ethnicity.
- The percentage of adults who always or usually received the social and emotional support they needed varied by marital status and household composition.
- The percentage of adults who always or usually received the social and emotional support they needed varied by income and education.
- The percentage of adults who always or usually received the social and emotional support they needed varied by disability status.
Data from the National Health Interview Survey, July–December 2020
- More than three-quarters (77.5%) of adults always or usually received the social and emotional support they needed.
- Social and emotional support was lower among Hispanic (70.9%), non-Hispanic black (71.6%), and non-Hispanic Asian (71.3%) adults compared with non-Hispanic white (81.2%) adults.
- The percentage of adults who always or usually received the social and emotional support they needed was higher among adults who were married or living with a partner compared with adults not in those relationships.
- Social and emotional support increased as educational attainment and family income increased.
- A greater percentage of adults without disability (78.6%) received the social and emotional support they needed compared with adults with disability (65.5%).
Social and emotional support is positively associated with improved well-being and a reduced risk of premature mortality (1–4). The frequency by which adults receive the social and emotional support they need can vary by demographics and can be impacted in times of stress (5,6). This report describes the percent distribution of perceived social and emotional support among adults aged 18 and over and how the percentage of adults who always or usually have this support varies by selected sociodemographic characteristics based on data from the National Health Interview Survey (NHIS) collected during July–December 2020.
Keywords: loneliness, social isolation, National Health Interview Survey (NHIS)
More than three-quarters of adults aged 18 and over always or usually received the social and emotional support they needed.
Among all adults, 52.4% always received, 25.1% usually received, 12.2% sometimes received, 4.3% rarely received, and 6.0% never received the social and emotional support they needed (Figure 1).
Figure 1. Percent distribution of how often adults received the social and emotional support they needed: United States, July–December 2020
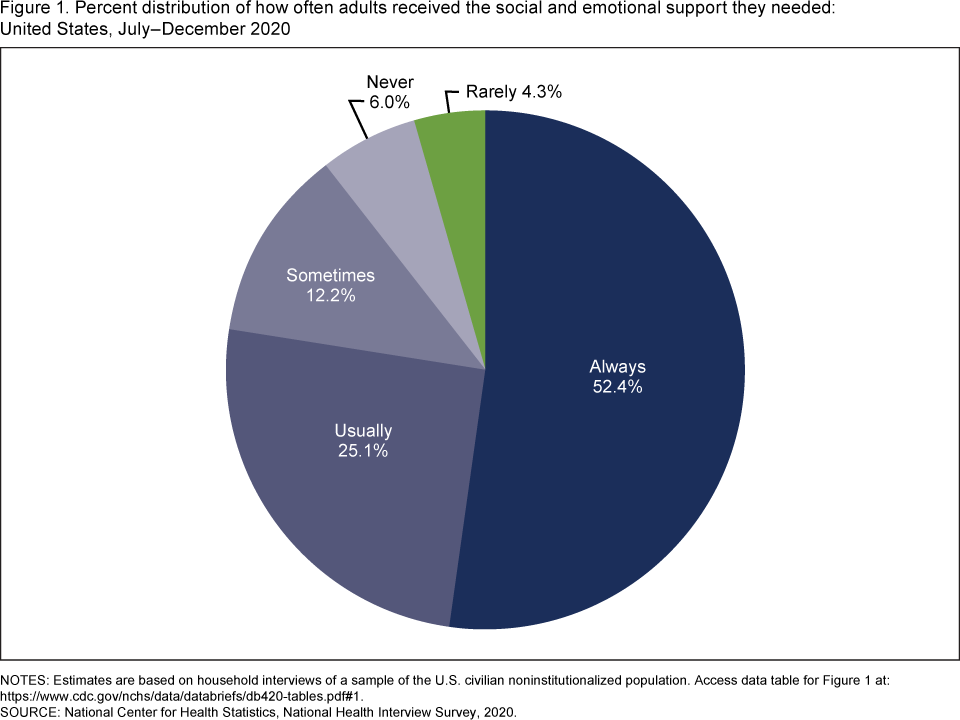
NOTE: Estimates are based on household interviews of a sample of the U.S. civilian noninstitutionalized population. Access data table for Figure 1.
SOURCE: National Center for Health Statistics, National Health Interview Survey, 2020.
The percentage of adults who always or usually received the social and emotional support they needed varied by age and race and ethnicity.
- More than three-quarters of adults (80.0%) aged 18–34, 75.9% of adults aged 35–49, 74.4% of adults aged 50–64, and 79.5% of adults aged 65 and over always or usually received the social and emotional support they needed (Figure 2).
- Non-Hispanic white adults (81.2%) were more likely to always or usually receive the social and emotional support they needed than Hispanic (70.9%), non-Hispanic black (71.6%), and non-Hispanic Asian (71.3%) adults.
- Women (77.6%) were as likely as men (77.5%) to always or usually receive the social and emotional support they needed.
Figure 2. Percentage of adults who always or usually received the social and emotional support they needed, by sex, age, and race and ethnicity: United States, July–December 2020
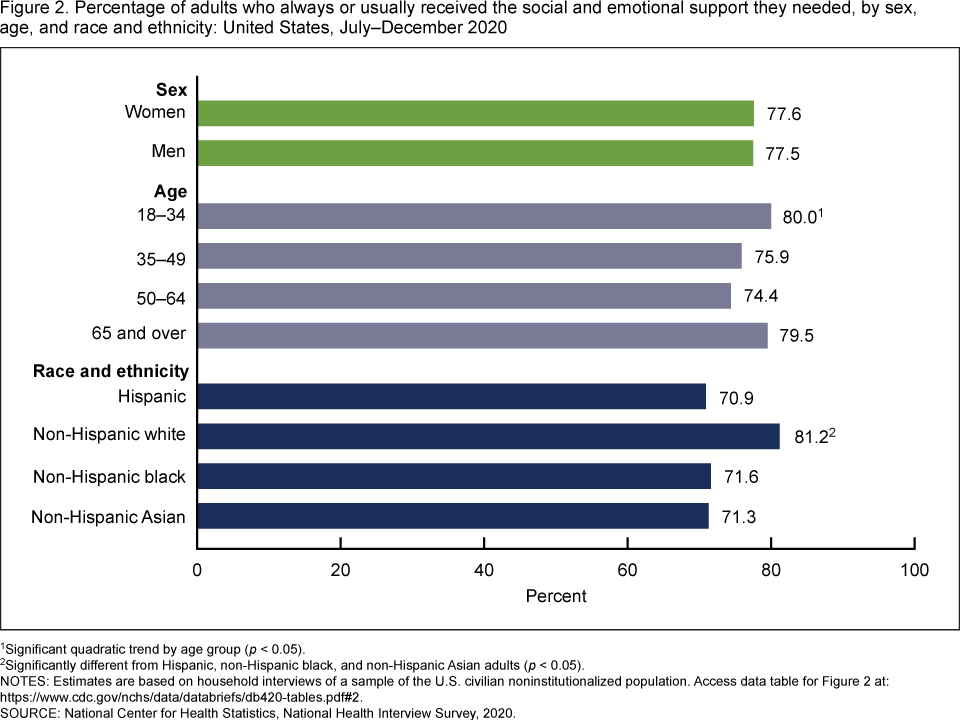
1Significant quadratic trend by age group (p < 0.05).
2Significantly different from Hispanic, non-Hispanic black, and non-Hispanic Asian adults (p < 0.05).
NOTE: Estimates are based on household interviews of a sample of the U.S. civilian noninstitutionalized population. Access data table for Figure 2.
SOURCE: National Center for Health Statistics, National Health Interview Survey, 2020.
The percentage of adults who always or usually received the social and emotional support they needed varied by marital status and household composition.
- Adults who were living with a partner (80.1%) and married adults (81.5%) were more likely than adults who were not living with a partner or married (71.6%) to always or usually receive the social and emotional support they needed (Figure 3).
- Adults living in a household with two or more adults (81.0% among those living in a household with no children, 77.4% among those living in a household with one or more children) were more likely than adults in a single-adult household to always or usually receive the social and emotional support they needed, regardless of whether the household included children (67.6% among those living in a household with no children and 67.5% among those living in a household with one or more children).
Figure 3. Percentage of adults who always or usually received the social and emotional support they needed, by marital status and household composition: United States, July–December 2020

1Significantly different from adults who are married or living with a partner (p < 0.05).
2Significantly different from adults who live in a household with two or more adults and no children (p < 0.05).
3Significantly different from adults who live in a household with two or more adults and one or more children (p < 0.05).
4Significantly different from adults who live in a household with one adult and one or more children (p < 0.05).
NOTES: Estimates are based on household interviews of a sample of the U.S. civilian noninstitutionalized population. Access data table for Figure 3.
SOURCE: National Center for Health Statistics, National Health Interview Survey, 2020.
The percentage of adults who always or usually received the social and emotional support they needed varied by income and education.
- The percentage of adults who always or usually received the emotional support they needed increased as income increased from 63.2% among adults with a family income of less than 100% of the federal poverty level (FPL) to 85.0% among adults with a family income of 400% or more of the FPL (Figure 4).
- The percentage of adults who always or usually received the emotional support they needed increased as education increased from 67.6% among adults with less than a high school diploma or GED to 83.1% among adults with a college degree or higher.
Figure 4. Percentage of adults who always or usually received the social and emotional support they needed, by family income and education level: United States, July–December 2020
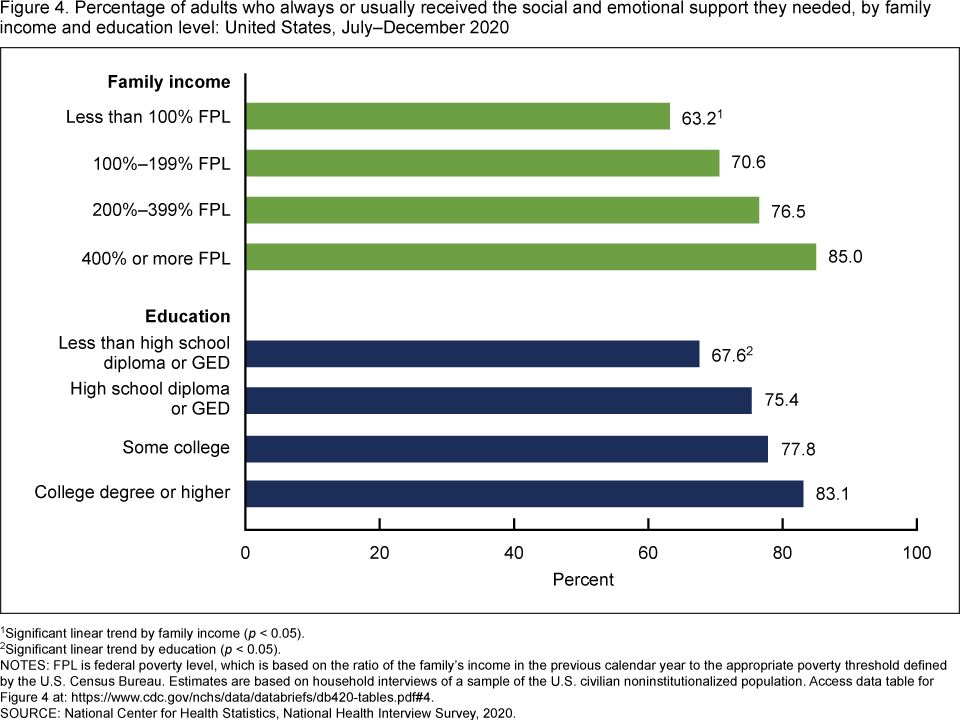
1Significant linear trend by family income (p < 0.05).
2Significant linear trend by education (p < 0.05).
NOTES: FPL is federal poverty level, which is based on the ratio of the family’s income in the previous calendar year to the appropriate poverty threshold defined by the U.S. Census Bureau. Estimates are based on household interviews of a sample of the U.S. civilian noninstitutionalized population. Access data table for Figure 4.
SOURCE: National Center for Health Statistics, National Health Interview Survey, 2020.
The percentage of adults who always or usually received the social and emotional support they needed varied by disability status.
- Adults without disability (78.6%) were more likely than adults with disability (65.5%) to always or usually receive the social and emotional support they needed (Figure 5).
Figure 5. Percentage of adults who always or usually received the social and emotional support they needed, by disability status: United States, July–December 2020
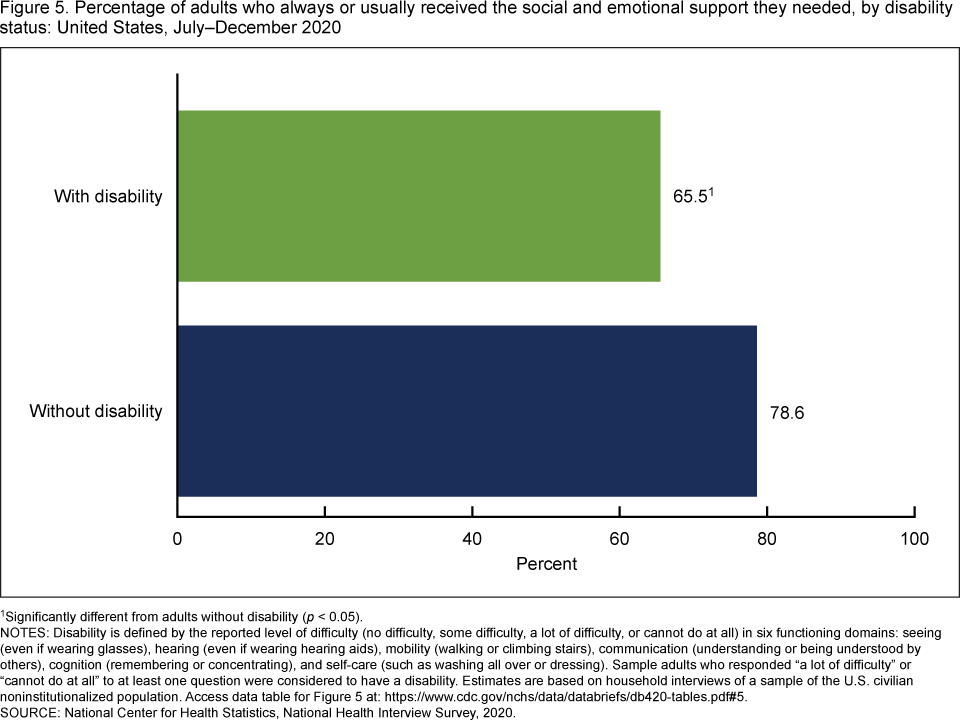
1Significantly different from adults without disability (p < 0.05).
NOTES: Disability is defined by the reported level of difficulty (no difficulty, some difficulty, a lot of difficulty, or cannot do at all) in six functioning domains: seeing (even if wearing glasses), hearing (even if wearing hearing aids), mobility (walking or climbing stairs), communication (understanding or being understood by others), cognition (remembering or concentrating), and self-care (such as washing all over or dressing). Sample adults who responded “a lot of difficulty” or “cannot do at all” to at least one question were considered to have a disability. Estimates are based on household interviews of a sample of the U.S. civilian noninstitutionalized population. Access data table for Figure 5.
SOURCE: National Center for Health Statistics, National Health Interview Survey, 2020.
Summary
During July–December 2020, more than 3 in 4 adults (77.5%) indicated that they always or usually had the social and emotional support they needed. However, the percentage of adults with this level of perceived support varied by selected characteristics. Lower levels of social and emotional support were identified among Hispanic, non-Hispanic black, and non-Hispanic Asian adults; adults neither married nor living with a partner; adults without another adult in the home; adults with less than a high school education; and adults with disability.
While most adults always or usually had the emotional support they needed, 1 in 10 adults rarely or never received the social and emotional support they needed. The National Academies of Sciences, Engineering, and Medicine reported on social isolation and loneliness in older adults and proposed a series of recommendations for addressing social isolation (1). One recommendation was to improve awareness by including measures of social isolation and loneliness in health surveys such as NHIS. NHIS estimates on social and emotional support, which began being collected in July 2020, may help to describe the distribution of perceived social and emotional support across many subgroups.
Definitions
Social and emotional support: Estimates are based on responses to the question, “How often do you get the social and emotional support you need? Would you say always, usually, sometimes, rarely, or never?”
Family income: Based on the ratio of a family’s income in the previous calendar year to the appropriate poverty threshold (given family size and number of children) defined by the U.S. Census Bureau. Imputed income files were used to allow for imputed values when family income was not provided.
Race and Hispanic origin: Categories shown for non-Hispanic adults are only for those who selected one racial group; respondents had the option to select more than one racial group. Adults categorized as Hispanic may be of any race or combination of races.
Data source and methods
NHIS is a nationally representative household survey of the U.S. civilian noninstitutionalized population. It is conducted continuously throughout the year by the National Center for Health Statistics (NCHS). Interviews are typically conducted in respondents’ homes, but follow-ups to complete interviews may be conducted over the telephone. Due to the COVID-19 pandemic, data collection procedures in 2020 were disrupted, and from July to December, interviews were attempted by telephone first with follow-ups to complete interviews by personal visit. Questions on perceived social and emotional support were added to NHIS in July 2020. Data from the July–December 2020 NHIS were used for this analysis, resulting in estimates representative of the U.S. civilian population in July–December 2020 rather than the full 2020 calendar year. For more information about changes to NHIS in 2020 and general information about NHIS, visit: https://www.cdc.gov/nchs/nhis.htm.
Point estimates and corresponding variances were calculated using SAS-callable SUDAAN software (7) to account for the complex sample design of NHIS. All estimates meet NCHS standards of reliability (8). Differences between percentages were evaluated using two-sided significance tests at the 0.05 level. Tests for trends were evaluated using orthogonal polynomials in logistic regression.
About the authors
Peter Boersma and Anjel Vahratian are with the National Center for Health Statistics, Division of Health Interview Statistics.
References
- National Academies of Sciences, Engineering, and Medicine. Social isolation and loneliness in older adults: Opportunities for the health care System. Washington, DC: The National Academies Press. 2020. DOI: https://doi.org/10.17226/25663.
- Holt-Lunstad J, Smith TB, Layton JB. Social relationships and mortality risk: A meta-analytic review. PLoS Med 7(7):e1000316. 2010.
- Reblin M, Uchino BN. Social and emotional support and its implication for health. Curr Opin Psychiatry 21(2):201–5. 2008.
- Siedlecki KL, Salthouse TA, Oishi S, Jeswani S. The relationship between social support and subjective well-being across age. Soc Indic Res 117(2):561–76. 2014.
- Escalante E, Golden RL, Mason DJ. Social isolation and loneliness: Imperatives for health care in a post-COVID world. JAMA 325(6):520–1. 2021.
- AARP Foundation and United Health Foundation. The pandemic effect: A social isolation report [PDF – 1.17 MB]. 2020.
- RTI International. SUDAAN (Release 11.0.3) [computer software]. 2018.
- Parker JD, Talih M, Malec DJ, Beresovsky B, Carroll M, Gonzalez Jr. JF, et al. National Center for Health Statistics data presentation standards for proportions. National Center for Health Statistics. Vital Health Stat 2(175). 2017.
Suggested citation
Boersma P, Vahratian A. Perceived social and emotional support among adults: United States, July–December 2020. NCHS Data Brief, no 420. Hyattsville, MD: National Center for Health Statistics. 2021. DOI: https://dx.doi.org/10.15620/cdc:110092.
Copyright information
All material appearing in this report is in the public domain and may be reproduced or copied without permission; citation as to source, however, is appreciated.
National Center for Health Statistics
Brian C. Moyer, Ph.D., Director
Amy M. Branum, Ph.D., Associate Director for Science
Division of Health Interview Statistics
Stephen J. Blumberg, Ph.D., Director
Anjel Vahratian, Ph.D., M.P.H., Associate Director for Science