Mental Health Treatment Among Adults: United States, 2020
NCHS Data Brief No. 419, October 2021
PDF Version (422KB)
- Key findings
- The percentage of adults who had received any mental health treatment varied by age group.
- Women were more likely than men to have received any mental health treatment.
- The percentage who had received any mental health treatment was highest among non-Hispanic white adults.
- The percentage of adults who had received mental health treatment varied by urbanization level.
- Summary
Data from the National Health Interview Survey
- In 2020, 20.3% of adults had received any mental health treatment in the past 12 months, including 16.5% who had taken prescription medication for their mental health and 10.1% who received counseling or therapy from a mental health professional.
- Women were more likely than men to have received any mental health treatment.
- Non-Hispanic white adults (24.4%) were more likely than non-Hispanic black (15.3%), Hispanic (12.6%), and non-Hispanic Asian (7.7%) adults to have received any mental health treatment.
- Overall, as the level of urbanization decreased, the percentage of adults who had taken medication for their mental health increased, and the percentage who had received counseling or therapy decreased.
In 2019, 19.2% of adults had received any mental health treatment in the past 12 months, including 15.8% who had taken prescription medication for their mental health and 9.5% who received counseling or therapy from a mental health professional (1). A recent study showed that symptoms of anxiety and depression among adults increased during 2020 (2). This report describes the percentage of U.S. adults who have taken prescription medication for their mental health or have received counseling or therapy from a mental health professional in the past 12 months by select characteristics, based on data from the 2020 National Health Interview Survey (NHIS). Estimates are also presented for any mental health treatment, defined as having taken medication for mental health, received counseling or therapy, or both in the past 12 months.
Key words: medication, counseling and therapy, National Health Interview Survey (NHIS)
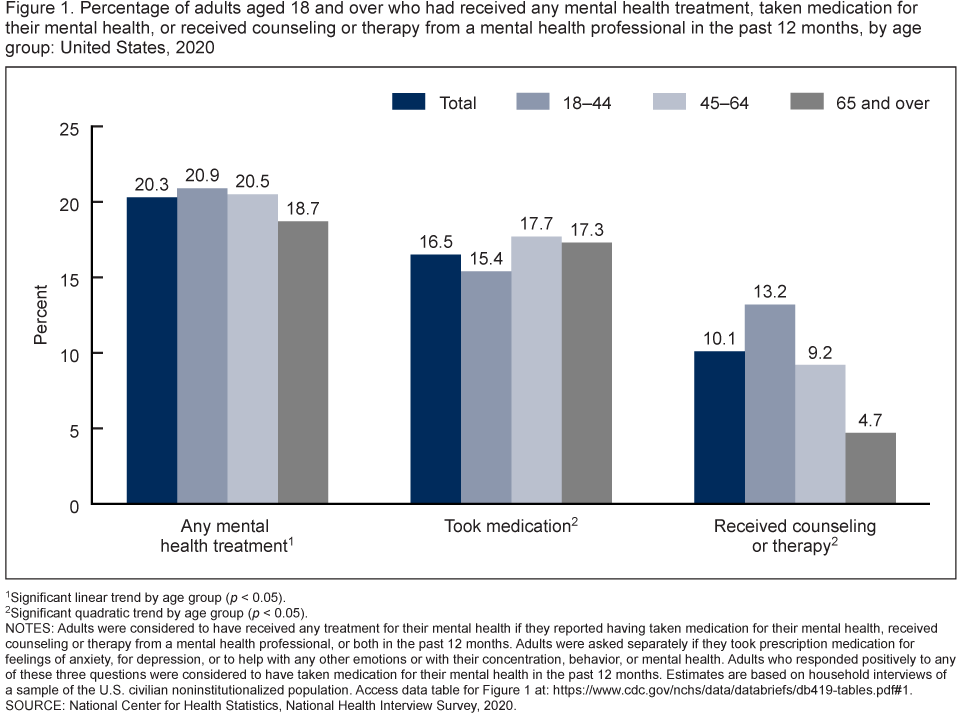
The percentage of adults who had received any mental health treatment varied by age group.
- In 2020, 20.3% of adults had received any mental health treatment in the past 12 months, including 16.5% who had taken medication for their mental health, and 10.1% who received counseling or therapy from a mental health professional (Figure 1).
- The percentage of adults who had received any mental health treatment in the past 12 months decreased with age, from 20.9% among those aged 18–44 to 20.5% among those aged 45–64 to 18.7% among those aged 65 and over.
- The percentage of adults who had taken medication for their mental health in the past 12 months was higher among those aged 45–64 (17.7%) and 65 and over (17.3%), compared with those aged 18–44 (15.4%).
- The percentage of adults who had received counseling or therapy from a mental health professional in the past 12 months decreased with age, from 13.2% among those aged 18–44 to 9.2% among those aged 45–64 to 4.7% among those aged 65 and over.
Figure 1.Percentage of adults aged 18 and over who had received any mental health treatment, taken medication for their mental health, or received counseling or therapy from a mental health professional in the past 12 months, by age group: United States, 2020
1Significant linear trend by age group (p < 0.05).
2Significant quadratic trend by age (p < 0.05).
NOTES: Adults were considered to have received any treatment for their mental health if they reported having taken medication for their mental health, received counseling or therapy from a mental health professional, or both in the past 12 months. Adults were asked separately if they took prescription medication for feelings of anxiety, for depression, or to help with any other emotions or with their concentration, behavior, or mental health. Adults who responded positively to any of these three questions were considered to have taken medication for their mental health in the past 12 months. Estimates are based on household interviews of a sample of the U.S. civilian noninstitutionalized population. Access data table for Figure 1.
SOURCE: National Center for Health Statistics, National Health Interview Survey, 2020.
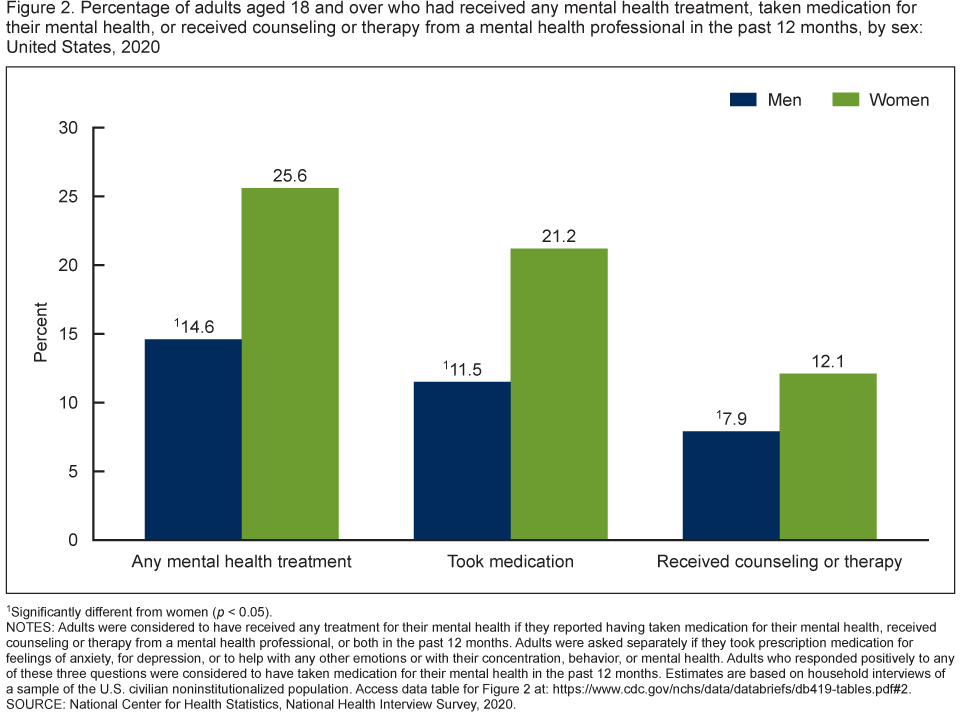
Women were more likely than men to have received any mental health treatment.
- A little over one in four women (25.6%) received any mental health treatment in the past 12 months, compared with 14.6% of men (Figure 2).
- Women were more likely than men to have taken medication for their mental health (21.2% and 11.5%, respectively) and to have received counseling or therapy from a mental health professional (12.1% and 7.9%, respectively) in the past 12 months.
Figure 2. Percentage of adults aged 18 and over who had received any mental health treatment, taken medication for their mental health, or received counseling or therapy from a mental health professional in the past 12 months, by sex: United States, 2020
1Significantly different from women (p < 0.05).
NOTES: Adults were considered to have received any treatment for their mental health if they reported having taken medication for their mental health, received counseling or therapy from a mental health professional, or both in the past 12 months. Adults were asked separately if they took prescription medication for feelings of anxiety, for depression, or to help with any other emotions or with their concentration, behavior, or mental health. Adults who responded positively to any of these three questions were considered to have taken medication for their mental health in the past 12 months. Estimates are based on household interviews of a sample of the U.S. civilian noninstitutionalized population. Access data table for Figure 2.
SOURCE: National Center for Health Statistics, National Health Interview Survey, 2020.
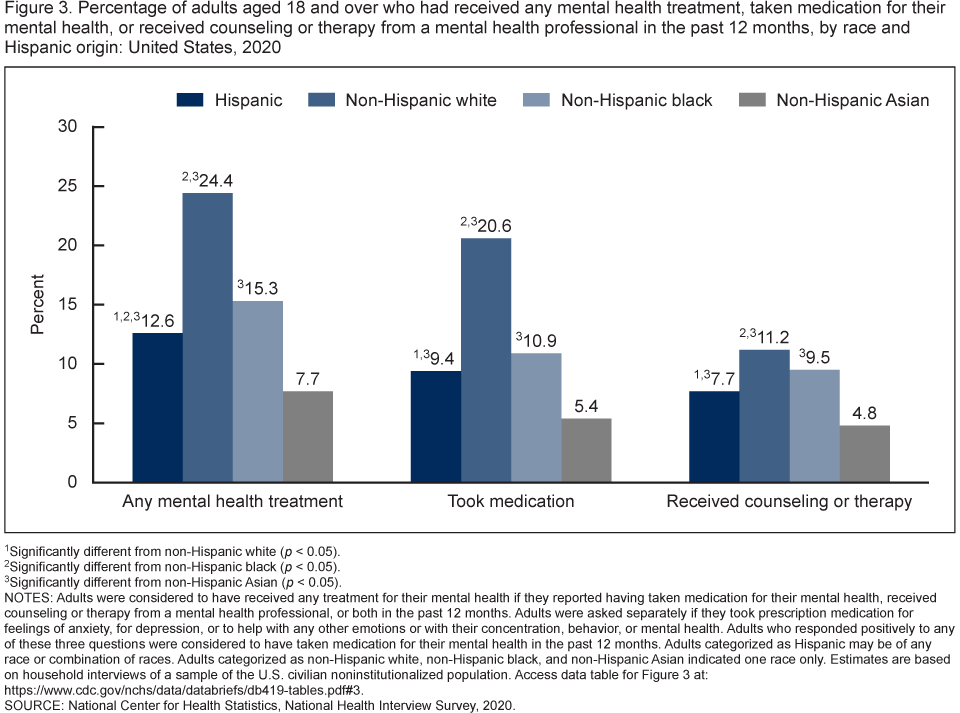
The percentage who had received any mental health treatment was highest among non-Hispanic white adults.
- Non-Hispanic white adults were most likely to have received any mental health treatment in the past 12 months (24.4%), followed by non-Hispanic black (15.3%), Hispanic (12.6%), and non-Hispanic Asian (7.7%) adults (Figure 3).
- Non-Hispanic white adults (20.6%) were most likely and non-Hispanic Asian adults (5.4%) were least likely to have taken medication for their mental health compared with the other race and Hispanic-origin groups.
- Non-Hispanic white adults (11.2%) were most likely and non-Hispanic Asian adults (4.8%) were least likely to have received counseling or therapy from a mental health professional compared with the other race and Hispanic-origin groups.
Figure 3. Percentage of adults aged 18 and over who had received any mental health treatment, taken medication for their mental health, or received counseling or therapy from a mental health professional in the past 12 months, by race and Hispanic origin: United States, 2020
1Significantly different from non-Hispanic white (p < 0.05).
2Significantly different from non-Hispanic black (p < 0.05).
3Significantly different from non-Hispanic Asian (p < 0.05).
NOTES: Adults were considered to have received any treatment for their mental health if they reported having taken medication for their mental health, received counseling or therapy from a mental health professional, or both in the past 12 months. Adults were asked separately if they took prescription medication for feelings of anxiety, for depression, or to help with any other emotions or with their concentration, behavior, or mental health. Adults who responded positively to any of these three questions were considered to have taken medication for their mental health in the past 12 months. Adults categorized as Hispanic may be of any race or combination of races. Adults categorized as non-Hispanic white, non-Hispanic black, and non-Hispanic Asian indicated one race only. Estimates are based on household interviews of a sample of the U.S. civilian noninstitutionalized population. Access data table for Figure 3.
SOURCE: National Center for Health Statistics, National Health Interview Survey, 2020.
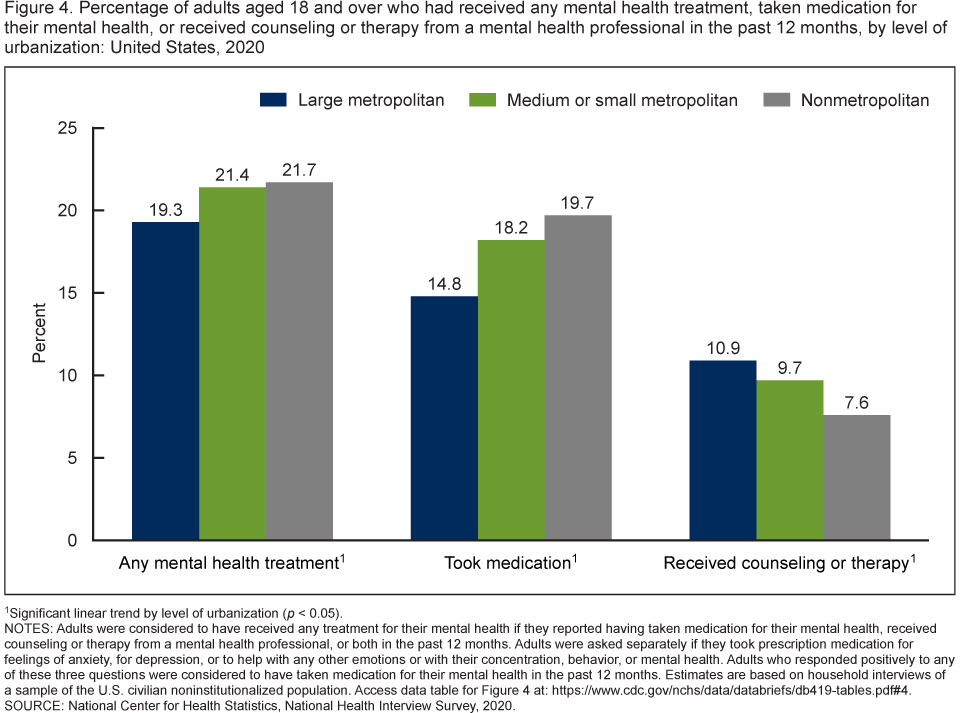
The percentage of adults who had received mental health treatment varied by urbanization level.
- The percentage of adults who had received any mental health treatment in the past 12 months increased as the place of residence became more rural, from 19.3% among those living in large metropolitan areas to 21.7% among those living in nonmetropolitan areas (Figure 4).
- The percentage of adults who had taken medication for their mental health also increased as the place of residence became more rural, from 14.8% among those living in large metropolitan areas to 19.7% among those living in nonmetropolitan areas.
- The percentage of adults who received counseling or therapy from a mental health professional in the past 12 months decreased as the place of residence became more rural, from 10.9% among those living in large metropolitan areas to 7.6% among those living in nonmetropolitan areas.
Figure 4. Percentage of adults aged 18 and over who had received any mental health treatment, taken medication for their mental health, or received counseling or therapy from a mental health professional in the past 12 months, by level of urbanization: United States, 2020
1Significant linear trend by level of urbanization (p < 0.05).
NOTES: Adults were considered to have received any treatment for their mental health if they reported having taken medication for their mental health, received counseling or therapy from a mental health professional, or both in the past 12 months. Adults were asked separately if they took prescription medication for feelings of anxiety, for depression, or to help with any other emotions or with their concentration, behavior, or mental health. Adults who responded positively to any of these three questions were considered to have taken medication for their mental health in the past 12 months. Estimates are based on household interviews of a sample of the U.S. civilian noninstitutionalized population. Access data table for Figure 4.
SOURCE: National Center for Health Statistics, National Health Interview Survey, 2020.
Summary
In 2020, 20.3% of U.S. adults received any mental health treatment in the past 12 months, including 16.5% who had taken prescription medication for their mental health and 10.1% who had received counseling or therapy from a mental health professional. While the percentage of adults who had taken medication for their mental health increased with age, the percentage who had received counseling or therapy decreased with age.
Women were more likely than men to have received any treatment for their mental health, consistent with the higher prevalence of common mental health conditions, such as anxiety and depression, seen among women (3) as well as an increased willingness to seek out mental health care (4). Receipt of any mental health treatment was higher among non-Hispanic white adults compared with Hispanic, non-Hispanic black, and non-Hispanic Asian adults. While the percentage of adults who had received counseling or therapy decreased as level of urbanization decreased, the percentage who had taken medication for their mental health increased with decreasing urbanization level.
Definitions
Any mental health treatment, past 12 months: A composite measure of adults who reported having taken medication for their mental health, received counseling or therapy from a mental health professional, or both in the past 12 months.
Race and Hispanic origin: Adults categorized as Hispanic may be of any race or combination of races. Adults categorized as non-Hispanic white, non-Hispanic black, and non-Hispanic Asian indicated one race only.
Received counseling or therapy, past 12 months: Based on a positive response to the question, “During the past 12 months, did you receive counseling or therapy from a mental health professional such as a psychiatrist, psychologist, psychiatric nurse, or clinical social worker?”
Taken medication for mental health, past 12 months: Sample adults were asked how often they felt worried, nervous, or anxious, followed by the question, “Do you take prescription medication for these feelings?” They were also asked how often they felt depressed, followed by, “Do you take prescription medication for depression?” Those who answered that they did not take medication for feelings of either anxiety or depression (or who did not know or refused to answer these two questions) were later asked, “During the past 12 months, did you take prescription medication to help you with any other emotions or with your concentration, behavior, or mental health?” Adults who responded positively to any of these three questions were considered to have taken medication for their mental health in the past 12 months.
Urbanization level: Metropolitan size and status was determined using the 2013 NCHS urban-rural classification scheme for counties (5), by merging the geographic federal information processing standard (FIPS) codes for the county of household residence with the county-level FIPS codes from the classification scheme’s data set. Large metropolitan includes large central and large fringe metropolitan counties. Medium or small metropolitan includes medium and small metropolitan counties. Nonmetropolitan includes micropolitan and noncore counties.
Data source and methods
Data from the 2020 NHIS were used for this analysis. NHIS is a nationally representative household survey of the U.S. civilian noninstitutionalized population. It is conducted continuously throughout the year by the National Center for Health Statistics (NCHS). Interviews are typically conducted in respondents’ homes, but follow-ups to complete interviews may be conducted over the telephone. Due to the COVID-19 pandemic, data collection procedures in 2020 were disrupted, and from July to December, interviews were attempted by telephone first with follow-ups to complete interviews by personal visit. For more information about the impact of these changes on the 2020 data and general information about NHIS, visit https://www.cdc.gov/nchs/nhis.htm.
Point estimates and the corresponding confidence intervals for this analysis were calculated using SAS-callable SUDAAN software (6) to account for the complex sample design of NHIS. Differences between percentages were evaluated using two-sided significance tests at the 0.05 level. Trends by age group and urbanization level were evaluated using orthogonal polynomials in logistic regression. All estimates meet NCHS data presentation standards for proportions (7).
About the authors
Emily Terlizzi and Tina Norris are with the National Center for Health Statistics, Division of Health Interview Statistics.
References
- Terlizzi EP, Zablotsky B. Mental health treatment among adults: United States, 2019. NCHS Data Brief, no 380. Hyattsville, MD: National Center for Health Statistics. 2020.
- Vahratian A, Blumberg SJ, Terlizzi EP, Schiller JS. Symptoms of anxiety or depressive disorder and use of mental health care among adults during the COVID-19 pandemic—United States, August 2020–February 2021. MMWR Morb Mortal Wkly Rep 70(13):490–4. 2021.
- Eaton NR, Keyes KM, Krueger RF, Balsis S, Skodol AE, Markon KE, et al. An invariant dimensional liability model of gender differences in mental disorder prevalence: Evidence from a national sample. J Abnorm Psychol 121(1):282–8. 2012.
- MacKenzie CS, Gekoski WL, Knox VJ. Age, gender, and the underutilization of mental health services: The influence of help-seeking attitudes. Aging Ment Health 10(6):574–82. 2006.
- Ingram DD, Franco SJ. 2013 NCHS urban–rural classification scheme for counties. National Center for Health Statistics. Vital Health Stat 2(166). 2014.
- RTI International. SUDAAN (Release 11.0.3) [computer software]. 2018.
- Parker JD, Talih M, Malec DJ, Beresovsky V, Carroll M, Gonzalez Jr. JF, et al. National Center for Health Statistics data presentation standards for proportions. National Center for Health Statistics. Vital Health Stat 2(175). 2017.
Suggested citation
Terlizzi EP, Norris T. Mental health treatment among adults: United States, 2020. NCHS Data Brief, no 419. Hyattsville, MD: National Center for Health Statistics. 2021. DOI: https://dx.doi.org/10.15620/cdc:110593.
Copyright information
All material appearing in this report is in the public domain and may be reproduced or copied without permission; citation as to source, however, is appreciated.
National Center for Health Statistics
Brian C. Moyer, Ph.D., Director
Amy M. Branum, Ph.D., Associate Director for Science
Division of Health Interview Statistics
Stephen J. Blumberg, Ph.D., Director
Anjel Vahratian, Ph.D., M.P.H., Associate Director for Science