Urban-rural Differences in Dental Care Use Among Adults Aged 18−64
NCHS Data Brief No. 412, July 2021
PDF Version (1,094 KB) | Visual Abstract
Amy E. Cha, Ph.D., M.P.H., and Robin A. Cohen, Ph.D.
- Key findings
- In 2019, the percentage of adults aged 18−64 with a dental visit in the past 12 months was higher among those residing in urban areas than rural areas.
- In both urban and rural areas, the percentage of adults aged 18−64 who had a dental visit in the past 12 months was higher among women than men.
- In both urban and rural areas, the percentage of adults who had a dental visit in the past 12 months was higher among non-Hispanic white adults than Hispanic adults.
- In both urban and rural areas, the percentage of adults who had a dental visit in the past 12 months increased as family income as a percentage of the federal poverty level increased.
- Summary
Data from the National Health Interview Survey
- In 2019, 65.5% of adults aged 18−64 had a dental visit in the past 12 months.
- The percentage of adults who had a dental visit was higher among those residing in urban areas (66.7%) than those in rural areas (57.6%).
- In both urban and rural areas, women were more likely than men to have had a dental visit in the past 12 months.
- In urban areas, non-Hispanic white adults (70.2%) were more likely than Hispanic (59.4%) and non-Hispanic black (61.8%) adults to have a dental visit. In rural areas, non-Hispanic white adults (59.1%) were more likely than Hispanic adults (45.7%) to have a dental visit.
- The percentage of adults who had a dental visit increased as family income, as a percentage of the federal poverty level, increased in both urban and rural areas.
Regular dental care can lower the risk for oral diseases, and studies have shown a connection between oral health and general health (1,2). However, in 2019 about 35% of adults aged 18 and over did not have a dental examination or cleaning (3). It has been shown that disparities exist in access and use of dental care, especially between rural and urban areas (4,5). In this report, urban-rural differences in dental care use, defined as a dental visit in the past 12 months, were examined among adults aged 18−64 by demographic characteristics.
Keywords: urbanization, dental care, National Health Interview Survey
In 2019, the percentage of adults aged 18−64 with a dental visit in the past 12 months was higher among those residing in urban areas than rural areas.
- Overall, 65.5% of adults aged 18−64 had a dental visit in the past 12 months (Figure 1).
- Adults residing in urban areas (66.7%) were more likely to have a dental visit than those residing in rural areas (57.6%).
Figure 1. Percentage of adults aged 18−64 with a dental visit in the past 12 months, by urbanicity: United States, 2019
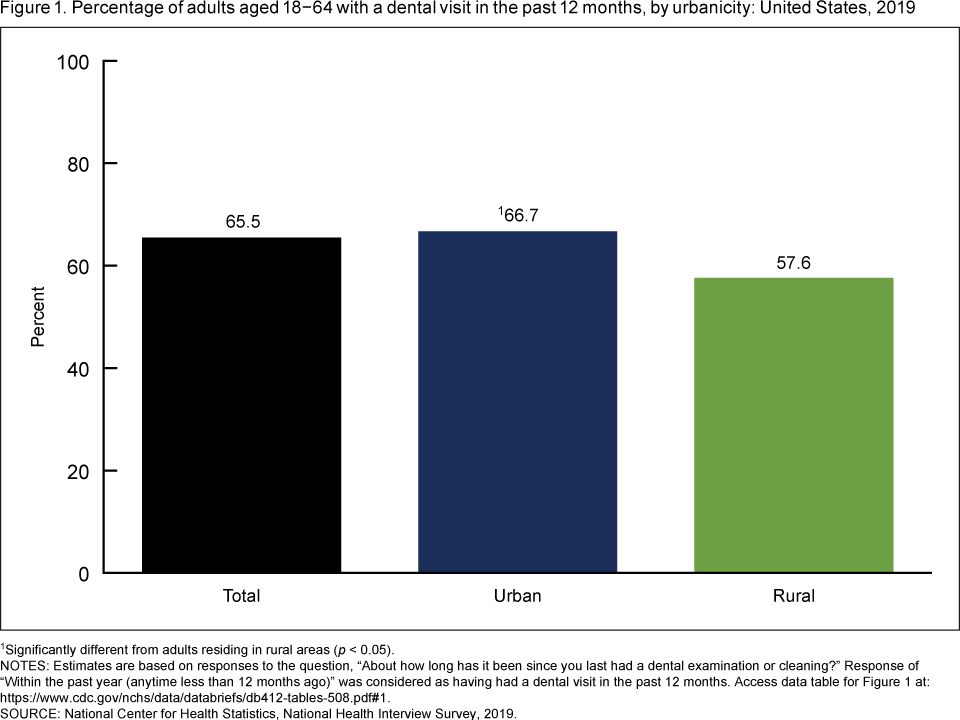
1Significantly different from adults residing in rural areas (p < 0.05).
NOTES: Estimates are based on responses to the question, “About how long has it been since you last had a dental examination or cleaning?” Response of “Within the past year (anytime less than 12 months ago)” was considered as having had a dental visit in the past 12 months. Access data table for Figure 1.
SOURCE: National Center for Health Statistics, National Health Interview Survey, 2019.
In both urban and rural areas, the percentage of adults aged 18−64 who had a dental visit in the past 12 months was higher among women than men.
- In urban areas, women (70.5%) were more likely than men (62.7%) to have a dental visit in the past 12 months (Figure 2).
- Similarly, in rural areas, women (61.4%) were more likely than men (53.5%) to have a dental visit.
- Among men, the percentage of adults that had a dental visit was higher among those residing in urban areas than those in rural areas. The same pattern was observed for women.
Figure 2. Percentage of adults aged 18−64 with a dental visit in the past 12 months, by urbanicity and sex: United States, 2019
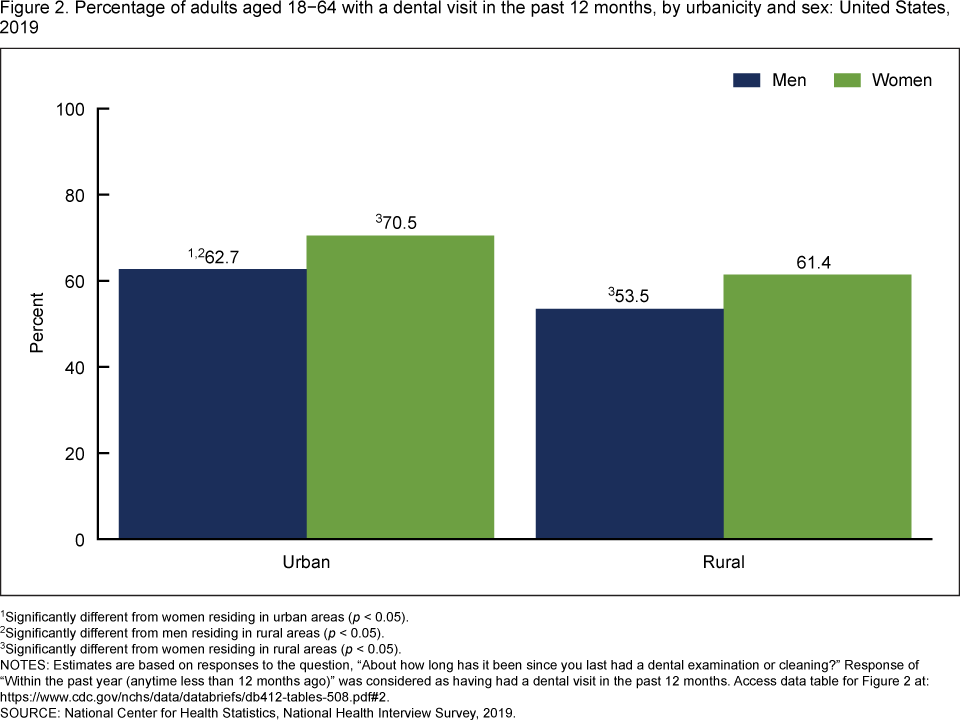
1Significantly different from women residing in urban areas (p < 0.05).
2Significantly different from men residing in rural areas (p < 0.05).
3Significantly different from women residing in rural areas (p < 0.05).
NOTES: Estimates are based on responses to the question, “About how long has it been since you last had a dental examination or cleaning?” Response of “Within the past year (anytime less than 12 months ago)” was considered as having had a dental visit in the past 12 months. Access data table for Figure 2.
SOURCE: National Center for Health Statistics, National Health Interview Survey, 2019.
In both urban and rural areas, the percentage of adults who had a dental visit in the past 12 months was higher among non-Hispanic white adults than Hispanic adults.
- Among adults aged 18−64 residing in urban areas, non-Hispanic white adults (70.2%) were more likely than Hispanic (59.4%) and non-Hispanic black (61.8%) adults to have a dental visit in the past 12 months (Figure 3).
- Among rural area residents, non-Hispanic white adults (59.1%) were more likely than Hispanic adults (45.7%) to have a dental visit.
- The percentage of adults who had a dental visit was significantly higher among those residing in urban areas than those residing in rural areas for both Hispanic and non-Hispanic white adults, but the observed urban-rural difference for non-Hispanic black adults was not significant.
Figure 3. Percentage of adults aged 18−64 with a dental visit in the past 12 months, by urbanicity and race and ethnicity: United States, 2019
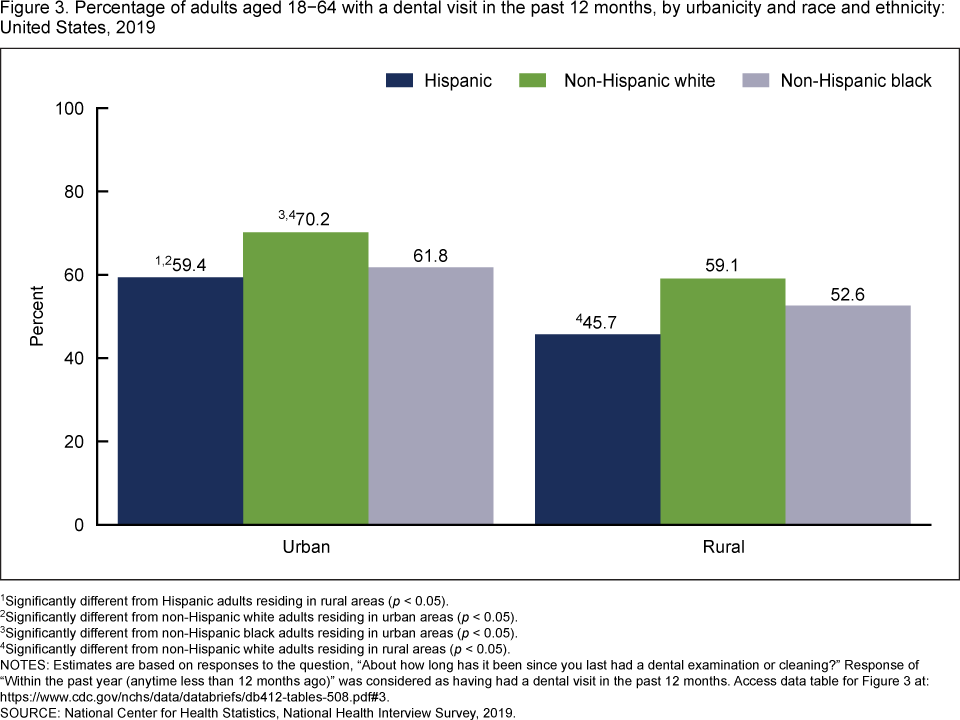
1Significantly different from Hispanic adults residing in rural areas (p < 0.05).
2Significantly different from non-Hispanic white adults residing in urban areas (p < 0.05).
3Significantly different from non-Hispanic black adults residing in urban areas (p < 0.05).
4Significantly different from non-Hispanic white adults residing in rural areas (p < 0.05).
NOTES: Estimates are based on responses to the question, “About how long has it been since you last had a dental examination or cleaning?” Response of “Within the past year (anytime less than 12 months ago)” was considered as having had a dental visit in the past 12 months. Access data table for Figure 3.
SOURCE: National Center for Health Statistics, National Health Interview Survey, 2019.
In both urban and rural areas, the percentage of adults who had a dental visit in the past 12 months increased as family income as a percentage of the federal poverty level increased.
- Among adults who reside in urban areas, the percentage of adults aged 18−64 who had a dental visit in the past 12 months increased as family income increased from less than 139% of the federal poverty level (FPL) (50.4%) to greater than 400% of the FPL (79.3%) (Figure 4).
- Similarly, the percentage of adults who reside in rural areas and had a dental visit increased as family income increased from less than 139% of the FPL (42.6%) to greater than 400% of the FPL (74.2%).
- The percentage of adults with a dental visit was significantly higher among those residing in urban areas than those residing in rural areas for those with family income less than 139% of the FPL, greater than 250% to less than or equal to 400% of the FPL, and greater than 400% of the FPL.
Figure 4. Percentage of adults aged 18−64 with a dental visit in the past 12 months, by urbanicity and family income as a percentage of the federal poverty level: United States, 2019
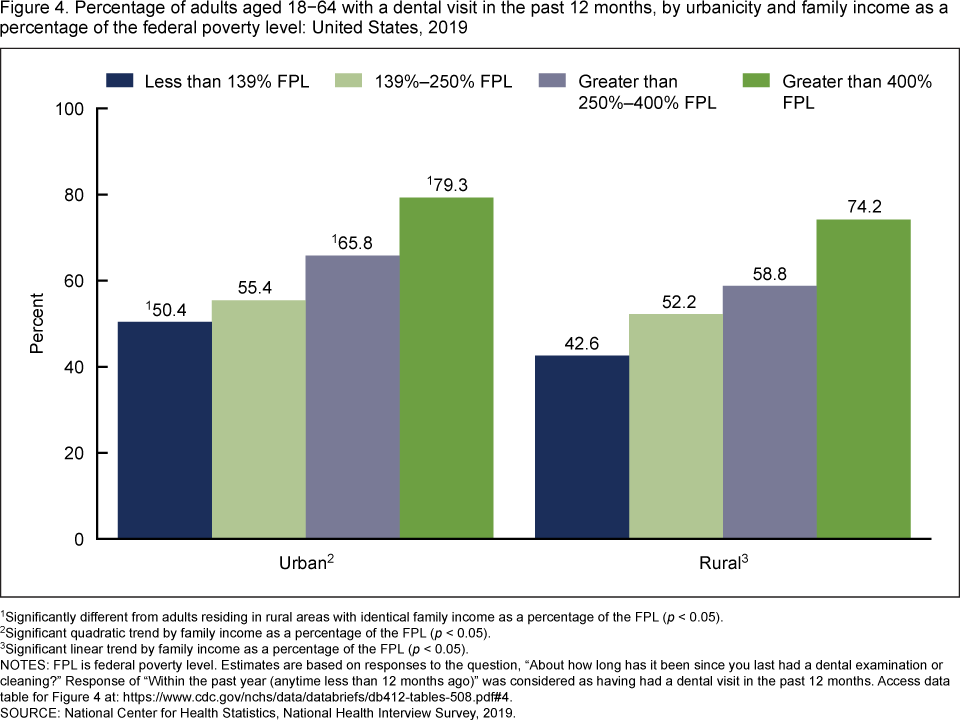
1Significantly different from adults residing in rural areas with identical family income as a percentage of the FPL (p < 0.05).
2Significant quadratic trend by family income as a percentage of the FPL (p < 0.05).
3Significant linear trend by family income as a percentage of the FPL (p < 0.05).
NOTES: FPL is federal poverty level. Estimates are based on responses to the question, “About how long has it been since you last had a dental examination or cleaning?” Response of “Within the past year (anytime less than 12 months ago)” was considered as having had a dental visit in the past 12 months. Access data table for Figure 4.
SOURCE: National Center for Health Statistics, National Health Interview Survey, 2019.
Summary
This report examined urban-rural differences in dental care use among adults aged 18−64. It has been reported that residents in rural areas were less likely to receive preventive services and more likely to receive restorative and oral surgery services than those residing in urban areas (4,5). In 2019, 66.7% of adults residing in urban areas and 57.6% of adults residing in rural areas had a dental visit in the past 12 months. In both urban and rural areas, a higher percentage of women had a dental visit than men. In urban areas, a higher percentage of non-Hispanic white adults had a dental visit than Hispanic or non-Hispanic black adults. In rural areas, non-Hispanic white adults were more likely than Hispanic adults to have a dental visit. In both urban and rural areas, the percentage of adults with a dental visit increased with family income as a percentage of the FPL. The percentage of adults who had a dental visit was higher in urban areas than rural areas for all adults except for those with family income between 139% and 250% of the FPL.
Previous studies have shown that persons living in rural areas were less likely to have a preventive dental visit, but more likely to seek emergency dental treatment than those residing in urban areas (4,5). The lower percentage of dental care use in rural areas may be attributed to the lower density of dental care providers in these areas (4).
Definitions
Dental visit in the past 12 months: Estimates are based on responses to the question, “About how long has it been since you last had a dental examination or cleaning?” Response of “Within the past year (anytime less than 12 months ago)” was considered as having had dental visit in the past 12 months.
Family income as a percentage of the FPL: Estimates are based on the federal poverty level which was derived from family income and family size using the U.S. Census Bureau’s poverty thresholds for the previous calendar year (6). Adults were categorized into four groups based on their family income: less than 139% of the FPL, 139% to less than or equal to 250% of the FPL, more than 250% to less than or equal to 400% of the FPL, and greater than 400% of the FPL. The 2019 National Health Interview Survey (NHIS) imputed income files were used to create the poverty levels (7).
Race and ethnicity: Categories shown for non-Hispanic respondents are only for those who selected one racial group; respondents had the option to select more than one racial group. Hispanic respondents may be of any race or combination of races. Only selected groups are shown in the individual race and ethnicity bars. In this report, estimates are not shown separately for adults who were non-Hispanic Asian and non-Hispanic mixed or other races due to limitations of sample size but are included in the totals.
Urbanicity: Urbanicity was categorized using the 2013 NCHS Urban-Rural Classification Scheme for Counties (8) into two categories: urban (large central metropolitan, large fringe metropolitan, and medium and small metropolitan counties) and rural (counties in micropolitan statistical areas and nonmetropolitan counties).
Data source and methods
Data from the 2019 NHIS was used for this analysis. NHIS is a nationally representative household survey of the U.S. civilian noninstitutionalized population. The survey is conducted continuously throughout the year by the National Center for Health Statistics (NCHS). Interviews are conducted in the respondents’ homes, but follow-ups to complete interviews may be conducted by telephone when necessary. Information on dental visits was collected during the Sample Adult interview. For more information about NHIS, visit: https://www.cdc.gov/nchs/nhis.htm.
Point estimates and the corresponding variances were calculated using SAS-callable SUDAAN software (9) to account for the complex sample design of NHIS. All estimates in this report met NCHS standards of reliability as specified in “National Center for Health Statistics Data Presentation Standards for Proportions” (10). Tests for trends were evaluated using orthogonal polynomials in logistic regression. Differences between percentages were evaluated using two-sided significance tests at the 0.05 level.
About the authors
Amy E. Cha and Robin A. Cohen are with the NCHS Division of Health Interview Statistics.
References
- U.S. Department of Health and Human Services. Oral health. 2021.
- Bensley L, VanEenwyk J, Ossiander EM. Associations of self-reported periodontal disease with metabolic syndrome and number of self-reported chronic conditions. Prev Chronic Dis 8(3):A50. 2011.
- National Center for Health Statistics. Percentage of having a dental exam or cleaning in the past 12 months for adults aged 18 and over, United States, 2019. National Health Interview Survey. Generated interactively: April 22, 2021.
- Khan A, Thapa JR, Zhang D. Preventive dental checkups and their association with access to usual source of care among rural and urban adult residents. J Rural Health 33:419–26. 2017.
- Luo H, Wu Q, Bell R, Wright WG, Garcia RI, Quandt SA. Trends in use of dental care provider types and services in the United States in 2000–2016: Rural-urban comparisons. J Am Dent Assoc 151(8):596–606. 2020.
- United States Census Bureau. Poverty thresholds. 2021.
- National Center for Health Statistics. Multiple imputation of family income in 2019 National Health Interview Survey: Methods. 2020.
- Ingram DD, Franco SJ. 2013 NCHS urban-rural classification scheme for counties. National Center for Health Statistics. Vital Health Stat 2(166). 2014.
- RTI International. SUDAAN (Release 11.0.3) [computer software]. 2018.
- Parker JD, Talih M, Malec DJ, Beresovsky B, Carroll M, Gonzalez Jr. JF, et al. National Center for Health Statistics data presentation standards for proportions. National Center for Health Statistics Vital Health Stat 2(175). 2017.
Suggested citation
Cha AE, Cohen RA. Urban-rural differences in dental care use among adults aged 18−64. NCHS Data Brief, no 412. Hyattsville, MD: National Center for Health Statistics. 2021. DOI: https://dx.doi.org/10.15620/cdc:106856.
Copyright information
All material appearing in this report is in the public domain and may be reproduced or copied without permission; citation as to source, however, is appreciated.
National Center for Health Statistics
Brian C. Moyer, Ph.D., Director
Amy M. Branum, Ph.D., Acting Associate Director for Science
Division of Health Interview Statistics
Stephen J. Blumberg, Ph.D., Director
Anjel Vahratian, Ph.D., M.P.H., Associate Director for Science