Emergency Department Visit Rates for Motor Vehicle Crashes by Selected Characteristics: United States, 2017–2018
This report was revised on December 22, 2022, after errors were found. All 2017–2018 rates for motor vehicle crashes changed by a factor of two. Other revisions include changes to the percentages for missing race and ethnicity and workers’ compensation, that the rate for Hispanic people aged 45 and over is not reliable, and that the difference between rates in the South and Northeast were not statistically different from each other.
NCHS Data Brief No. 410, June 2021
PDF Version (400 KB)
- Key findings
- What were the ED visit rates for motor vehicle crashes, and did they differ by patient age during 2017–2018?
- How did the ED visit rates of motor vehicle crashes differ by patient age and race and ethnicity?
- How did the ED visit rates of motor vehicle crashes differ by primary expected source of payment?
- How did the ED visit rates of motor vehicle crashes differ by region?
- Summary
Data from the National Hospital Ambulatory Medical Care Survey
- In 2017–2018, the overall emergency department (ED) visit rate for motor vehicle crash injuries was 10.7 visits per 1,000 persons.
- The ED visit rate was highest among patients aged 15–24 (18.2) and then declined with age.
- The ED visit rate for non-Hispanic black patients (30.3) was higher than for non-Hispanic white (8.6) and Hispanic (7.5) patients.
- ED visit rates for patients who had Medicaid, no insurance, or workers’ compensation insurance as their primary expected source of payment were higher than for patients who had private insurance or Medicare.
- The ED visit rate for motor vehicle crash injuries at hospitals located in the South was higher than for rates at hospitals in the Midwest and West census regions of the United States.
In 2017–2018, an average of 3.4 million emergency department (ED) visits for motor vehicle crash injuries occurred annually (1,2). Most persons injured or killed in motor vehicle crashes are occupants (3). Medical care costs and productivity losses associated with crash injuries and deaths exceeded $75 billion in 2017 (4). This report presents ED visit rates for motor vehicle crashes by age, race and ethnicity, health insurance status, and census region. Data for this report are from the National Hospital Ambulatory Medical Care Survey (NHAMCS), an annual nationally representative survey of nonfederal, general, and short-stay hospitals (1,2).
Keywords: car accidents, primary expected source of payment, injuries, race and ethnicity, National Hospital Ambulatory Medical Care Survey (NHAMCS)
What were the ED visit rates for motor vehicle crashes, and did they differ by patient age during 2017–2018?
- In 2017–2018, the overall ED visit rate for motor vehicle crashes in the United States was 10.7 visits per 1,000 persons (Figure 1).
- The ED visit rate increased from 8.0 visits per 1,000 persons under age 15 and peaked at 18.2 visits per 1,000 persons aged 15–24. The rate then declined with increasing age, reaching a rate of 6.7 visits per 1,000 persons aged 45 and over.
Figure 1. Emergency department visit rates for motor vehicle crashes, by age group: United States, 2017–2018
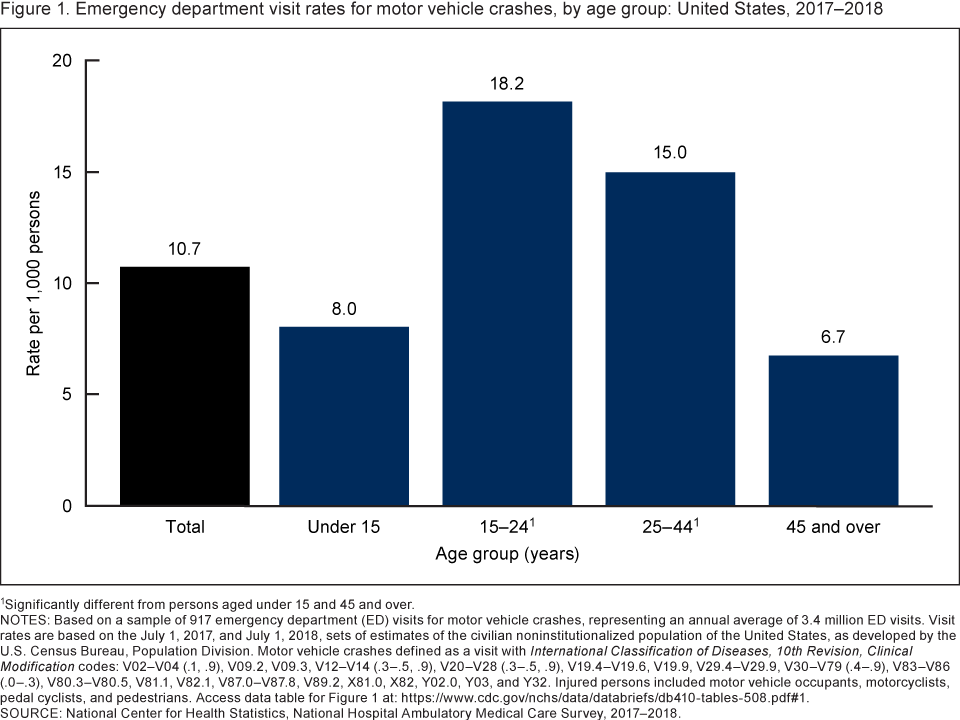
1Significantly different from persons aged under 15 and 45 and over.
NOTES: Based on a sample of 917 emergency department (ED) visits for motor vehicle crashes, representing an annual average of 3.4 million ED visits. Visit rates are based on the July 1, 2017, and July 1, 2018, sets of estimates of the civilian noninstitutionalized population of the United States, as developed by the U.S. Census Bureau, Population Division. Motor vehicle crashes defined as a visit with International Classification of Diseases, 10th Revision, Clinical Modification codes: V02–V04 (.1, .9), V09.2, V09.3, V12–V14 (.3–.5, .9), V20–V28 (.3–.5, .9), V19.4–V19.6, V19.9, V29.4–V29.9, V30–V79 (.4–.9), V83–V86 (.0–.3), V80.3–V80.5, V81.1, V82.1, V87.0–V87.8, V89.2, X81.0, X82, Y02.0, Y03, and Y32. Injured persons included motor vehicle occupants, motorcyclists, pedal cyclists, and pedestrians. Access data table for Figure 1.
SOURCE: National Center for Health Statistics, National Hospital Ambulatory Medical Care Survey, 2017–2018.
How did the ED visit rates of motor vehicle crashes differ by patient age and race and ethnicity?
- The overall ED visit rate for non-Hispanic black patients (30.3 visits per 1,000 persons) was higher than the visit rate for non-Hispanic white (8.6) and Hispanic (7.5) patients (Figure 2).
- The ED visit rate for non-Hispanic black patients was higher than the visit rate for non-Hispanic white and Hispanic patients in all age groups, particularly among patients aged 25–44 (49.1 among non-Hispanic black patients compared with 11.3 among non-Hispanic white and 8.4 among Hispanic patients).
- For persons aged 15–24, the ED visit rate for non-Hispanic white patients (18.4) was higher than the visit rate for Hispanic patients (10.1).
Figure 2. Emergency department visit rates for motor vehicle crashes, by age group and race and ethnicity: United States, 2017–2018
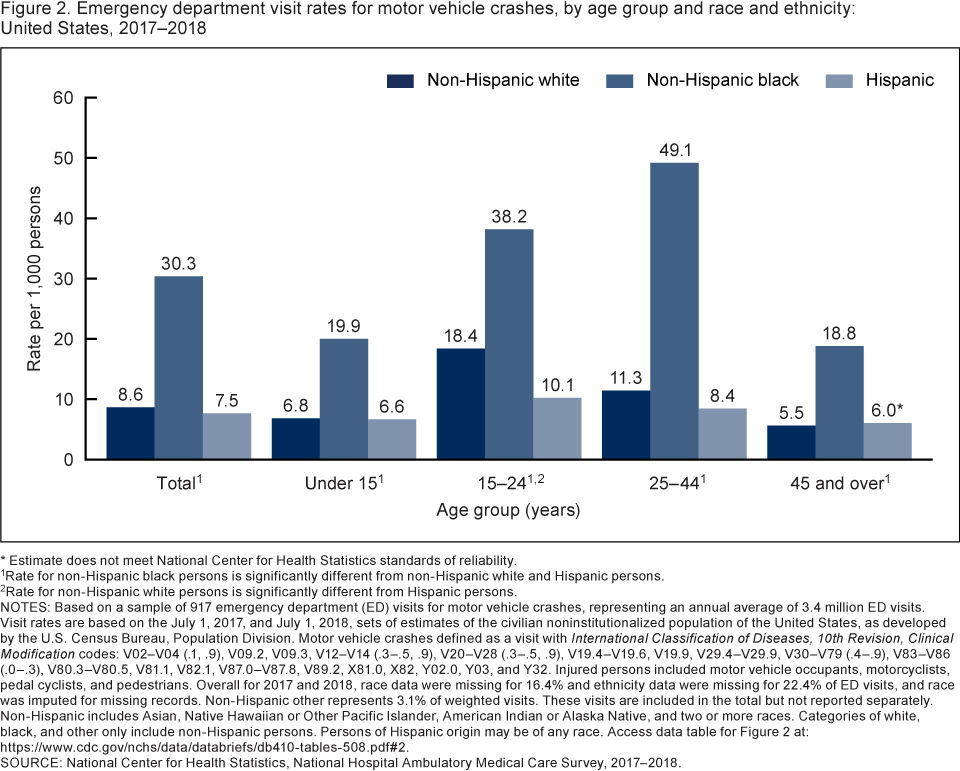
* Estimate does not meet National Center for Health Statistics standards of reliability.
1Rate for non-Hispanic black persons is significantly different from non-Hispanic white and Hispanic persons.
2Rate for non-Hispanic white persons is significantly different from Hispanic persons.
NOTES: Based on a sample of 917 emergency department (ED) visits for motor vehicle crashes, representing an annual average of 3.4 million ED visits. Visit rates are based on the July 1, 2017, and July 1, 2018, sets of estimates of the civilian noninstitutionalized population of the United States, as developed by the U.S. Census Bureau, Population Division. Motor vehicle crashes defined as a visit with International Classification of Diseases, 10th Revision, Clinical Modification codes: V02–V04 (.1, .9), V09.2, V09.3, V12–V14 (.3–.5, .9), V20–V28 (.3–.5, .9), V19.4–V19.6, V19.9, V29.4–V29.9, V30–V79 (.4–.9), V83–V86 (.0–.3), V80.3–V80.5, V81.1, V82.1, V87.0–V87.8, V89.2, X81.0, X82, Y02.0, Y03, and Y32. Injured persons included motor vehicle occupants, motorcyclists, pedal cyclists, and pedestrians. Overall for 2017 and 2018, race data were missing for 16.4% and ethnicity data were missing for 22.4% of ED visits, and race was imputed for missing records. Non-Hispanic other represents 3.1% of weighted visits. These visits are included in the total but not reported separately. Non-Hispanic includes Asian, Native Hawaiian or Other Pacific Islander, American Indian or Alaska Native, and two or more races. Categories of white, black, and other only include non-Hispanic persons. Persons of Hispanic origin may be of any race. Access data table for Figure 2.
SOURCE: National Center for Health Statistics, National Hospital Ambulatory Medical Care Survey, 2017–2018.
How did the ED visit rates of motor vehicle crashes differ by primary expected source of payment?
- ED visit rates for patients who had Medicaid (18.1 visits per 1,000 persons), no insurance (17.0), or workers’ compensation combined with other types of insurance (20.3) as their primary expected source of payment were higher than visit rates for those who had private insurance (6.2) or Medicare (4.5) as their primary expected source of payment (Figure 3).
Figure 3. Emergency department visit rates for motor vehicle crashes, by primary expected source of payment: United States, 2017–2018
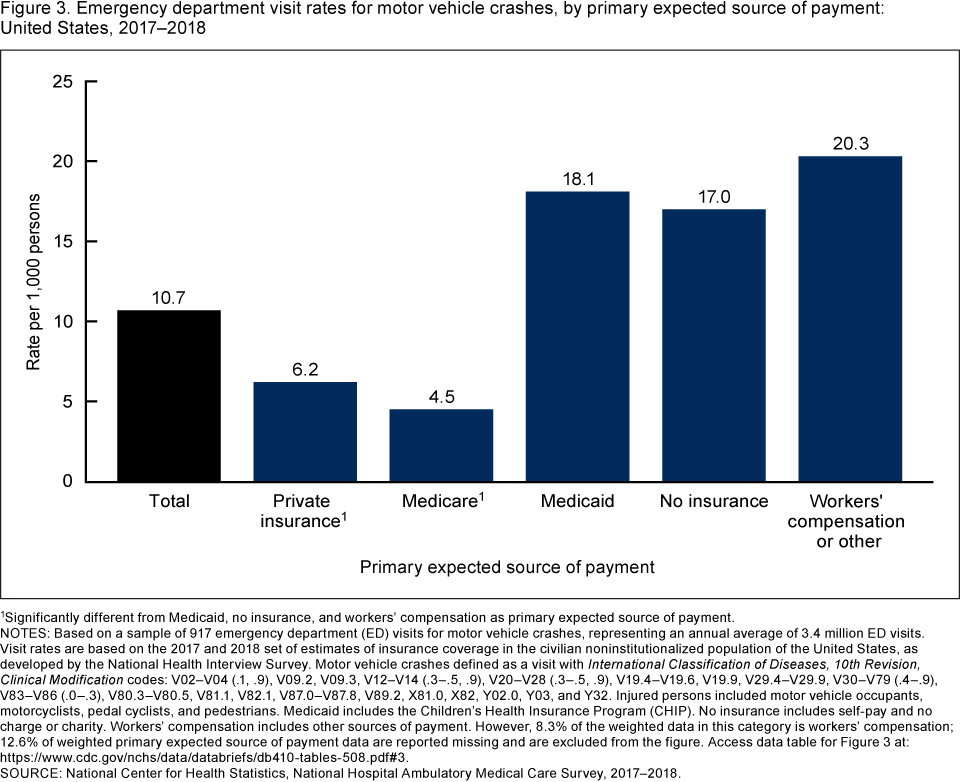
1Significantly different from Medicaid, no insurance, and workers’ compensation as primary expected source of payment.
NOTES: Based on a sample of 917 emergency department (ED) visits for motor vehicle crashes, representing an annual average of 3.4 million ED visits. Visit rates are based on the 2017 and 2018 set of estimates of insurance coverage in the civilian noninstitutionalized population of the United States, as developed by the National Health Interview Survey. Motor vehicle crashes defined as a visit with International Classification of Diseases, 10th Revision, Clinical Modification codes: V02–V04 (.1, .9), V09.2, V09.3, V12–V14 (.3–.5, .9), V20–V28 (.3–.5, .9), V19.4–V19.6, V19.9, V29.4–V29.9, V30–V79 (.4–.9), V83–V86 (.0–.3), V80.3–V80.5, V81.1, V82.1, V87.0–V87.8, V89.2, X81.0, X82, Y02.0, Y03, and Y32. Injured persons included motor vehicle occupants, motorcyclists, pedal cyclists, and pedestrians. Medicaid includes the Children’s Health Insurance Program (CHIP). No insurance includes self-pay and no charge or charity. Workers’ compensation includes other sources of payment. However, 8.3% of the weighted data in this category is workers’ compensation; 12.6% of weighted primary expected source of payment data are reported missing and are excluded from the figure. Access data table for Figure 3.
SOURCE: National Center for Health Statistics, National Hospital Ambulatory Medical Care Survey, 2017–2018.
How did the ED visit rates of motor vehicle crashes differ by region?
- The ED visit rate for motor vehicle crashes at hospitals located in the South (13.6 visits per 1,000 persons) was higher than visit rates for hospitals located in the Midwest and West census regions of the United States (Figure 4).
- The observed ED visit rate for motor vehicle crashes at hospitals located in the West (7.2 visits per 1,000 persons) was not significantly different from the rates in the Northeast (10.4) or Midwest (9.5).
Figure 4. Emergency department visit rates for motor vehicle crashes, by census region: United States, 2017–2018
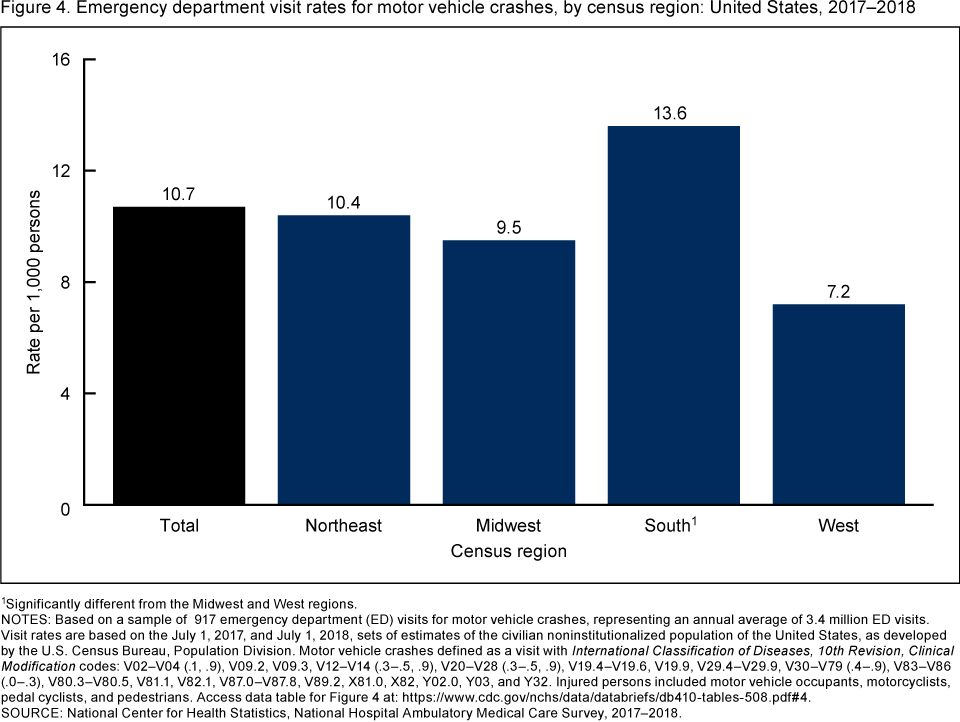
1Significantly different from the Midwest and West regions.
NOTES: Based on a sample of 917 emergency department (ED) visits for motor vehicle crashes, representing an annual average of 3.4 million ED visits. Visit rates are based on the July 1, 2017, and July 1, 2018, sets of estimates of the civilian noninstitutionalized population of the United States, as developed by the U.S. Census Bureau, Population Division. Motor vehicle crashes defined as a visit with International Classification of Diseases, 10th Revision, Clinical Modification codes: V02–V04 (.1, .9), V09.2, V09.3, V12–V14 (.3–.5, .9), V20–V28 (.3–.5, .9), V19.4–V19.6, V19.9, V29.4–V29.9, V30–V79 (.4–.9), V83–V86 (.0–.3), V80.3–V80.5, V81.1, V82.1, V87.0–V87.8, V89.2, X81.0, X82, Y02.0, Y03, and Y32. Injured persons included motor vehicle occupants, motorcyclists, pedal cyclists, and pedestrians. Access data table for Figure 4.
SOURCE: National Center for Health Statistics, National Hospital Ambulatory Medical Care Survey, 2017–2018.
Summary
This report examines 2017–2018 NHAMCS ED data and shows that an estimated 3.4 million ED visits for motor vehicle crash injuries occurred annually, or a rate of 10.7 visits per 1,000 persons. Visit rates were highest among patients aged 15–24 and then declined with age, while the rate for patients under age 15 was similar to the rate for patients aged 45 and over. Visit rates were also higher for non-Hispanic black patients compared with non-Hispanic white and Hispanic patients, and this pattern was consistent by age. Visits with Medicaid, no insurance, or workers’ compensation combined with other sources of payment as the primary expected source of payment occurred at higher rates than visits with private insurance or Medicare as the primary expected source payment. Finally, the visit rate for motor vehicle crashes at hospitals located in the South was higher than visit rates for hospitals located in the Midwest and West U.S. census regions.
Healthy People 2030 promotes safe and active transportation and outlines specific objectives to reduce nonfatal ED visits for motor vehicle crashes and visits for crash-related deaths (5). Data on the rates and characteristics of ED visits for motor vehicle crashes may help inform public health intervention efforts to meet outlined goals and objectives (6).
Definitions
Motor vehicle crash visit: An injury-related visit with a first-listed motor vehicle crash external cause-of-injury code from the International Classification of Diseases, 10th Revision, Clinical Modification (7). Adverse effect of medical and surgical misadventure or complication external cause-of-injury codes were excluded; however, if these codes were present in combination with other valid definitional codes, the visit was considered injury-related. Specifically, these codes are: V02–V04 (.1, .9), V09.2, V09.3, V12–V14 (.3–.5, .9), V20–V28 (.3–.5, .9), V19.4–V19.6, V19.9, V29.4–V29.9, V30–V79 (.4–.9), V83–V86 (.0–.3), V80.3–V80.5, V81.1, V82.1, V87.0–V87.8, V89.2, X81.0, X82, Y02.0, Y03, and Y32.
Race and ethnicity: Race and Hispanic ethnicity were collected separately and converted into a single combined variable that includes non-Hispanic white, non-Hispanic black, Hispanic, and non-Hispanic other persons. Overall for 2017 and 2018, 16.4% of race data and 22.4% of ethnicity data were missing for ED visits, and race and ethnicity were imputed for these missing records. Race and ethnicity data were imputed on the data file using a model-based, single, sequential regression imputation method (8,9). Missing race values were imputed to be white, black, or other. Hispanic ethnicity was imputed to be Hispanic or non-Hispanic. Non-Hispanic other persons represent 3.1% of weighted visits. These visits are included in the total but are not reported separately. Non-Hispanic other includes Asian, Native Hawaiian or Other Pacific Islander, American Indian or Alaska Native, and two or more races.
Primary expected source of payment for this visit: During data collection, all sources of payment were collected. For patients with more than one source of payment, the hierarchy below was used (with Medicare counted first and self-pay and no charge counted last) to collapse payments into one mutually exclusive variable (primary expected source of payment).
- Medicare: Partial or full payment by Medicare plan includes payments made directly to the hospital or reimbursed to the patient. Charges covered under a Medicare-sponsored prepaid plan are included.
- Medicaid: Partial or full payment by Medicaid plan includes payments made directly to the hospital or reimbursed to the patient. Charges covered under a Medicaid-sponsored prepaid plan (health maintenance organization) or the Children’s Health Insurance Program are included.
- Private insurance: Partial or full payment by a private insurer (for example, BlueCross BlueShield), either directly to the hospital or reimbursed to the patient. Charges covered under a private insurance-sponsored prepaid plan are included.
- Workers’ compensation or other: Includes programs designed to enable employees injured on the job to receive financial compensation regardless of fault. Also includes other sources of payment. However, 8.3% of the weighted data in the primary expected source of payment category is workers’ compensation.
- No insurance: Includes self-pay and no charge or charity. Self-pay are charges that are paid by the patient or patient’s family, which will not be reimbursed by a third party. Self-pay includes visits for which the patient is expected to be ultimately responsible for most of the bill, even if the patient never actually pays it. This does not include copayments or deductibles. No charge or charity are visits for which no fee is charged (for example, charity, special research, or teaching). No charge or charity does not include visits paid for as part of a total package (for example, prepaid plan visits, postoperative visits included in a surgical fee, and pregnancy visits included in a flat fee charged for the entire pregnancy).
Data source and methods
Data for this report are from the 2017–2018 NHAMCS, a nationally representative survey of nonfederal, general, and short-stay hospitals conducted by the National Center for Health Statistics. NHAMCS uses a multistage probability design with samples of geographic primary sampling units (PSUs), hospitals within PSUs, and patient visits within EDs. In 2017, 234 hospitals reported ED data, and in 2018, 323 hospitals reported ED data for a response rate of 62.5% (62.8% weighted) and 85.5% (88.5% weighted), respectively. Additional information on the methodology of NHAMCS is available (8,9), as are the public-use data files (1,2).
The study population includes all ED visits made by patients involved in a motor vehicle crash with any intent of injury: assault, legal intervention, self-harm, unintentional, or violence-related. Injured persons included motor vehicle occupants, motorcyclists, and pedal cyclists or pedestrians injured in collisions with motor vehicles. ED rates by age, race and ethnicity, and census region were calculated by dividing the number of ED visits caused by a motor vehicle crash by the July 1, 2017, and July 1, 2018, sets of estimates of the civilian noninstitutionalized population of the United States (obtained from the U.S. Census Bureau, Population Division) for each demographic group. Rates by expected source of payment were calculated by dividing the number of ED visits caused by motor vehicle crashes by the 2017–2018 National Health Interview Survey estimates of insurance coverage in the civilian noninstitutionalized population of the United States. The observed differences were statistically significant unless indicated otherwise.
This report has limitations that should be considered when interpreting results. Even with 2 years of combined data, race was imputed for 17.1% and ethnicity was imputed for 19.2% of ED visits. Despite imputed data, race and ethnicity data were included in this report due to known disparities in motor vehicle crash visits (4). Additionally, 12.6% of expected source of payment data was reported unknown or missing and was excluded from this analysis.
Data analyses were performed using the statistical packages SAS version 9.4 (SAS Institute, Cary, N.C.) and SAS-callable SUDAAN version 11.0 (RTI International, Research Triangle Park, N.C.). Differences among subgroups were evaluated using a two-tailed t test (p < 0.05).
About the authors
Danielle Davis and Christopher Cairns are with the National Center for Health Statistics, Division of Health Care Statistics.
References
- National Center for Health Statistics. 2017 NHAMCS micro-data file. 2019.
- National Center for Health Statistics. 2018 NHAMCS micro-data file. 2020.
- Beck LF, Dellinger AM, O’Neil ME. Motor vehicle crash injury rates by mode of travel, United States: Using exposure-based methods to quantify differences. Am J Epidemiol 166(2):212–8. 2007.
- Centers for Disease Control and Prevention. Transportation safety: Cost data and prevention policies. 2021.
- U.S. Department of Health and Human Services, Office of Disease Prevention and Health Promotion. Healthy People 2030: Injury prevention. 2021.
- Centers for Disease Control and Prevention. Transportation safety. 2021.
- Centers for Disease Control and Prevention and Centers for Medicare and Medicaid Services. International classification of diseases, 10th revision, clinical modification (ICD–10–CM). 2017.
- National Center for Health Statistics. National Hospital Ambulatory Care Survey, 2017. Public-use data file documentation. 2019.
- National Center for Health Statistics. National Hospital Ambulatory Care Survey, 2018. Public-use data file documentation. 2020.
Suggested citation
Davis D, Cairns C. Emergency department visit rates for motor vehicle crashes by selected characteristics: United States, 2017–2018. NCHS Data Brief, no 410. Hyattsville, MD: National Center for Health Statistics. 2021. DOI: https://dx.doi.org/10.15620/cdc:106460.
Copyright information
All material appearing in this report is in the public domain and may be reproduced or copied without permission; citation as to source, however, is appreciated.
National Center for Health Statistics
Brian C. Moyer, Ph.D., Director
Amy M. Branum, Ph.D., Acting Associate Director for Science
Division of Health Care Statistics
Carol J. DeFrances, Ph.D., Acting Director
Alexander Strashny, Ph.D., Associate Director for Science