Population Aging and the Use of Office-based Physician Services
- Key findings
- From 1998 to 2008, physician office visits and services became increasingly concentrated on middle-aged and older patients.
- From 1998 to 2008, overall visit rates and visit rates where medications were prescribed or continued increased more for those aged 65 and over than for other age groups.
- From 1998 to 2008, the largest increases in office visits for patients aged 65 and over were for essential hypertension, cardiac dysrhythmias, and diabetes.
- Most physicians accept new Medicare patients, but the percentage varies by physician specialty.
- Among patients aged 65 and over, the percentage of visits to primary care specialists decreased from 1978 to 2008.
- Summary
- Definitions
- Data source and methods
- About the authors
- References
- Suggested citation
NCHS Data Brief No. 41, August 2010
PDF Version (695 KB)
Donald Cherry, M.S.; Christine Lucas, M.P.H., M.S.W.; and Sandra L. Decker, Ph.D.
Key findings
- From 1998 to 2008, the proportion of physician office-based visits in the United States became increasingly concentrated on those aged 45 and over.
- The intensity of physician office visits, as measured by medications prescribed or continued, imaging tests ordered or provided, and time spent with physicians, also became increasingly concentrated on those aged 45 and over.
- Although most physicians accept Medicare patients, acceptance of Medicare was higher among ophthalmologists and general surgeons than among general or family practitioners, internists, and psychiatrists.
- Over the past 30 years, the specialty concentration of visits has shifted significantly. In 1978, 62 percent of visits by patients aged 65 and over were to primary care physicians compared with 45 percent in 2008. The percentage of visits to physicians with a medical or surgical specialty increased from 37 percent to 55 percent.
From 1998 to 2008, the U.S. population aged 65 and over increased by 15 percent, while the population aged 45 to 64 increased by 37 percent (1). The proportion of persons aged 65 and over is expected to increase in the future as the baby boomers, currently in the 45-64 age group, enter their elder years. The federal Medicare program is the largest payer for health care for those aged 65 and over, and accounts for an increasing share of U.S. national health expenditures-14 percent in 1978, 18 percent in 1998, and 20 percent in 2008 (2). Medicare has attempted to control expenditures through limiting payment rates to physicians, resulting in generally lower Medicare physician fees than private insurance fees (3). Despite this fact, most physicians accept new Medicare patients (4), and Medicare spending is expected to continue to grow (5). This report describes past trends in physician care provided to patients of different ages, with particular attention paid to persons aged 45 and over.
Keywords: National Ambulatory Medical Care Survey, Medicare, physician office care
From 1998 to 2008, physician office visits and services became increasingly concentrated on middle-aged and older patients.
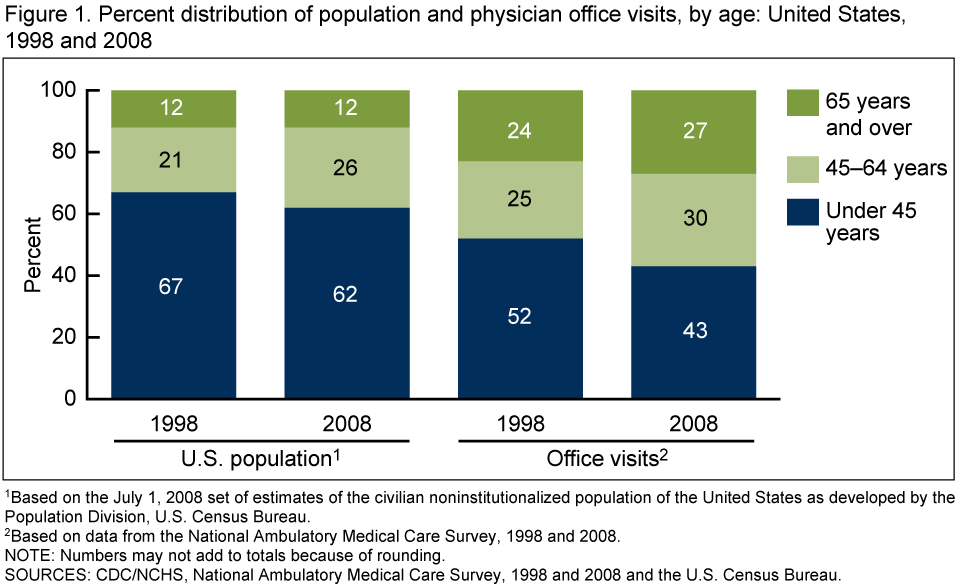
- The percentage of the population aged 45 and over increased from 33 percent to 38 percent. At the same time, the percentage of physician visits made by patients aged 45 and over increased from 49 percent to 57 percent (Figure 1).
- Patients aged 45 and over increased their share of total medications prescribed or continued (from 60 percent to 70 percent) (Figure 2).
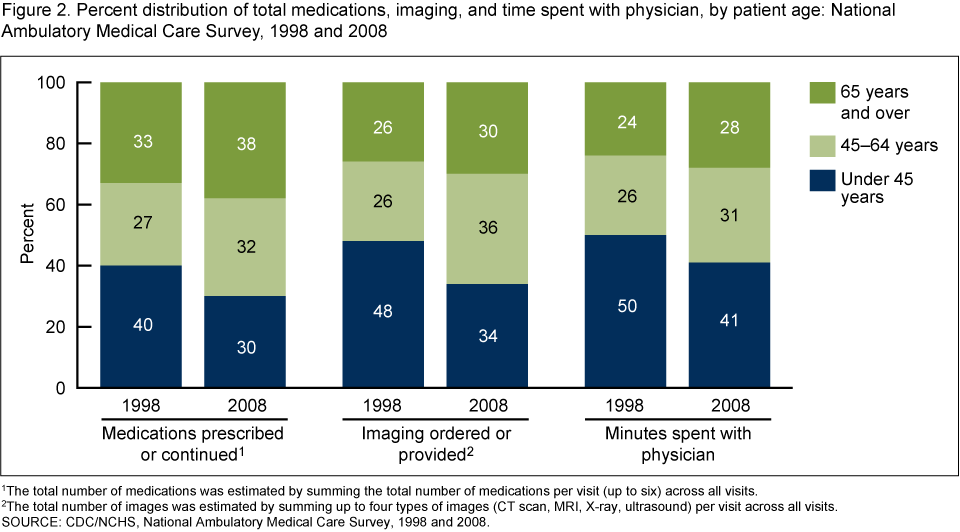
- Patients aged 45 and over also increased their share of imaging tests ordered or provided (from 52 percent to 66 percent). The largest increase in intensity was for imaging by those aged 45-64; their share of all imaging ordered or provided increased from 26 percent to 36 percent.
- In addition, patients aged 45 and over increased their share of total time spent with a physician (from 50 percent to 59 percent).
- The increasing concentration of physician visits on older patients occurred because the percentage of the population aged 45 and over increased and because visit rates among those aged 45 and over increased.
From 1998 to 2008, overall visit rates and visit rates where medications were prescribed or continued increased more for those aged 65 and over than for other age groups.
- The office visit rate for patients aged 65 and over increased by 13 percent (from 6.1 to 6.9 visits per person), and the visit rate where medications were prescribed or continued increased by 31 percent (from 4.2 to 5.5 visits per person) (Figure 3).
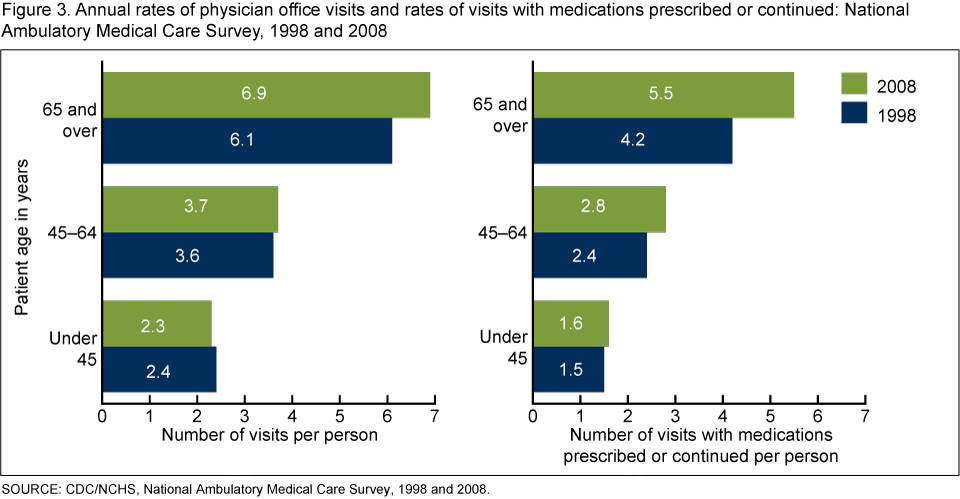
- The visit rate was not different for the group aged 45-64; however, the medication rate increased in 2008 compared with 1998.
From 1998 to 2008, the largest increases in office visits for patients aged 65 and over were for essential hypertension, cardiac dysrhythmias, and diabetes.
- Among all diagnoses, essential hypertension, cardiac dysrhythmias, and diabetes mellitus accounted for the largest increases in number of visits from 1998 to 2008 (see table).
Table. Primary diagnoses with the largest increase in number of visits for those aged 65 and over: National Ambulatory Medical Care Survey, 1998 and 2008
| Number of visits in thousands | |||||
|---|---|---|---|---|---|
| Condition | ICD-9-CM code(s)1 | 1998 | 2008 | Increase | Percent increase |
| Essential hypertension | 401 | 14,015 | 22,655 | 8,640 | 62 |
| Cardiac dysrhythmias | 427 | 2,834 | 6,761 | 3,928 | 139 |
| Diabetes mellitus | 250 | 7,559 | 10,996 | 3,438 | 45 |
| Disorders of lipoid metabolism | 272 | 2,167 | 5,424 | 3,258 | 150 |
| Actinic and seborrheic keratosis | 702.0-702.1 | 2,627 | 4,130 | 1,503 | 57 |
| Symptoms involving the urinary system | 788 | 1,023 | 2,441 | 1,418 | 139 |
| Coronary atherosclerosis | 414 | 5,894 | 7,310 | 1,416 | 24 |
| Malignant neoplasm of prostate | 185 | 1,616 | 2,556 | 941 | 58 |
| Retinal detachment and other retinal disorders | 361-363 | 1,859 | 2,662 | 803 | 43 |
| Acquired hypothyroidism | 244 | 586 | 1,369 | 783 | 134 |
1ICD is International Classification of Diseases. For groupings of primary diagnosis codes, see National Health Statistics Reports, Number 8 [PDF – 625 KB].
SOURCE: CDC/NCHS, National Ambulatory Medical Care Survey, 1990 and 2008.
- The number of visits increased for disorders of lipoid metabolism by 150 percent, for cardiac dysrhythmias by 139 percent, for essential hypertension by 62 percent, and for diabetes mellitus by 45 percent.
- Although not shown, some of these conditions were also top reasons for visit increases among the group aged 45-64, including lipoid metabolism (increased by 161 percent), essential hypertension (increased by 64 percent), and diabetes mellitus (increased by 17 percent).
Most physicians accept new Medicare patients, but the percentage varies by physician specialty.
- On average, 86 percent of physicians accepted new Medicare patients in 2008 (Figure 4).
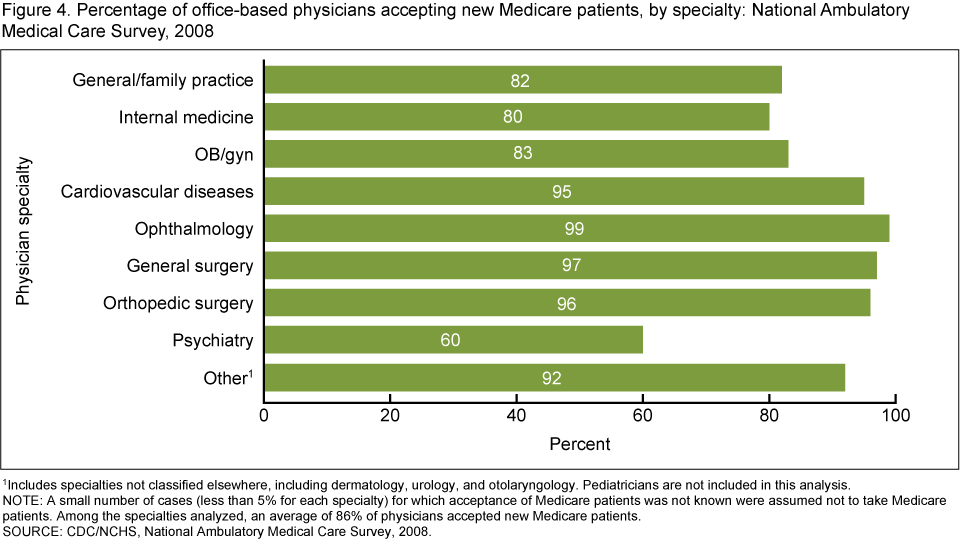
- The percentage of physicians accepting new Medicare patients was highest among ophthalmologists (99 percent) and general surgeons (97 percent).
- The percentage accepting new Medicare patients was 82 percent for physicians in general or family practice, 80 percent for physicians in internal medicine, and 60 percent for psychiatrists.
Among patients aged 65 and over, the percentage of visits to primary care specialists decreased from 1978 to 2008.
- Over the longer period from 1978 to 2008, the percentage of visits that were to primary care specialists decreased from 62 percent in 1978 to 45 percent in 2008 for patients aged 65 and over (Figure 5).
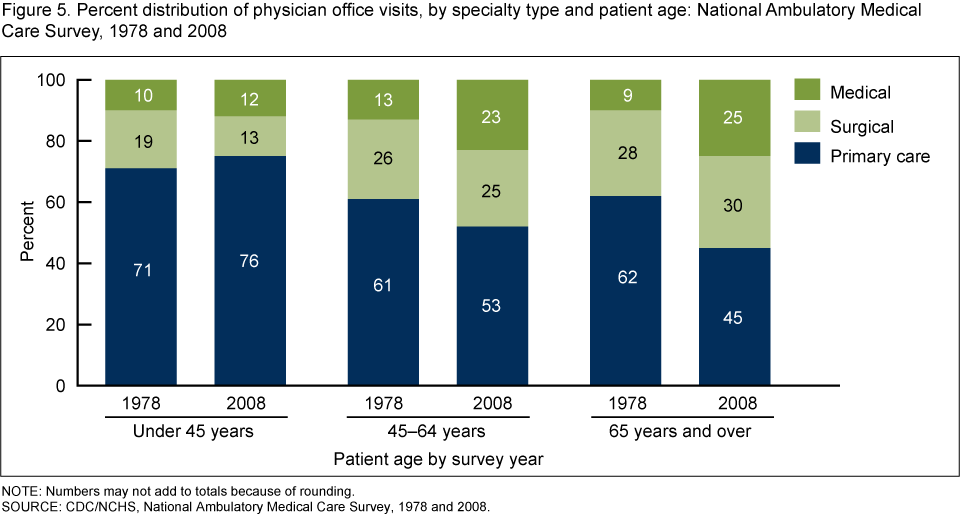
- For those aged 65 and over, the percentage of visits to physicians with a medical or surgical specialty increased from 37 percent to 55 percent. This pattern was also observed for patients aged 45-64.
Summary
In 2008, physician office visits by those aged 45 and over accounted for a greater proportion of all office visits than in 1998 (57 percent compared with 49 percent). Medications prescribed or continued, imaging ordered or provided, and time spent with physician also became increasingly concentrated on those aged 45 and over. For the same age group, physician visits became increasingly concentrated on care provided by medical and surgical specialists and less on care provided by primary care practitioners.
In the future, the percentage of visits for those aged 65 and over will increase as the baby boomers, currently aged 45-64, move into the 65 and over age group. Physician visits are becoming increasingly focused on management of chronic conditions such as hypertension, coronary atherosclerosis, and diabetes. Future changes in Medicare payment rates could affect physician acceptance of Medicare and the distribution of care provided by specialty. An increased focus on the quality and effectiveness of patient care could also affect the type and amount of care provided. While this report describes past changes in office-based physician visits, both the aging of the population and changes in the health care system will likely continue to alter the number and intensity of physician office visits for elderly patients in future years.
Definitions
Medications prescribed or continued: Includes prescription and over-the-counter drugs, immunizations, allergy shots, anesthetics, chemotherapy, and dietary supplements that were ordered, supplied, administered, or continued during the visits. In 1998, physicians could record up to six medications, and in 2008, up to eight medications. Only the first six medications mentioned in 2008 were analyzed for Figures 2 and 3 so that a comparison could be made to the 1998 data.
Specialty type: This classification is used in Figure 5 and divides specialties into three major categories: primary care, surgical, and medical. For a description of physician specialties included in each of the three specialty types, see the 2008 National Ambulatory Medical Care Survey (NAMCS) Public-use Data File Documentation.
Data source and methods
Data from the 1978, 1998, and 2008 NAMCS were used for these analyses. NAMCS is a national probability sample survey of nonfederal office-based physicians in the United States conducted by the Centers for Disease Control and Prevention’s National Center for Health Statistics, Division of Health Care Statistics. The target universe of NAMCS includes visits made in the United States to the offices of nonfederally employed physicians-excluding those in the specialties of anesthesiology, radiology, and pathology-who were classified by the American Medical Association and American Osteopathic Association as providing “office-based, patient care.”
NAMCS utilizes a multistage probability sample design involving samples of geographic primary sampling units (PSUs), physician practices within PSUs, and patient visits within physician practices. PSUs are counties, groups of counties, county equivalents, or for some PSUs in New England, towns and townships. A sample weight is computed for each sample visit that takes all stages of design into account. The survey data are inflated or weighted to produce unbiased national annual estimates of physician office visits.
Due to hypothesized increases in health care utilization, differences among subgroups were evaluated with one-tailed t tests using p < 0.05 as the level of significance. All comparisons reported in the text are statistically significant unless otherwise indicated. Data analyses were performed using the statistical packages SAS version 9.2 (SAS Institute, Cary, North Carolina), SUDAAN version 10.0 (Research Triangle Institute, Research Triangle Park, North Carolina), and STATA version 11.0 (College Station, Texas).
About the authors
Donald Cherry, Christine Lucas, and Sandra L. Decker are with the Centers for Disease Control and Prevention’s National Center for Health Statistics, Division of Health Care Statistics.
References
- U.S. Census Bureau, Population Division. Population estimates based on civilian noninstitutionalized population of United States. July 1, 2008.
- Centers for Medicare & Medicaid Services, Office of the Actuary. NHE historical and projections, 1965-2019. [Accessed 6/29/10].
- MedPAC. Report to the Congress: Medicare payment policy. 2010.
- Hing E, Burt CW. Characteristics of office-based physicians and their medical practices: United States, 2005-2006. National Center for Health Statistics. Vital Health Stat 13(166). 2008.
- Centers for Medicare & Medicaid Services. 2009 annual report of the boards of trustees of the Federal Hospital Insurance and Federal Supplementary Medical Insurance Trust Funds [PDF – 3.2 MB]. [Accessed 6/29/10].
Suggested citation
Cherry D, Lucas C, Decker SL. Population aging and the use of office-based physician services. NCHS data brief, no 41. Hyattsville, MD: National Center for Health Statistics. 2010.
Copyright information
All material appearing in this report is in the public domain and may be reproduced or copied without permission; citation as to source, however, is appreciated.
National Center for Health Statistics
Edward J. Sondik, Ph.D., Director
Jennifer H. Madans, Ph.D., Associate
Director for Science
Division of Health Care Statistics
Jane E. Sisk, Ph.D., Director