Urgent Care Center and Retail Health Clinic Utilization Among Adults: United States, 2019
NCHS Data Brief No. 409, June 2021
PDF Version (400 KB)
- Key findings
- In 2019, women were more likely than men to have had one or more urgent care center or retail health clinic visits in the past 12 months.
- For both men and women, use of urgent care centers or retail health clinics in the past 12 months decreased as age increased.
- For men and women, non-Hispanic white adults were more likely than other race and Hispanic-origin groups to have had one or more urgent care center or retail health clinic visits in the past 12 months.
- Urgent care center or retail health clinic utilization in the past 12 months increased with increasing education level.
- Summary
Data from the National Health Interview Survey
- In 2019, 32.3% of women and 26.0% of men had one or more visits to an urgent care center or retail health clinic in the past 12 months.
- Urgent care center or retail health clinic utilization decreased as age increased for both men and women.
- Among both men and women, non-Hispanic white adults were more likely to have one or more urgent care center or retail health clinic visits than Hispanic, non-Hispanic black, or non-Hispanic Asian adults.
- Urgent care center or retail health clinic utilization increased with increasing education level.
Urgent care centers and health clinics within grocery or retail stores can provide acute health care services for nonemergencies, and they can also provide preventive care services, such as routine vaccinations (1). The availability and utilization of urgent care has risen dramatically in recent years (1,2). This report examines urgent care center and retail health clinic visits among adults in the past 12 months by sex and selected characteristics.
Keywords: health care use, acute care, National Health Interview Survey, NHIS
In 2019, women were more likely than men to have had one or more urgent care center or retail health clinic visits in the past 12 months.
In 2019, 29.2% of adults had one or more urgent care center or retail health clinic visits in the past 12 months (Figure 1). Women (32.3%) were more likely than men (26.0%) to have had one or more urgent care center or retail health clinic visits in the past 12 months. This pattern was also seen for any visit and when broken down by number of visits. Among men, 15.1% had one visit, 7.4% had two visits, and 3.4% had three or more visits. Among women, 16.5% had one visit, 9.8% had two visits, and 6.0% had three or more visits.
Figure 1. Age-adjusted percentage of adults aged 18 and over who had one or more urgent care center or retail health clinic visits in the past 12 months and number of visits in the past 12 months, by sex: United States, 2019
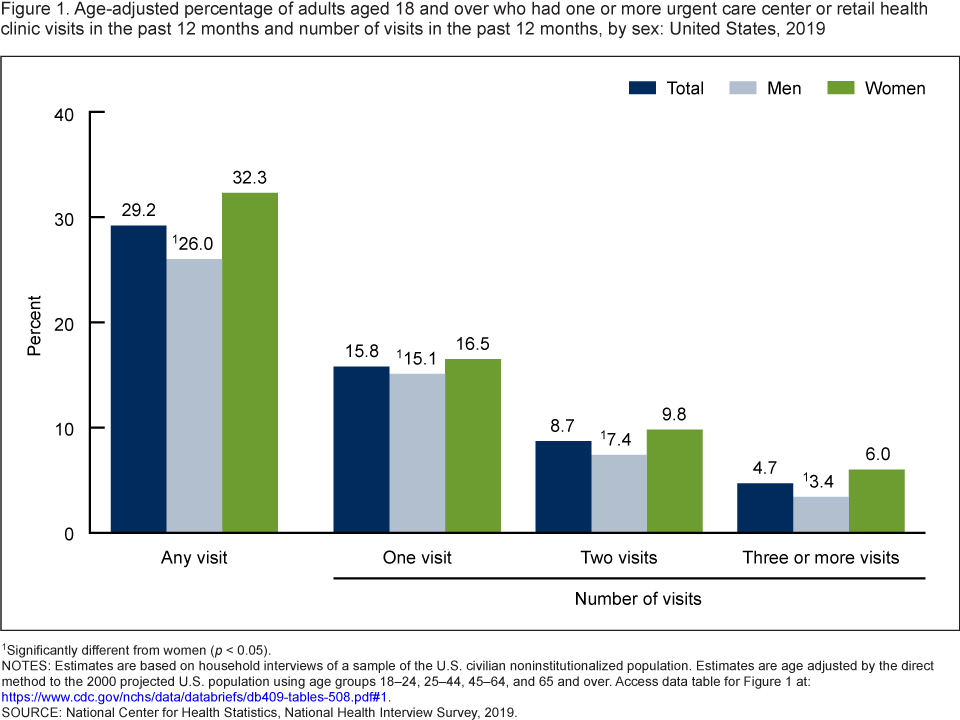
1Significantly different from women (p < 0.05).
NOTES: Estimates are based on household interviews of a sample of the U.S. civilian noninstitutionalized population. Estimates are age adjusted by the direct method to the 2000 projected U.S. population using age groups 18–24, 25–44, 45–64, and 65 and over. Access data table for Figure 1.
SOURCE: National Center for Health Statistics, National Health Interview Survey, 2019.
For both men and women, use of urgent care centers or retail health clinics in the past 12 months decreased as age increased.
Women in each age group were more likely than men to have had one or more urgent care or retail health clinic visits in the past 12 months (Figure 2). Among men, the percentage of adults who had one or more urgent care or retail health clinic visits decreased overall as age increased, from 27.5% among those aged 18–29 and 28.1% among those aged 30–44 to 21.4% among those aged 65 and over. Similarly, among women, those aged 18–29 were most likely to have had one or more urgent care or retail health clinic visits (38.9%), while those aged 65 and over (26.2%) were least likely.
Figure 2. Percentage of adults aged 18 and over who had one or more urgent care center or retail health clinic visits in the past 12 months, by sex and age group: United States, 2019
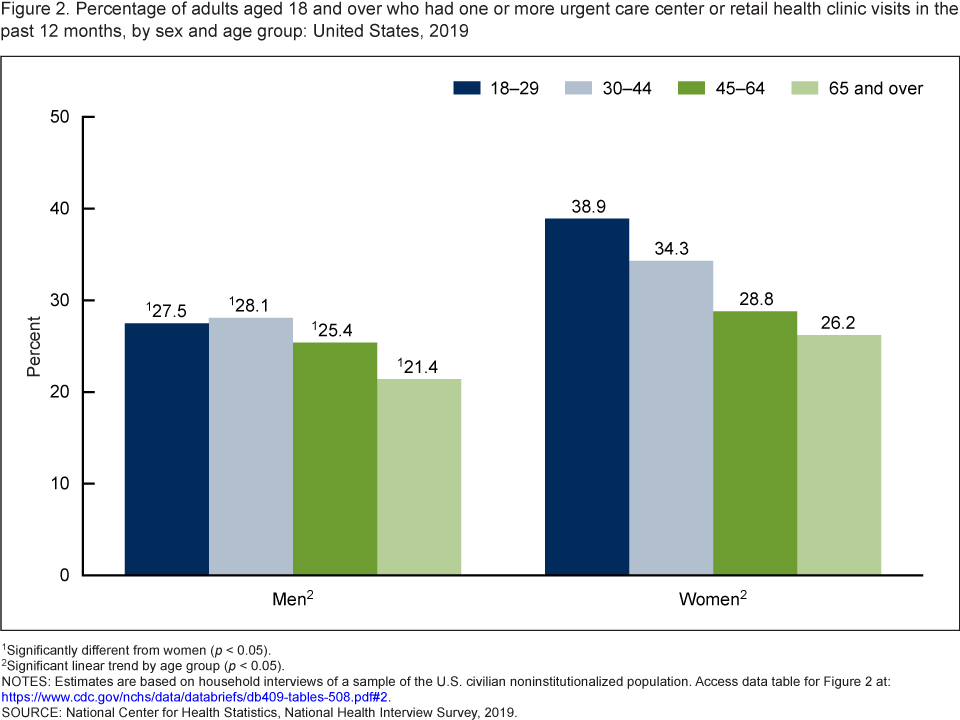
1Significantly different from women (p < 0.05).
2Significant linear trend by age group (p < 0.05).
NOTES: Estimates are based on household interviews of a sample of the U.S. civilian noninstitutionalized population. Access data table for Figure 2.
SOURCE: National Center for Health Statistics, National Health Interview Survey, 2019.
For men and women, non-Hispanic white adults were more likely than other race and Hispanic-origin groups to have had one or more urgent care center or retail health clinic visits in the past 12 months.
Among men, non-Hispanic white adults (28.0%) were more likely than Hispanic (22.8%), non-Hispanic black (23.4%), and non-Hispanic Asian (20.0%) adults to have had one or more urgent care or retail health clinic visits (Figure 3). Among women, non-Hispanic white adults (34.8%) were more likely than Hispanic (28.5%), non-Hispanic black (31.4%), and non-Hispanic Asian (22.6%) adults to have had one or more urgent care or retail health clinic visits. Hispanic and non-Hispanic black women were also more likely than non-Hispanic Asian women to have had one or more urgent care or retail health clinic visits. For each race and Hispanic-origin group, women were more likely than men to have had one or more urgent care center or retail health clinic visits in the past 12 months. Differences by sex were not statistically significant for non-Hispanic Asian adults.
Figure 3. Age-adjusted percentage of adults aged 18 and over who had one or more urgent care center or retail health clinic visits in the past 12 months, by sex and race and Hispanic origin: United States, 2019
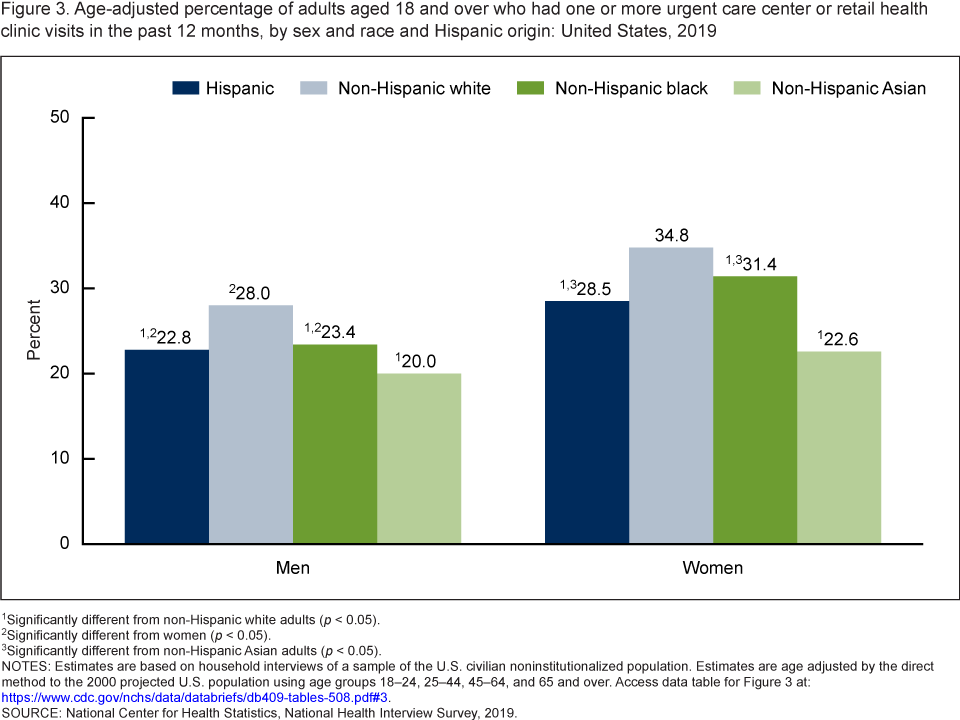
1Significantly different from non-Hispanic white adults (p < 0.05).
2Significantly different from women (p < 0.05).
3Significantly different from non-Hispanic Asian adults (p < 0.05).
NOTES: Estimates are based on household interviews of a sample of the U.S. civilian noninstitutionalized population. Estimates are age adjusted by the direct method to the 2000 projected U.S. population using age groups 18–24, 25–44, 45–64, and 65 and over. Access data table for Figure 3.
SOURCE: National Center for Health Statistics, National Health Interview Survey, 2019.
Urgent care center or retail health clinic utilization in the past 12 months increased with increasing education level.
For men, urgent care or retail health clinic utilization ranged from 21.1% among those with less than a high school diploma to 27.1% among those with some college, and was 26.8% among those with a college degree or higher (Figure 4). Among women, urgent care or retail health clinic utilization ranged from 28.3% among those with less than a high school diploma to 34.7% among those with a college degree or higher. For each level of education, women were more likely than men to have had one or more urgent care or retail health clinic visits in the past 12 months.
Figure 4. Age-adjusted percentage of adults aged 18 and over who had one or more urgent care center or retail health clinic visits in the past 12 months, by sex and education level: United States, 2019
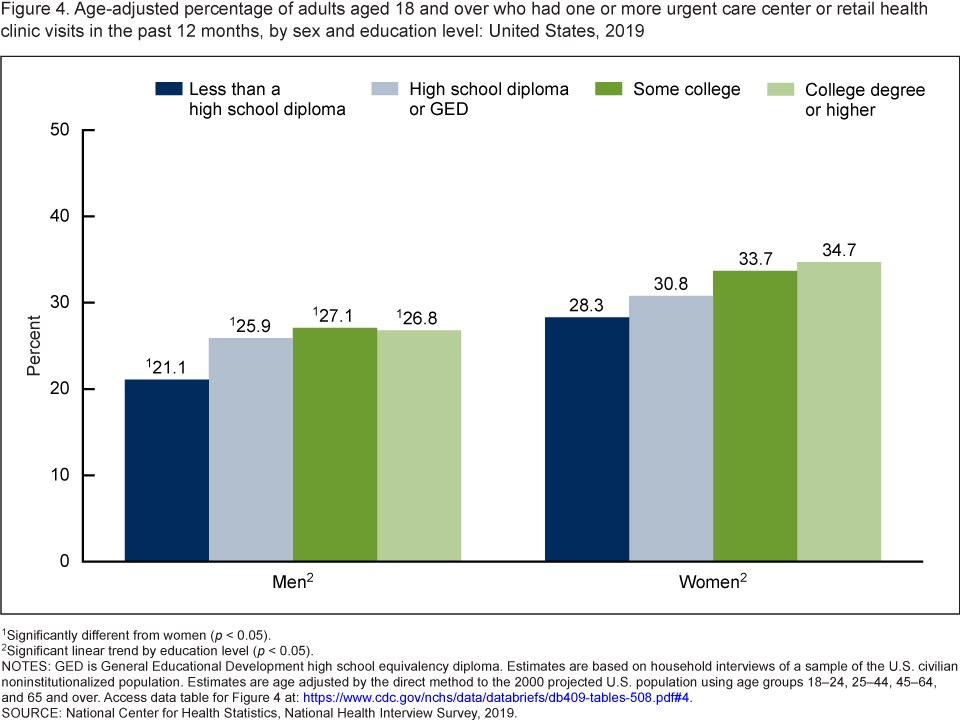
1Significantly different from women (p < 0.05).
2Significant linear trend by education level (p < 0.05).
NOTES: GED is General Educational Development high school equivalency diploma. Estimates are based on household interviews of a sample of the U.S. civilian noninstitutionalized population. Estimates are age adjusted by the direct method to the 2000 projected U.S. population using age groups 18–24, 25–44, 45–64, and 65 and over. Access data table for Figure 4.
SOURCE: National Center for Health Statistics, National Health Interview Survey, 2019.
Summary
Women were more likely than men to have had one or more urgent care or retail health clinic visits in the past 12 months in 2019, which is consistent with 2019 claims data for these facilities (2) and general trends seen in primary and preventive care (3,4). Adults were less likely to have visited an urgent care or retail health clinic as age increased. Non-Hispanic white adults were more likely to have visited an urgent care or retail clinic than Hispanic, non-Hispanic black, and non-Hispanic Asian adults. Utilization also increased with increasing education level.
The accessibility of urgent care and retail clinics has been shown to offer patients more flexibility and ease of utilization for those without a usual provider or place of care (1,5). These clinics also tend to be less costly and may reduce the burden on emergency rooms (5). However, concerns exist about integrating the care offered at urgent care and retail clinics with other health care services (5).
Definitions
Race and Hispanic origin: Adults categorized as Hispanic may be of any race or combination of races. Adults categorized as non-Hispanic white, non-Hispanic black, and non-Hispanic Asian indicated one race only. Estimates for non-Hispanic adults of other races are not shown.
Urgent care: Based on responses to the survey question, “During the past 12 months, how many times have you gone to an urgent care center or a clinic in a drug store or grocery store about your health?”
Data source and methods
Data from the 2019 National Health Interview Survey (NHIS) were used for this analysis. NHIS is a nationally representative household survey of the U.S. civilian noninstitutionalized population. It is conducted continuously throughout the year by the National Center for Health Statistics (NCHS). Interviews are conducted in respondents’ homes, but follow-ups to complete interviews may be conducted over the telephone. For more information about NHIS, visit: https://www.cdc.gov/nchs/nhis.htm.
Point estimates and corresponding confidence intervals for this analysis were calculated using SUDAAN software (6) to account for the complex sample design of NHIS. Estimates were age adjusted using the projected 2000 U.S. population and the following age groups: 18–24, 25–44, 45–64, and 65 and over. Differences between percentages were evaluated using two-sided significance tests at the 0.05 level. Linear and quadratic trends by age group and education level were evaluated using Proc Descript, poly option. All estimates meet NCHS standards of reliability as specified in “National Center for Health Statistics Data Presentation Standards for Proportions” (7).
About the authors
Lindsey I. Black and Dzifa Adjaye-Gbewonyo are with the NCHS Division of Health Interview Statistics.
References
- Krause TM, Ganduglia-Cazaban C, Piller LB, Venkataraman V. Comparison of utilization of urgent care and primary care 2011–2015. Future Med Chem 1(1):1–2. 2018.
- FAIR Health, Inc. FH healthcare indicators and FH medical price index: An annual view of place of service trends and medical pricing [white paper]. 2021.
- Bertakis KD, Azari R, Helms LJ, Callahan EJ, Robbins JA. Gender differences in the utilization of health care services. J Fam Prac 49(2):147–52. 2000.
- Vaidya V, Partha G, Karmakar M. Gender differences in utilization of preventive care services in the United States. J Womens Health (Larchmnt) 21(2):140–5. 2012.
- Villaseñor S, Krouse HJ. Can the use of urgent care clinics improve access to care without undermining continuity in primary care? J Am Assoc Nurse Pract 28(6):335–41. 2016.
- RTI International. SUDAAN (Release 11.0.3) [computer software]. 2018.
- Parker JD, Talih M, Malec DJ, Beresovsky V, Carroll M, Gonzalez JF Jr, et al. National Center for Health Statistics data presentation standards for proportions. National Center for Health Statistics. Vital Health Stat 2(175). 2017.
Suggested citation
Black LI, Adjaye-Gbewonyo D. Urgent care center and retail health clinic utilization among adults: United States, 2019. NCHS Data Brief, no 409. Hyattsville, MD: National Center for Health Statistics. 2021. DOI: https://dx.doi.org/10.15620/cdc:106463.
Copyright information
All material appearing in this report is in the public domain and may be reproduced or copied without permission; citation as to source, however, is appreciated.
National Center for Health Statistics
Brian C. Moyer, Ph.D., Director
Amy M. Branum, Ph.D., Acting Associate Director for Science
Division of Health Interview Statistics
Stephen J. Blumberg, Ph.D., Director
Anjel Vahratian, Ph.D., M.P.H., Associate Director for Science