Emergency Department Visit Rates by Selected Characteristics: United States, 2018
NCHS Data Brief No. 401, March 2021
PDF Version (568 KB)
- Key findings
- What were the ED visit rates overall and by MSA status, and did this vary during 2007–2018?
- What were the ED visit rates for each age group, and did these rates vary?
- What were the ED visit rates by sex and race and ethnicity, and did these rates vary?
- What were the ED visit rates for each primary expected source of payment, and did these rates vary?
- Summary
Data from the National Hospital Ambulatory Medical Care Survey, 2018
- The overall emergency department (ED) visit rate (39 visits per 100 persons) and visit rates by metropolitan statistical areas did not change between 2007 and 2018.
- The ED visit rate was highest for infants under age 1 year (101 visits per 100 infants) followed by adults aged 75 and over (52 per 100 persons).
- The ED visit rate for females was higher than the rate for males.
- The ED visit rate for non-Hispanic black or African American persons (87 visits per 100 persons) was higher than the rate for persons from all other race and ethnic groups.
- The ED visit rate for patients with private insurance was lowest, while the rate for patients with Medicaid was highest compared with all other sources of payment.
In 2018, there were an estimated 130 million emergency department (ED) visits in the United States (1). In 2019, approximately 22% of adults aged 18 and over had visited the ED in the past 12 months (2). This report presents ED visit rates by selected characteristics, including metropolitan statistical area (MSA), age, sex, race and ethnicity, and health insurance status. Data for this report are from the National Hospital Ambulatory Medical Care Survey (NHAMCS) (3,4).
Keywords: emergency care, hospital characteristics, patient characteristics, National Hospital Ambulatory Medical Care Survey
What were the ED visit rates overall and by MSA status, and did this vary during 2007–2018?
- The overall ED visit rate remained stable at 39 visits per 100 persons in 2007 to 40 visits per 100 persons in 2018 (Figure 1).
- From 2007 to 2018, ED visit rates for MSAs remained stable at 40 visits per 100 persons. While ED visits rates were observed to fluctuate over this period and increased from 38 to 41 visits per 100 persons, this change was not significant.
Figure 1. Emergency department visit rates, by year: United States, 2007–2018
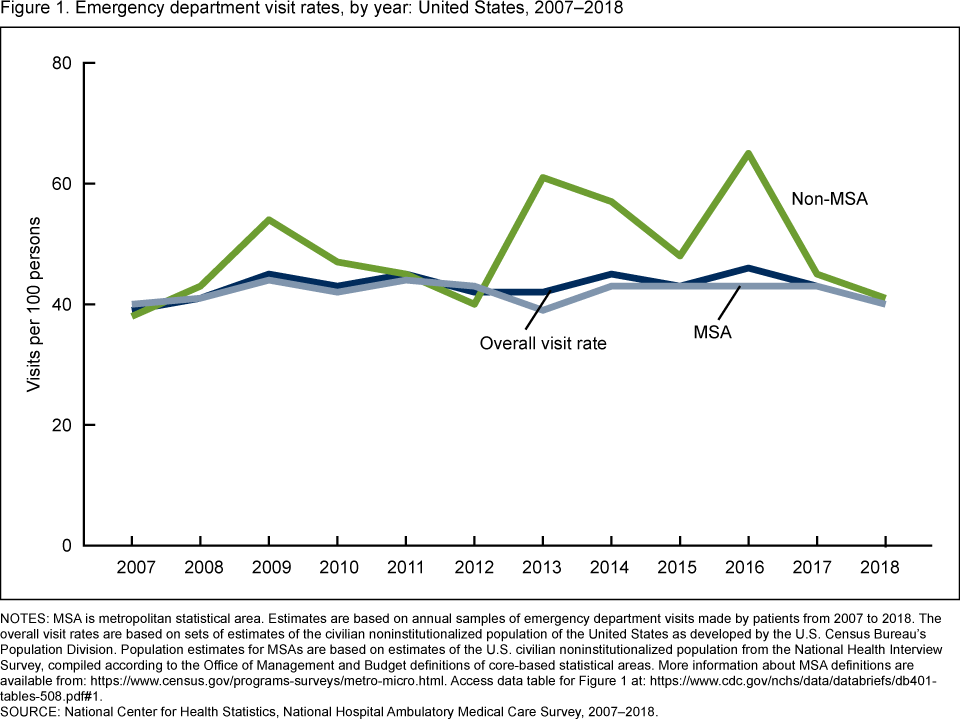
NOTES: MSA is metropolitan statistical area. Estimates are based on annual samples of emergency department visits made by patients from 2007 to 2018. The overall visit rates are based on sets of estimates of the civilian noninstitutionalized population of the United States as developed by the U.S. Census Bureau’s Population Division. Population estimates for MSAs are based on estimates of the U.S. civilian noninstitutionalized population from the National Health Interview Survey, compiled according to the Office of Management and Budget definitions of core-based statistical areas. More information about MSA definitions are available from: https://www.census.gov/programs-surveys/metro-micro.html. Access data table for Figure 1.
SOURCE: National Center for Health Statistics, National Hospital Ambulatory Medical Care Survey, 2007–2018.
What were the ED visit rates for each age group, and did these rates vary?
- In 2018, the ED visit rate for infants under age 1 year was 101 visits per 100 infants, which was highest compared with all other age groups (Figure 2).
- The ED visit rate for adults aged 75 and over was 60 visits per 100 persons, which was higher than the rates for all other age groups, except infants under age 1 year.
- ED visit rates were similar for all other age groups, ranging from 35 to 41 visits per 100 persons.
Figure 2. Emergency department visit rates, by age group: United States, 2018
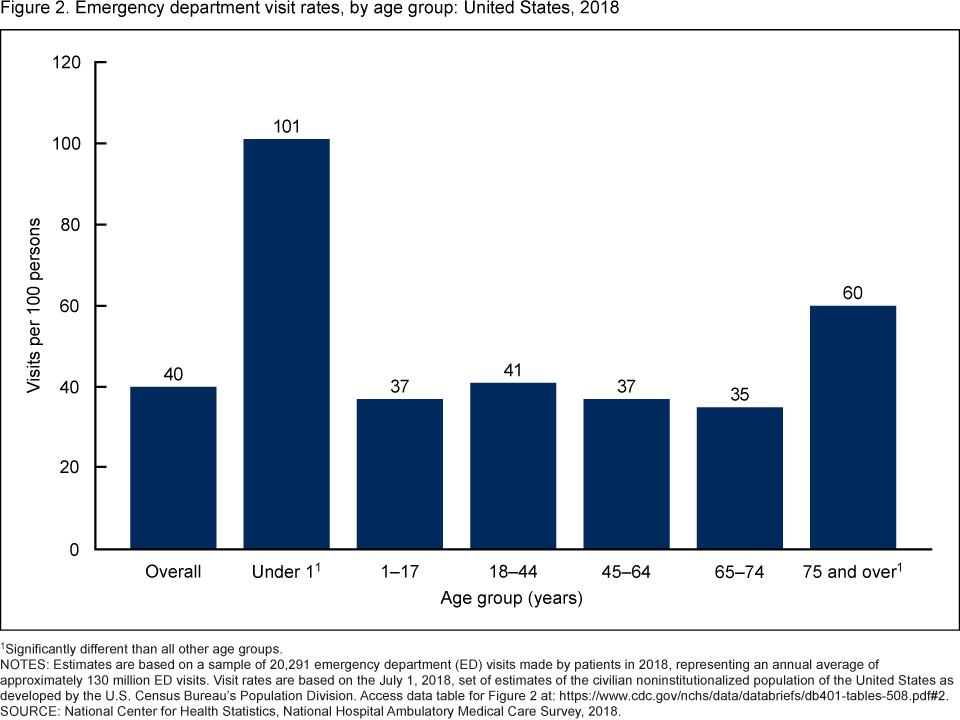
1Significantly different than all other age groups.
NOTES: Estimates are based on a sample of 20,291 emergency department (ED) visits made by patients in 2018, representing an annual average of approximately 130 million ED visits. Visit rates are based on the July 1, 2018, set of estimates of the civilian noninstitutionalized population of the United States as developed by the U.S. Census Bureau’s Population Division. Access data table for Figure 2.
SOURCE: National Center for Health Statistics, National Hospital Ambulatory Medical Care Survey, 2018.
What were the ED visit rates by sex and race and ethnicity, and did these rates vary?
- The ED visit rate for females was 44 visits per 100 persons, which was higher than the rate for males (37 visits per 100 persons) (Figure 3).
- In 2018, the ED visit rate for non-Hispanic black or African American persons was 87 visits per 100 persons, which was higher than the rates for persons from all other race and ethnic groups.
- The ED visit rate for non-Hispanic persons from race groups other than white or black or African American was 18 visits per 100 persons, which was lower than the rate for persons from all other race and ethnic groups.
- The ED visit rates for Hispanic or Latino persons (36 per 100 persons) and non-Hispanic white persons (35 per 100 persons) were similar.
Figure 3. Emergency department visit rates, by sex and race and ethnicity: United States, 2018
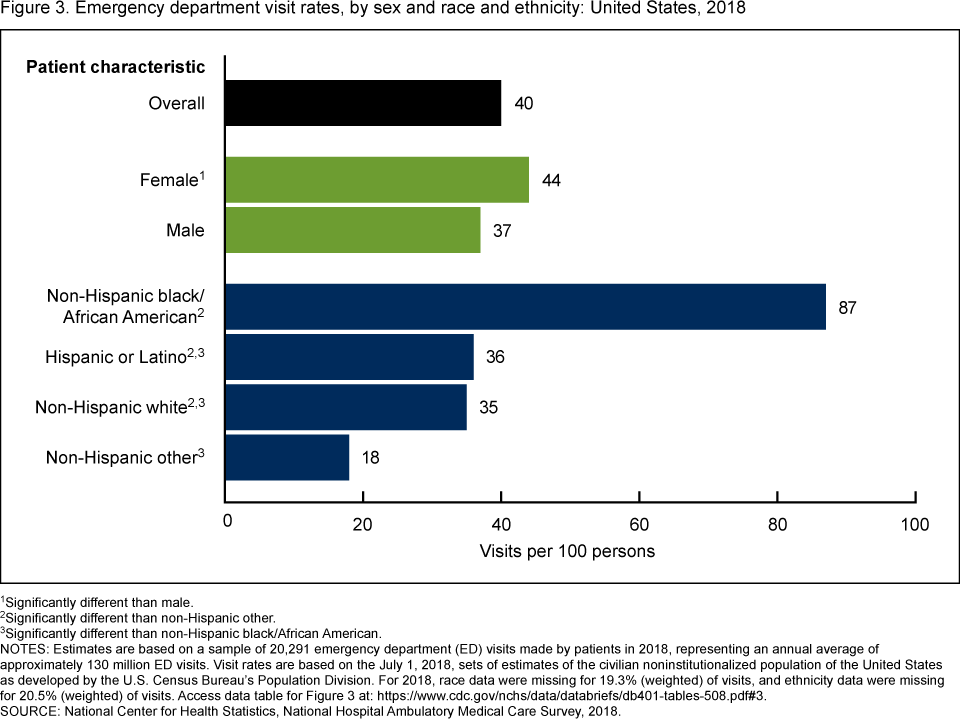
1Significantly different than male.
2Significantly different than non-Hispanic other.
3Significantly different than non-Hispanic black/African American.
NOTES: Estimates are based on a sample of 20,291 emergency department (ED) visits made by patients in 2018, representing an annual average of approximately 130 million ED visits. Visit rates are based on the July 1, 2018, sets of estimates of the civilian noninstitutionalized population of the United States as developed by the U.S. Census Bureau’s Population Division. For 2018, race data were missing for 19.3% (weighted) of visits, and ethnicity data were missing for 20.5% (weighted) of visits. Access data table for Figure 3.
SOURCE: National Center for Health Statistics, National Hospital Ambulatory Medical Care Survey, 2018.
What were the ED visit rates for each primary expected source of payment, and did these rates vary?
- The ED visit rate was highest for patients with Medicaid (97 visits per 100 persons) (Figure 4).
- The ED visit rate was lowest for patients with private insurance (23 visits per 100 persons).
- A difference between the ED visit rate for patients with Medicare (45 visits per 100 persons) was observed compared with visits among uninsured patients (37 visits per 100 persons), and patients with other primary expected source of payment (39 visits per 100 persons) but these differences were not significant.
Emergency department visit rates, by primary expected source of payment: United States, 2018
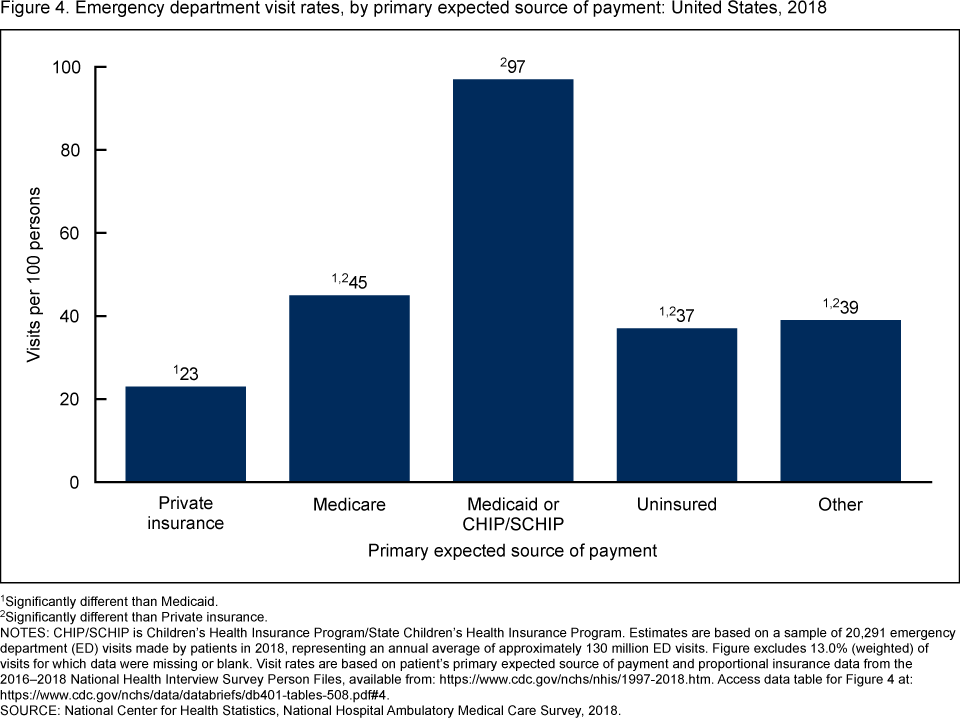
1Significantly different than Medicaid.
2Significantly different than Private insurance.
NOTES: CHIP/SCHIP is Children’s Health Insurance Program/State Children’s Health Insurance Program. Estimates are based on a sample of 20,291 emergency department (ED) visits made by patients in 2018, representing an annual average of approximately 130 million ED visits. Figure excludes 13.0% (weighted) of visits for which data were missing or blank. Visit rates are based on patient’s primary expected source of payment and proportional insurance data from the 2016–2018 National Health Interview Survey Person Files, available from: https://www.cdc.gov/nchs/nhis/1997-2018.htm. Access data table for Figure 4.
SOURCE: National Center for Health Statistics, National Hospital Ambulatory Medical Care Survey, 2018.
Summary
This report examines 2018 ED visit rates by selected characteristics and presents trends from 2007 to 2018. The overall ED visit rate and visit rates by MSA status did not change significantly between 2007–2018. The ED visit rates for infants under age 1 year was higher than the rates for all other age groups, and the rate for adults aged 75 and over was higher than the rates for all other age groups, except infants. The ED visit rate for females was higher than the rate for males. The ED visit rate for non-Hispanic black or African American persons was higher than the rates for persons from all other race and ethnic groups, and the rate for non-Hispanic persons from race groups other than white or black or African American was lower than the rate for persons from all other race and ethnic groups. The ED visit rate for patients with Medicaid was higher than the rates for all other sources of payment, and the rate for private insurance was lower than the rates for all other sources of payment. This report shows the wide variation in ED visit rates by selected characteristics.
Definitions
ED visit rates: Calculated by dividing the number of ED visits by the July 1, 2018, estimates of the civilian noninstitutionalized population of the United States (obtained from the U.S. Census Bureau’s Population Division) for selected characteristics including age, sex, and race and ethnicity. Population estimates for MSAs are based on estimates of the United States civilian noninstitutionalized population from the National Health Interview Survey, compiled according to the Office of Management and Budget definitions of core-based statistical areas. Visit rates for primary source of payment are based on patient’s primary expected source of payment and proportional insurance data from the 2016–2018 National Health Interview Survey Person files, obtained from: https://www.cdc.gov/nchs/nhis/1997-2018.htm.
Metropolitan statistical area (MSA): MSAs are defined according to the 2013 Office of Management and Budget’s definitions of core-based statistical areas. More information about MSA definitions is available from: https://www.census.gov/programs-surveys/metro-micro.html.
Primary expected source of payment: During data collection, all sources of payment were collected. For patients with more than one source of payment, the hierarchy below was used (with Medicare counted first and self-pay and no charge counted last) to collapse payments into one mutually exclusive variable (primary expected source of payment).
- Medicare: Partial or full payment by Medicare plan includes payments made directly to the hospital as well as payments reimbursed to the patient. Charges covered under a Medicare-sponsored prepaid plan are included.
- Medicaid: Partial or full payment by Medicaid plan includes payments made directly to the hospital or reimbursed to the patient. Charges covered under a Medicaid-sponsored prepaid plan (HMO) or “managed Medicaid” are included. CHIP is Children’s Health Insurance Program and SCHIP is State Children’s Health Insurance Program.
- Private: Partial or full payment by a private insurer (e.g., BlueCross BlueShield), either directly to the hospital or reimbursed to the patient. Charges covered under a private insurance sponsored prepaid plan are included.
- Self-pay or no charge: Self-pay are charges that are paid by the patient or patient’s family, which will not be reimbursed by a third party. Self-pay includes visits for which the patient is expected to be ultimately responsible for most of the bill, even if the patient never actually pays it. This does not include copayments or deductibles. No charge or charity are visits for which no fee is charged (e.g., charity, special research, or teaching).
- Other: Includes Workers’ Compensation and other sources of payment not covered by the above categories, such as TRICARE, state and local governments, private charitable organizations, and other liability insurance (e.g., automobile collision policy coverage).
Data source and methods
Data for this report are from NHAMCS, an annual nationally representative survey of nonfederal, general, and short-stay hospitals (3,4). NHAMCS provides data on the utilization and provision of ambulatory care services in hospital EDs. In 2018, the weighted NHAMCS response rate was 88.5%. Data analyses were performed using the statistical packages SAS version 9.4 (SAS Institute, Cary, N.C.), SAS-callable SUDAAN version 11.0 (RTI International, Research Triangle Park, N.C.), and Joinpoint Regression Program version 4.7.0.0. Two-tailed t tests were used to determine significant differences between ED visit rates. The significance level for statistical testing was set at p < 0.05.
About the authors
Christopher Cairns, Jill J. Ashman, and Kai Kang are with the National Center for Health Statistics, Division of Health Care Statistics.
References
- Cairns C, Kang K, Santo L. National Hospital Ambulatory Medical Care Survey: 2018 emergency department summary tables. National Center for Health Statistics. Hyattsville, MD. 2021. [Forthcoming].
- Clarke TC, Schiller JS. Early release of selected estimates based on data from the January–June 2019 National Health Interview Survey. National Center for Health Statistics. May 2020.
- National Center for Health Statistics. 2018 NHAMCS micro-data file. Hyattsville, MD. 2020.
- National Center for Health Statistics. 2018 NHAMCS micro-data file documentation. Hyattsville, MD. 2020.
Suggested citation
Cairns C, Ashman JJ, Kang K. Emergency department visit rates by selected characteristics: United States, 2018. NCHS Data Brief, no 401. Hyattsville, MD: National Center for Health Statistics. 2021. DOI: https://doi.org/10.15620/cdc:102278.
Copyright information
All material appearing in this report is in the public domain and may be reproduced or copied without permission; citation as to source, however, is appreciated.
Division of Health Care Statistics
Brian C. Moyer, Ph.D., Director
Amy M. Branum, Ph.D., Acting Associate Director for Science
Division of Health and Nutrition Examination Surveys
Carol J. DeFrances, Ph.D., Acting Director
Alexander Strashny, Ph.D., Associate Director for Science