Fruit and Vegetable Consumption Among Adults in the United States, 2015–2018
NCHS Data Brief No. 397, February 2021
PDF Version (409KB) | Visual Abstract
Nicholas Ansai, M.P.H., and Edwina A. Wambogo, Ph.D., M.S., M.P.H., R.D.
- Key findings
- What percentage of adults consumed fruit on a given day in 2015–2018, and were there differences by sex?
- What percentage of adults consumed vegetables on a given day in 2015–2018, and were there differences by sex?
- Were there differences by income in the percentage of adults who consumed fruit on a given day in 2015–2018?
- Were there differences by income in the percentage of adults who consumed vegetables on a given day in 2015–2018?
- Were there trends in the percentage of adults consuming any fruit or vegetables on a given day from 1999–2000 through 2017–2018?
Data from the National Health and Nutrition Examination Survey, 2015–2018
- More than two-thirds (67.3%) of adults aged 20 and over consumed any fruit on a given day, and fruit consumption was higher among women (70.5%) compared with men (63.8%).
- Approximately 95% of adults consumed any vegetables on a given day.
- The percentage of adults who consumed any fruit; citrus, melon, or berries; and other types of whole fruit on a given day increased with income.
- The percentage of adults who consumed dark green, red and orange, other vegetables, and any vegetable types on a given day increased with income.
- The percentage of adults who consumed any fruit on a given day decreased from 77.2% in 1999–2000 to 64.9% in 2017–2018, but there was no change in the percentage consuming any vegetables.
The Dietary Guidelines for Americans, 2015–2020 suggest that a healthy eating pattern include consuming a variety of different fruit and vegetables (1). Fruits and vegetables are sources of many essential nutrients, such as vitamins, minerals, and fiber, and consumption is associated with decreased risk of chronic disease (1–3). This report examines the percentage of adults aged 20 and over who consumed fruit and vegetables on a given day by sex and income in 2015–2018 and trends in fruit and vegetable consumption.
Keywords: diet, National Health and Nutrition Examination Survey (NHANES)
What percentage of adults consumed fruit on a given day in 2015–2018, and were there differences by sex?
In 2015–2018, more than two-thirds (67.3%) of adults aged 20 and over consumed any fruit on a given day; 29.7% consumed citrus, melons, or berries; 47.5% consumed other whole fruit; and 30.8% consumed 100% fruit juice (Figure 1).
A higher percentage of women (70.5%) compared with men (63.8%) consumed any fruit on a given day. Similarly, a higher percentage of women than men consumed citrus, melons, or berries (33.5% and 25.6%, respectively) and other whole fruit (50.3% and 44.5%). No difference was seen in the percentage of men (30.8%) and women (30.8%) who consumed 100% fruit juice.
Figure 1. Percentage of adults aged 20 and over who consumed fruit on a given day, by sex: United States, 2015–2018
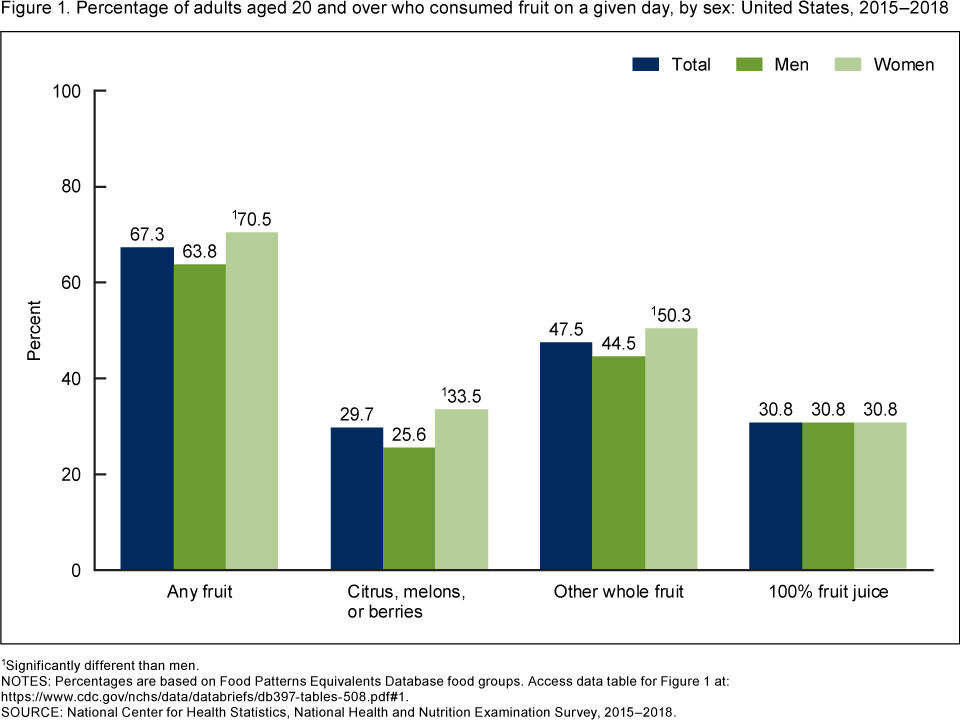
1Significantly different than men.
NOTE: Percentages are based on Food Patterns Equivalents Database food groups. Access data table for Figure 1.
SOURCE: National Center for Health Statistics, National Health and Nutrition Examination Survey, 2015–2018.
What percentage of adults consumed vegetables on a given day in 2015–2018, and were there differences by sex?
Among adults aged 20 and over, 95.1% consumed any vegetables on a given day; 26.3% consumed dark green vegetables; 79.2% consumed red and orange vegetables; 50.3% consumed starchy vegetables; and 78.8% consumed other vegetables (Figure 2).
A higher percentage of women consumed dark green (30.0%) and starchy vegetables (51.7%) on a given day, compared with men (22.3% and 48.8%, respectively). No significant differences were seen in the percentage of men and women who consumed any vegetables (95.0% for men and 95.3% for women), red and orange vegetables (79.7% for men and 78.7% for women), and other vegetables (77.6% for men and 79.9% for women).
Figure 2. Percentage of adults aged 20 and over who consumed vegetables on a given day, by sex: United States, 2015–2018
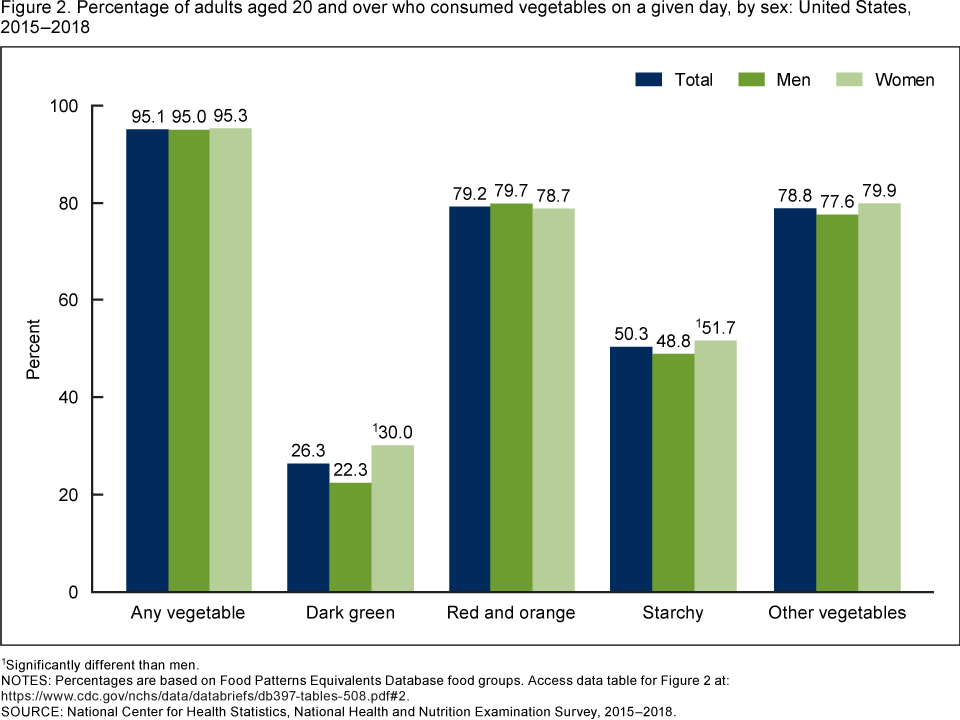
1Significantly different than men.
NOTES: Percentages are based on Food Patterns Equivalents Database food groups. Access data table for Figure 2.
SOURCE: National Center for Health Statistics, National Health and Nutrition Examination Survey, 2015–2018.
Were there differences by income in the percentage of adults who consumed fruit on a given day in 2015–2018?
The percentage of adults aged 20 and over who consumed any fruit increased with increasing family income, from 60.3% of adults from families with incomes less than 130% of the federal poverty level (FPL) to 64.5% of adults from families with incomes between 130% and 349% of FPL to 72.9% of adults from families with incomes at or greater than 350% of FPL (Figure 3).
Similarly, the percentage of adults who consumed citrus, melons, or berries (21.3%, 26.2%, and 36.6% for each income group) and other whole fruit (39.2%, 45.1%, and 53.3% for each income group), increased with increasing family income. No significant differences existed by income in the percentage of adults who consumed 100% fruit juice on a given day (31.5%, 29.7%, and 31.8% for each income group).
Figure 3. Percentage of adults aged 20 and over who consumed fruit on a given day, by income: United States, 2015–2018
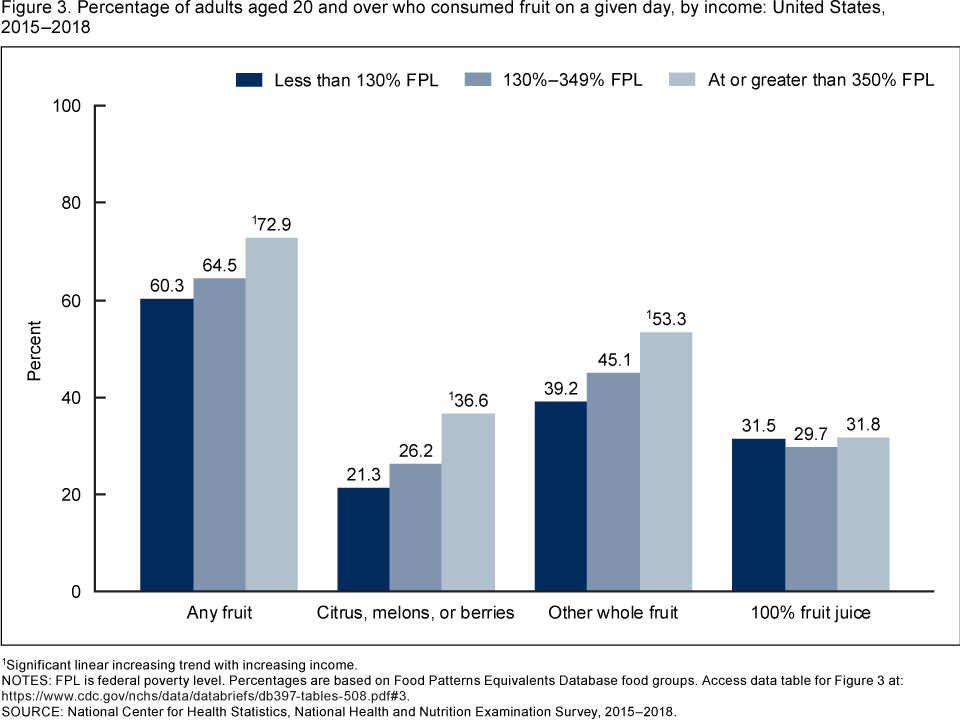
1Significant linear increasing trend with increasing income.
NOTES: FPL is federal poverty level. Percentages are based on Food Patterns Equivalents Database food groups. Access data table for Figure 3.
SOURCE: National Center for Health Statistics, National Health and Nutrition Examination Survey, 2015–2018.
Were there differences by income in the percentage of adults who consumed vegetables on a given day in 2015–2018?
The percentage of adults aged 20 and over who consumed any vegetables increased with increasing family income, from 92.5% of those from families with incomes less than 130% of FPL to 94.4% of those from families with incomes between 130% and 349% of FPL to 97.1% of those from families with incomes at or greater than 350% of FPL (Figure 4).
Likewise, the percentage of adults who consumed dark green vegetables (20.4%, 23.2%, and 32.0% for each income group), red and orange vegetables (74.7%, 78.1%, and 82.8% for each income group), and other vegetables (73.0%, 76.9%, and 83.6% for each income group), increased with increasing family income. There were no significant differences by income in the percentage of adults who consumed starchy vegetables (51.5%, 52.0%, and 48.9% for each income group).
Figure 4. Percentage of adults aged 20 and over who consumed vegetables on a given day, by income: United States, 2015–2018
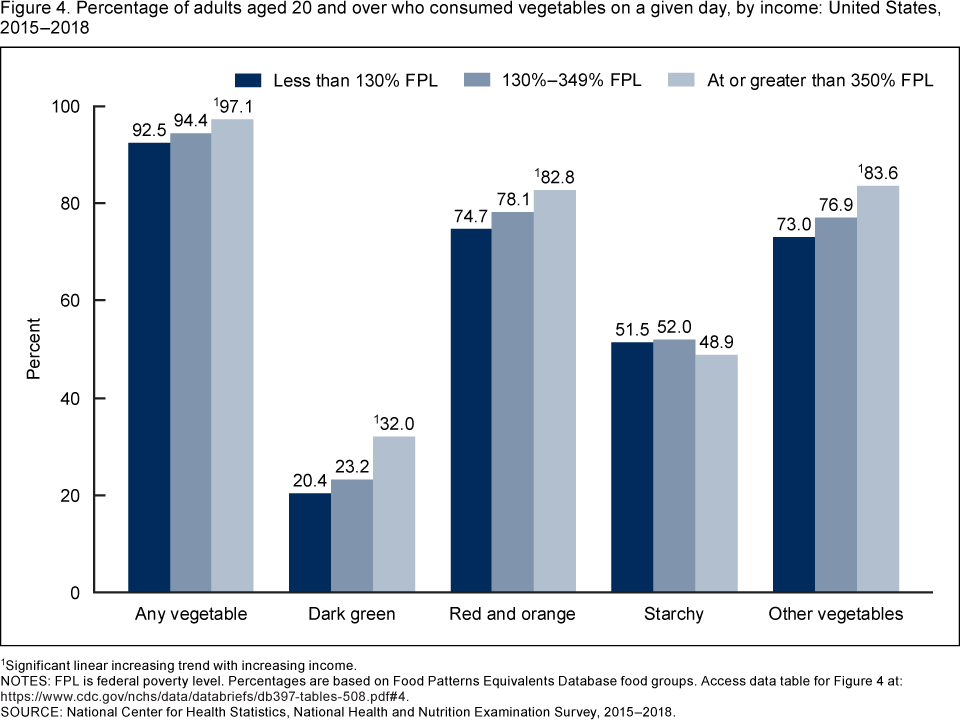
1Significant linear increasing trend with increasing income.
NOTES: FPL is federal poverty level. Percentages are based on Food Patterns Equivalents Database food groups. Access data table for Figure 4.
SOURCE: National Center for Health Statistics, National Health and Nutrition Examination Survey, 2015–2018.
Were there trends in the percentage of adults consuming any fruit or vegetables on a given day from 1999–2000 through 2017–2018?
The percentage of adults who consumed any fruit on a given day decreased from 77.2% in 1999–2000 to 64.9% in 2017–2018 (Figure 5).
There was no change in the percentage of adults who consumed any vegetables on a given day between 1999–2000 (95.3%) and 2017–2018 (95.0%).
Figure 5. Percentage of adults aged 20 and over who consumed any fruit or vegetables on a given day: United States, 1999–2000 through 2017–2018
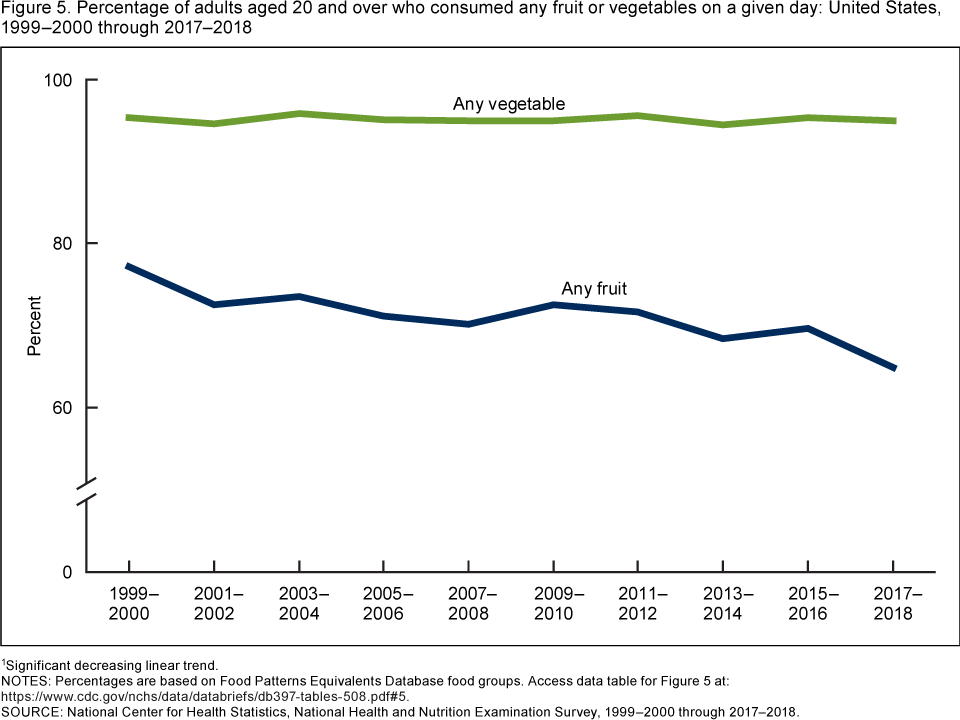
1Significant decreasing linear trend.
NOTES: Percentages are based on Food Patterns Equivalents Database food groups. Access data table for Figure 5.
SOURCE: National Center for Health Statistics, National Health and Nutrition Examination Survey, 1999–2000 through 2017–2018.
Summary
In 2015–2018, more than two-thirds of adults aged 20 and over consumed any fruit (67.3%), and approximately 95% consumed any vegetables on a given day. A higher percentage of women consumed fruit compared with men across all fruit categories except for 100% fruit juice where there was no difference by sex. Similarly, a higher percentage of women consumed dark green and starchy vegetables on a given day compared with men. Consumption of both fruits and vegetables increased with income, except for 100% fruit juice and starchy vegetables. A decrease was observed in the percentage of adults consuming any fruit on a given day between 1999–2000 through 2017–2018, but there was no change in the percentage of adults consuming any vegetables over the same time period.
Healthy People 2030 objectives include increasing the overall consumption of fruits and vegetables among people aged 2 years and over to help individuals obtain the recommended amounts of healthy and nutritious foods to reduce their risk for chronic diseases and improve their health (4).
Definitions
Food categories: Food categories were defined using the USDA’s Food Patterns Equivalents Database (FPED), formerly known as the MyPyramid Equivalents Database (MPED) (5). FPED separates all foods reported in the National Health and Nutrition Examination Survey (NHANES) into individual ingredients and assigns those ingredients to food groups and subgroups. The fruit food groups include citrus, melons, or berries; other fruit; and 100% fruit juice. The vegetable food groups include dark green vegetables (such as spinach, collard greens, and broccoli); red and orange vegetables (such as carrots, red peppers, and tomatoes); starchy vegetables (such as potatoes, plantains, and cassava); and other vegetables (such as cauliflower, string beans, and eggplant). The MPED 1.0, MPED 2.0, and FPED files from 2005–2006 through 2017–2018 were used in this analysis.
Federal poverty level: Levels are based on the income to poverty ratio, which is the ratio of annual total family income to the U.S. Department of Health and Human Services poverty guidelines, after accounting for inflation and family size (6).
Data source and methods
NHANES is a series of cross-sectional, nationally representative surveys of the civilian noninstitutionalized U.S. population administered by the National Center for Health Statistics to assess the diet, health, nutritional status, and health-related behaviors of the U.S. population. It combines an in-home interview and a standardized physical examination at a mobile examination center (MEC). Details of the NHANES study design, implementation, data sets, analytic considerations, and other documentation are available online (7).
This report uses dietary data collected via an in-person 24-hour dietary recall using the U.S. Department of Agriculture’s standardized Automated Multiple Pass Method. Dietary recalls cover foods and beverages consumed on the day (midnight to midnight) before the examination in the MEC. Limitations associated with self-reported dietary data, such as misreporting, have been described (8). Despite these limitations, dietary recalls have use in assessing population level estimates (7,9).
Data were analyzed using the day 1 dietary recall sample weights to account for differential probabilities of selection, nonresponse, noncoverage, and day of the week. The standard errors of the percentages were estimated using Taylor series linearization, a method that incorporates the sample design.
Differences between groups were evaluated using t statistics. Tests for linear trends by age and income were evaluated using orthogonal polynomials. Statistical testing was based on a p value less than 0.05 significance level. All differences reported are statistically significant unless otherwise indicated. Statistical analyses were conducted using SAS version 9.4 (SAS Institute, Cary, N.C.) and SUDAAN version 11.0 (RTI International, Research Triangle Park, N.C.).
About the authors
Nicholas Ansai and Edwina A. Wambogo are with the National Center for Health Statistics, Division of Health and Nutrition Examination Surveys.
References
- U.S. Department of Health and Human Services, U.S. Department of Agriculture. 2015–2020 Dietary Guidelines for Americans, 8th ed. 2015.
- U.S. Department of Agriculture. Nutrients and health benefits.
- Slavin JL, Lloyd B. Health benefits of fruits and vegetables. Adv Nutr 3(4):506–16. 2012.
- U.S. Department of Health and Human Services, Office of Disease Prevention and Health Promotion. Healthy People 2020 topics and objectives: Nutrition and weight status. 2020.
- Bowman SA, Clemens JC, Shimizu M, Friday JE, Moshfegh AJ. Food patterns equivalents database 2015–2016: Methodology and user guide. Beltsville, MD: Food Surveys Research Group, Beltsville Human Nutrition Research Center. 2018.
- Chen TC, Clark J, Riddles MK, Mohadjer LK, Fakhouri THI. National Health and Nutrition Examination Survey, 2015–2018: Sample design and estimation procedures. National Center for Health Statistics. Vital Health Stat 2(184). 2020.
- Ahluwalia N, Dwyer J, Terry A, Moshfegh A, Johnson C. Update on NHANES dietary data: Focus on collection, release, analytical considerations, and uses to inform public policy. Adv Nutr 7(1):121–34. 2016.
- Subar AF, Freedman LS, Tooze JA, Kirkpatrick SI, Boushey C, Neuhouser ML, et al. Addressing current criticism regarding the value of self-report dietary data. J Nutr 145(12):2639–45. 2015.
- Hébert JR, Hurley TG, Steck SE, Miller DR, Tabung FK, Peterson KE, et al. Considering the value of dietary assessment data in informing nutrition-related health policy. Adv Nutr 5(4):447–55. 2014.
Suggested citation
Ansai N, Wambogo EA. Fruit and vegetable consumption among adults in the United States, 2015–2018. NCHS Data Brief, no 397. Hyattsville, MD: National Center for Health Statistics. 2021. DOI: https://dx.doi.org/10.15620/cdc:100470.
Copyright information
All material appearing in this report is in the public domain and may be reproduced or copied without permission; citation as to source, however, is appreciated.
National Center for Health Statistics
Brian C. Moyer, Ph.D., Director
Amy M. Branum, Ph.D., Acting Associate Director for Science
Division of Health and Nutrition Examination Surveys
Ryne Paulose-Ram, M.A., Ph.D., Acting Director
Lara J. Akinbami, M.D., Acting Associate Director for Science