Urgent Care Center and Retail Health Clinic Utilization Among Children: United States, 2019
- Key findings
- What percentage of children had one or more urgent care center or retail health clinic visits in the past 12 months?
- Did urgent care center or retail health clinic utilization differ by sex, age, or race and Hispanic origin?
- Did urgent care center or retail health clinic utilization differ by current health insurance?
- Did urgent care center or retail health clinic utilization differ by parental education or poverty status?
- Summary
- Definitions
- Data source and methods
- About the authors
- References
- Suggested citation
PDF Version (515 KB)
Key findings
Data from the National Health Interview Survey
- In 2019, more than one in four children had one or more visits to an urgent care center or retail health clinic (26.4%) in the past 12 months.
- Non-Hispanic white children (29.2%) were more likely than either non-Hispanic black (24.9%) or Hispanic (22.6%) children to have had one or more urgent care center or retail health clinic visits.
- Children with private (27.6%) or public (25.2%) health insurance were more likely than uninsured children (19.3%) to have had one or more urgent care center or retail health clinic visits.
- Urgent care center and retail health clinic utilization increased with increasing parental education and family income.
In recent years, urgent care centers and health clinics within grocery or retail stores have been delivering health care services to an increasing number of children and adults (1–3). Urgent care centers and retail health clinics may be able to deliver preventive care, such as routine vaccinations, and nonemergency acute or after-hours care (3–5). This report describes the utilization of urgent care centers or retail health clinics in 2019 among children aged 0–17 years in the past 12 months by selected characteristics.
Keywords: health care utilization, acute care, National Health Interview Survey (NHIS)
What percentage of children had one or more urgent care center or retail health clinic visits in the past 12 months?
In 2019, approximately one in four children had one or more urgent care or retail health clinic visits in the past 12 months (26.4%) (Figure 1). Nearly 14% of children had one urgent care or retail health clinic visit (13.7%), while 8.2% had two visits and 4.5% had three or more visits.
Figure 1. Percentage of children aged 0–17 years who had one or more urgent care center or retail health clinic visits, and number of visits, in past 12 months: United States, 2019
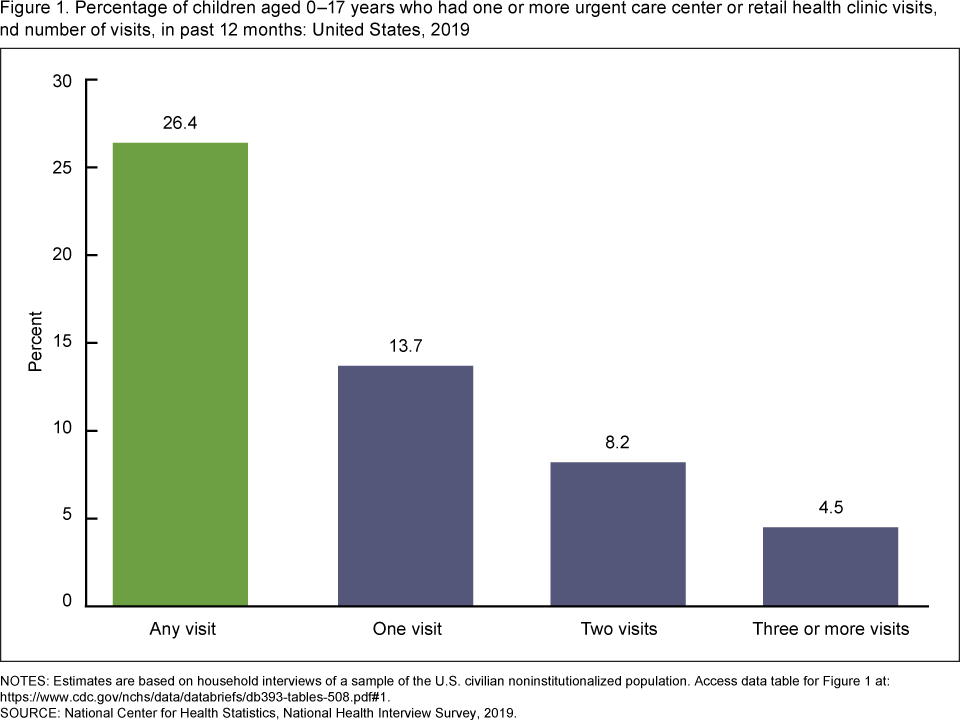
NOTES: Estimates are based on household interviews of a sample of the U.S. civilian noninstitutionalized population. Access data table for Figure 1.
SOURCE: National Center for Health Statistics, National Health Interview Survey, 2019.
Did urgent care center or retail health clinic utilization differ by sex, age, or race and Hispanic origin?
A similar percentage of girls (26.5%) and boys (26.2%) had one or more urgent care or retail health clinic visits in the past 12 months (Figure 2). Children aged 12–17 years were less likely to have had one or more urgent care or retail health clinic visits (24.9%) compared with children aged 6–11 years (27.9%), but were not significantly different from children aged 0–5 years (26.4%). Non-Hispanic black (24.9%) and Hispanic (22.6%) children were less likely to have had one or more urgent care or retail health clinic visits compared with non-Hispanic white children (29.2%).
Figure 2. Percentage of children aged 0–17 years who had one or more urgent care center or retail health clinic visits in past 12 months, by sex, age, and race and Hispanic origin: United States, 2019
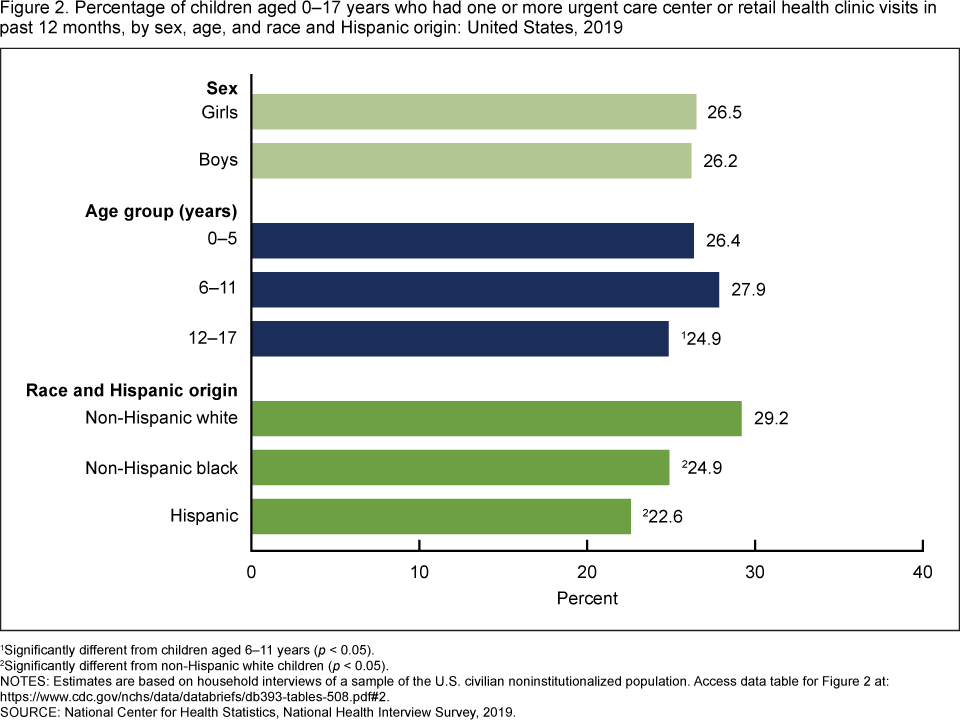
1Significantly different from children aged 6–11 years (p < 0.05).
2Significantly different from non-Hispanic white children (p < 0.05).
NOTES: Estimates are based on household interviews of a sample of the U.S. civilian noninstitutionalized population. Access data table for Figure 2.
SOURCE: National Center for Health Statistics, National Health Interview Survey, 2019.
Did urgent care center or retail health clinic utilization differ by current health insurance?
Children who were uninsured (19.3%) were less likely to have had one or more urgent care or retail health clinic visits in the past 12 months than children with private insurance (27.6%) or public insurance (25.2%) coverage (Figure 3).
Figure 3. Percentage of children aged 0–17 years who had one or more urgent care center or retail health clinic visits in past 12 months, by current health insurance coverage: United States, 2019
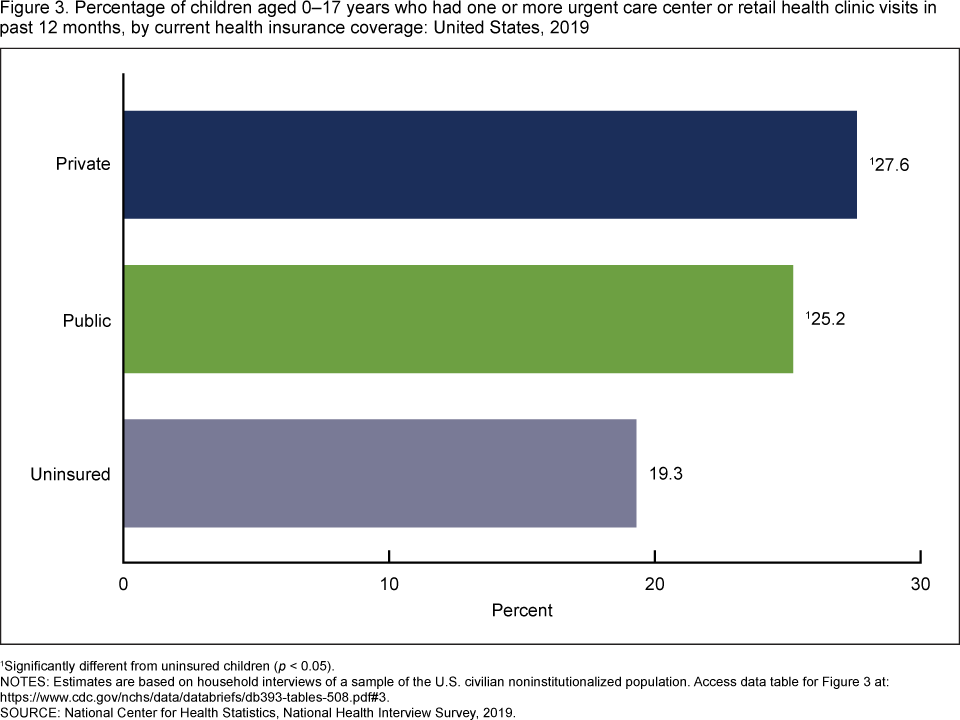
1Significantly different from uninsured children (p < 0.05).
NOTES: Estimates are based on household interviews of a sample of the U.S. civilian noninstitutionalized population. Access data table for Figure 3.
SOURCE: National Center for Health Statistics, National Health Interview Survey, 2019.
Did urgent care center or retail health clinic utilization differ by parental education or poverty status?
Children with parents who had more than a high school education (28.1%) were more likely than children with parents who had a high school diploma or GED or less (22.1%) to have had one or more urgent care or retail health clinic visits in the past 12 months (Figure 4). Children living in families with incomes equal to or greater than 200% of the federal poverty level (FPL) (28.1%) were more likely to have had one or more urgent care or retail health clinic visits than children living in families below 200% of FPL (23.8%).
Figure 4. Percentage of children aged 0–17 years who had one or more urgent care center or retail health clinic visits in past 12 months, by parental education and poverty status: United States, 2019
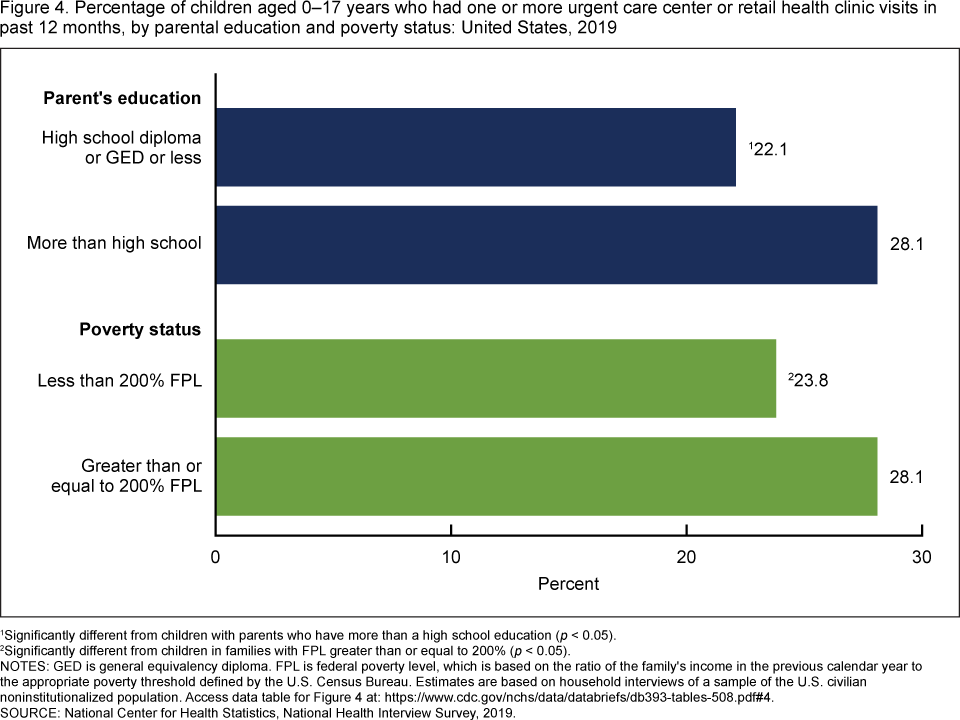
1Significantly different from children with parents who have more than a high school education (p < 0.05).
2Significantly different from children in families with FPL greater than or equal to 200% (p < 0.05).
NOTES: GED is general equivalency diploma. FPL is federal poverty level, which is based on the ratio of the family’s income in the previous calendar year to the appropriate poverty threshold defined by the U.S. Census Bureau. Estimates are based on household interviews of a sample of the U.S. civilian noninstitutionalized population. Access data table for Figure 4.
SOURCE: National Center for Health Statistics, National Health Interview Survey, 2019.
Summary
In 2019, just over one in four U.S. children had one or more visits to an urgent care center or retail health clinic (26.4%) in the past 12 months. Utilization varied by age group and race and Hispanic origin. Children who had private or public health insurance coverage were more likely to have had one or more visits to urgent care or retail health clinics compared with children who were uninsured. Urgent care center and retail health clinic utilization increased with increasing parental education and family income, a pattern consistent with previous studies (6). The level of convenience in accessing health care may be a factor for parents when choosing to seek care for their children at urgent care centers and retail health clinics (6,7).
Definitions
Health insurance coverage: Based on the status of health insurance coverage at time of interview. Private health insurance includes children with comprehensive private insurance plans obtained through a parent’s or caregiver’s employer, purchased directly, purchased through local or community programs, or purchased through the Health Insurance Marketplace or a state-based exchange. Public health insurance includes children with Medicaid, Children’s Health Insurance Program, or other state-sponsored health plan. Uninsured children include those who were not reported to have been covered at time of interview and those who were covered only by Indian Health Service or a single-service plan (e.g., dental care only). Children with more than one type of health insurance were assigned to the first appropriate category in the following mutually exclusive hierarchy: private coverage, public coverage, other coverage (data not shown), or uninsured.
Parental education attainment: Based on the education level of the parent with the highest level of education, regardless of that parent’s age, living at the child’s residence.
Poverty status: Based on the ratio of a family’s income in the previous calendar year to the appropriate poverty threshold (given the family’s size and number of children) defined by the U.S. Census Bureau. The 2019 National Health Interview Survey (NHIS) imputed income files were used to allow for imputed values when family income was not provided.
Race and Hispanic origin: Children categorized as Hispanic may be of any race or combination of races. Children categorized as non-Hispanic white or non-Hispanic black indicated one race only. Estimates for non-Hispanic children of races other than white only or black only, or of multiple races, are not shown.
Urgent care: Based on responses to the survey question, “During the past 12 months, how many times has (Sample Child) gone to an urgent care center or a clinic in a drug store or grocery store about his or her health?”
Data source and methods
Data from the 2019 NHIS were used for this analysis. NHIS is a nationally representative household survey of the U.S. civilian noninstitutionalized population. It is conducted continuously throughout the year by the National Center for Health Statistics (NCHS). Interviews are conducted in respondents’ homes, but follow-ups to complete interviews may be conducted over the telephone. Questions about the child’s health are answered by a knowledgeable adult, usually a parent. For more information about NHIS, visit: https://www.cdc.gov/nchs/nhis.htm.
Point estimates and corresponding confidence intervals for this analysis were calculated using SUDAAN software (8) to account for the complex sample design of NHIS. Differences between percentages were evaluated using two-sided significance tests at the 0.05 level. Linear and quadratic trends by age group were evaluated using Proc Descript, poly option. All estimates meet NCHS standards of reliability as specified in “National Center for Health Statistics Data Presentation Standards for Proportions” (9).
About the authors
Lindsey I. Black and Benjamin Zablotsky are with the NCHS Division of Health Interview Statistics.
References
- Poon SJ, Schuur JD, Mehrotra A. Trends in visits to acute care venues for treatment of low-acuity conditions in the United States from 2008 to 2015. JAMA Intern Med 178(10):1342–9. 2018.
- Mehrotra A, Wang MC, Lave JR, Adams JL, McGlynn EA. A comparison of patient visits to retail clinics, primary care physicians, and emergency departments. Health Aff (Millwood) 27(5):1272–82. 2008.
- AMN Healthcare. Convenient care: Growth and staffing trends in urgent care and retail medicine [white paper]. 2015.
- Sankrithi U, Schor J. Pediatric urgent care—new and evolving paradigms of acute care. Pediatr Clin North Am 65(6):1257–68. 2018.
- Montalbano A, Rodean J, Kangas J, Lee B, Hall M. Urgent care and emergency department visits in the pediatric Medicaid population. Pediatrics 137(4):e20153100. 2016.
- Garbutt JM, Mandrell KM, Allen M, Sterkel R, Epstein J, Kreusser K, et al. Parents’ experiences with pediatric care at retail clinics. JAMA Pediatr 167(9):845–50. 2013.
- Mudd SS, Alvarado SM, Otaru S, Canares T. Urgent care utilization in a pediatric population with private health insurance. J Pediatr Health Care 34(3):e21–7. 2020.
- RTI International. SUDAAN (Release 11.0.3) [computer software]. 2018.
- Parker JD, Talih M, Malec DJ, Beresovsky V, Carroll M, Gonzalez JF Jr, et al. National Center for Health Statistics data presentation standards for proportions. National Center for Health Statistics. Vital Health Stat 2(175). 2017.
Suggested citation
Black LI, Zablotsky B. Urgent care center and retail health clinic utilization among children: United States, 2019. NCHS Data Brief, no 393. Hyattsville, MD: National Center for Health Statistics. 2020.
Copyright information
All material appearing in this report is in the public domain and may be reproduced or copied without permission; citation as to source, however, is appreciated.
National Center for Health Statistics
Brian C. Moyer, Ph.D., Director
Amy M. Branum, Ph.D., Acting Associate Director for Science
Division of Health Interview Statistics
Stephen J. Blumberg, Ph.D., Director
Anjel Vahratian, Ph.D., M.P.H., Associate Director for Science