Fruit and Vegetable Consumption Among Children and Adolescents in the United States, 2015–2018
- Key findings
- What percentage of children and adolescents consumed fruit on a given day in 2015–2018, and were there differences by age?
- What percentage of children and adolescents consumed vegetables on a given day in 2015–2018, and were there differences by age?
- Were there differences by income in the percentage of children and adolescents who consumed fruit on a given day in 2015–2018?
- Were there differences by income in the percentage of children and adolescents who consumed vegetables on a given day in 2015–2018?
- Summary
- Definitions
- Data source and methods
- About the authors
- References
- Suggested citation
PDF Version (414 KB)
Key findings
Data from the National Health and Nutrition Examination Survey, 2015–2018
- In 2015–2018, approximately three-quarters of children and adolescents aged 2–19 (75.3%) consumed fruit on a given day.
- The percentage of children and adolescents who consumed any fruit on a given day decreased with age.
- A little more than 90% of children and adolescents aged 2–19 consumed vegetables on a given day.
- The percentage of children and adolescents who consumed any fruit on a given day increased with income, from 72.1% of those from families with income less than 130% of the federal poverty level (FPL) to 79.6% of those from families with income equal to or above 350% of FPL.
The Dietary Guidelines for Americans (DGA), 2015–2020 (1), recommends consuming different types of vegetables, including dark green, red or orange, starchy, and other vegetables, and fruit, especially whole fruit. Fruits and vegetables are part of healthy eating patterns; they are sources of many essential nutrients, fiber and phytochemicals, and are associated with decreased risk of chronic diseases (1–3). This report examines the percentage of children and adolescents aged 2–19 who consumed fruits and vegetables on a given day in 2015–2018.
Keywords: diet, National Health and Nutrition Examination Survey (NHANES)
What percentage of children and adolescents consumed fruit on a given day in 2015–2018, and were there differences by age?
In 2015–2018, approximately three-quarters (75.3%) of children and adolescents aged 2–19 consumed any fruit on a given day; 32.1% consumed citrus, melons, or berries, 49.7% consumed other whole fruit, and 46.9% consumed fruit juice (Figure 1).
The percentage of children and adolescents who consumed any fruit on a given day decreased with age. Approximately 90% of children aged 2–5 consumed any fruit, compared with 80.6% of children aged 6–11 and 64.3% of adolescents aged 12–19.
Similarly, there was a decreasing trend with age in the percentage of children and adolescents who consumed citrus, melons, or berries, from 45.2% of children aged 2–5, to 37.5% of children aged 6–11, and 21.9% of adolescents aged 12–19. The percentage of children and adolescents who consumed other whole fruit decreased from 67.7% of children aged 2–5, to 54.3% of children aged 6–11, and 37.7% of adolescents aged 12–19. Finally, for fruit juice the percentage decreased from 62.1% of children aged 2–5, to 51.4% of children aged 6–11, and 36.4% of adolescents aged 12–19.
Figure 1: Percentage of children and adolescents aged 2–19 who consumed fruit on a given day, by age: United States, 2015–2018
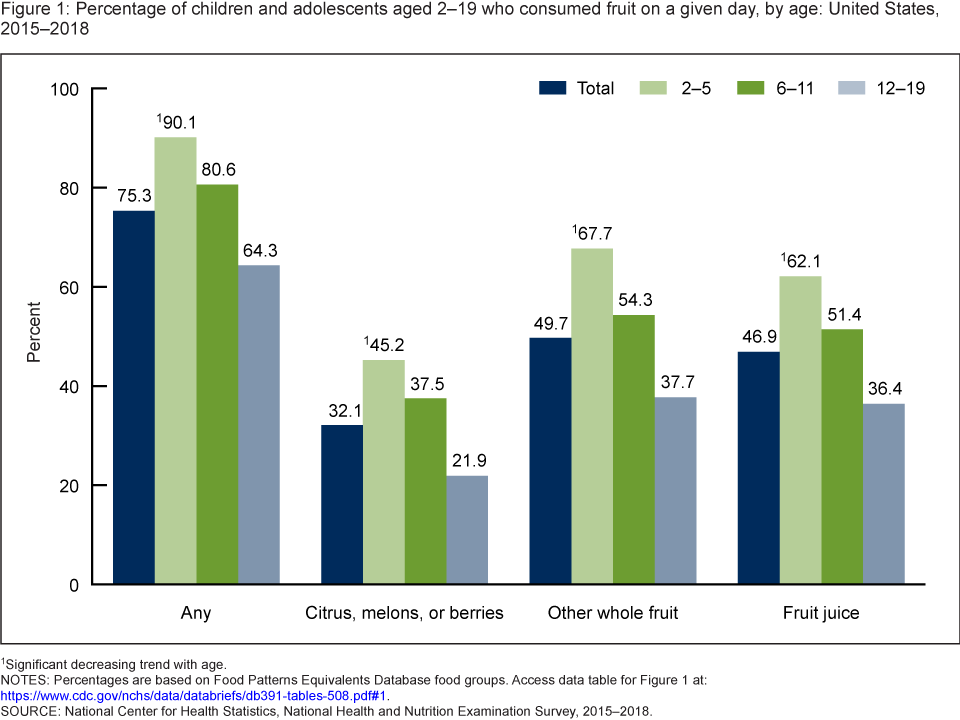
1Significant decreasing trend with age.
NOTES: Percentages are based on Food Patterns Equivalents Database food groups. Access data table for Figure 1.
SOURCE: National Center for Health Statistics, National Health and Nutrition Examination Survey, 2015–2018.
What percentage of children and adolescents consumed vegetables on a given day in 2015–2018, and were there differences by age?
In 2015–2018, more than 90% (91.0%) of children and adolescents aged 2–19 consumed any vegetables on a given day: 16.7% consumed dark green vegetables, 75.0% consumed red or orange vegetables, 47.5% consumed starchy vegetables (such as potatoes), and 55.7% consumed other vegetables (Figure 2).
No differences existed, by age, in the percentage of children and adolescents who consumed any vegetables on a given day. However, the percentage of children and adolescents who consumed dark green vegetables on a given day increased with age, from 13.9% of children aged 2–5 to 18.5% of adolescents aged 12–19. The percentage who consumed starchy vegetables on a given day decreased with age, from 50.9% of children aged 2–5 to 45.6% of adolescents aged 12–19.
More adolescents aged 12–19 (77.5%) consumed red and orange vegetables, compared with children aged 6–11 (72.7%). The difference between adolescents and children aged 2–5 (73.6%) was not significant.
Figure 2: Percentage of children and adolescents aged 2–19 who consumed vegetables on a given day, by age: United States, 2015–2018
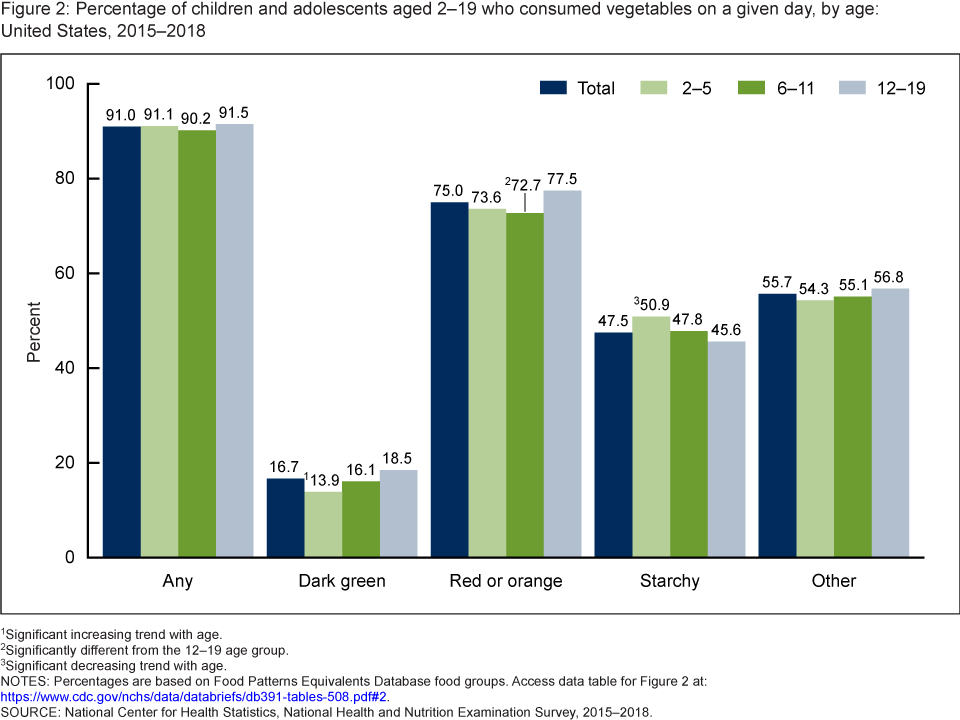
1Significant increasing trend with age.
2Significantly different from the 12–19 age group.
3Significant decreasing trend with age.
NOTES: Percentages are based on Food Patterns Equivalents Database food groups. Access data table for Figure 2.
SOURCE: National Center for Health Statistics, National Health and Nutrition Examination Survey, 2015–2018.
Were there differences by income in the percentage of children and adolescents who consumed fruit on a given day in 2015–2018?
The percentage of children and adolescents aged 2–19 who consumed any fruit on a given day increased with increasing family income (Figure 3). Among families with incomes less than 130% of the federal poverty level (FPL), 72.1% of children and adolescents consumed any fruit on a given day, increasing to 79.6% of those from families with incomes at or above 350% of the FPL.
The percentage of children and adolescents aged 2–19 who consumed citrus, melon, or berries also increased with increasing family income, from 25.4% of those from families with incomes less than 130% of the FPL to 39.8% of those from families with incomes at or above 350% of the FPL. Similarly, the percentage of children and adolescents aged 2–19 who consumed other types of whole fruit increased with increasing family income, from 44.5% of those from families with incomes less than 130% of the FPL to 54.1% of those from families with incomes at or above 350% of the FPL.
No significant differences existed, by income, in the percentage of children and adolescents aged 2–19 who consumed fruit juice on a given day (48.7% of those from families with incomes less than 130% of the FPL, 44.5% of those from families with incomes between 130%–350% of the FPL, and 47.6% of those from families with incomes at or above 350% of the FPL).
Figure 3: Percentage of children and adolescents aged 2–19 who consumed fruit on a given day, by income: United States, 2015–2018
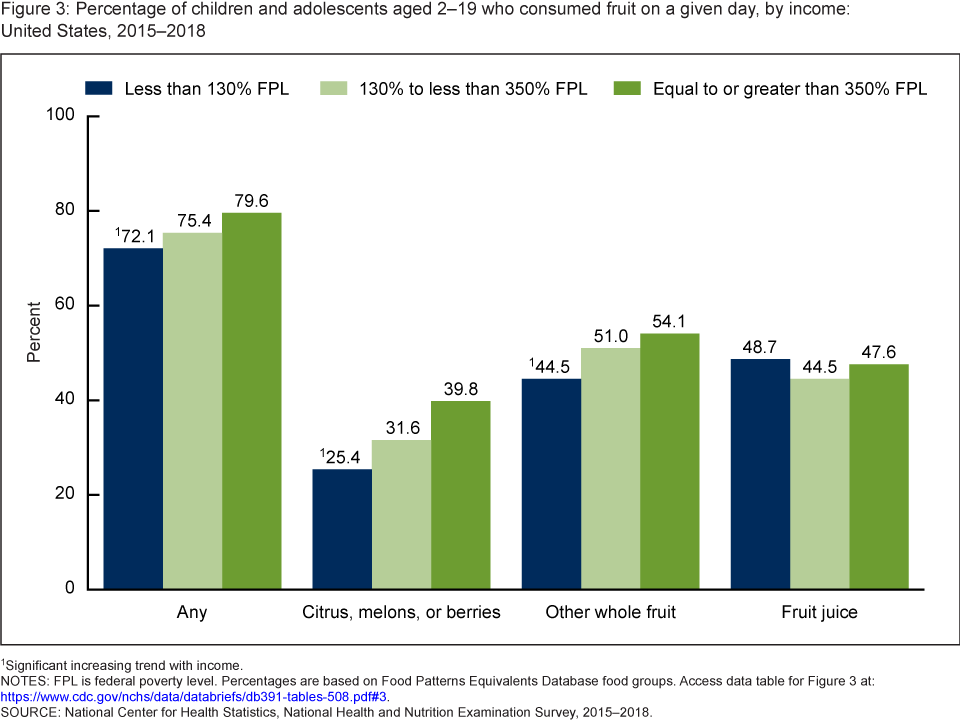
1Significant increasing trend with income.
NOTES: FPL is federal poverty level. Percentages are based on Food Patterns Equivalents Database food groups. Access data table for Figure 3.
SOURCE: National Center for Health Statistics, National Health and Nutrition Examination Survey, 2015–2018.
Were there differences by income in the percentage of children and adolescents who consumed vegetables on a given day in 2015–2018?
More than 90% (91.0%) of children and adolescents from families with incomes less than 130% of the FPL consumed any vegetables, compared with 89.7% of those from families with incomes between 130%–350% of the FPL, and 93.2% of those from families with incomes at or above 350% of the FPL (Figure 4). None of these differences were statistically significant.
Similarly, no significant differences existed by income in the percentage of children and adolescents aged 2–19 who consumed red and orange vegetables (74.6%, 74.8%, and 77.0% for each income group), starchy vegetables (49.8%, 46.7%, and 46.4%) and other vegetables (57.1%, 53.6%, and 56.3%).
However, the percentage of children and adolescents who consumed dark green vegetables on a given day increased with increasing family income. Among families with incomes less than 130% of the FPL, 13.6% of children and adolescents consumed dark green vegetables, increasing to 22.6% of those from families with incomes at or above 350% of the FPL.
Figure 4: Percentage of children and adolescents aged 2–19 who consumed vegetables on a given day, by income: United States, 2015–2018
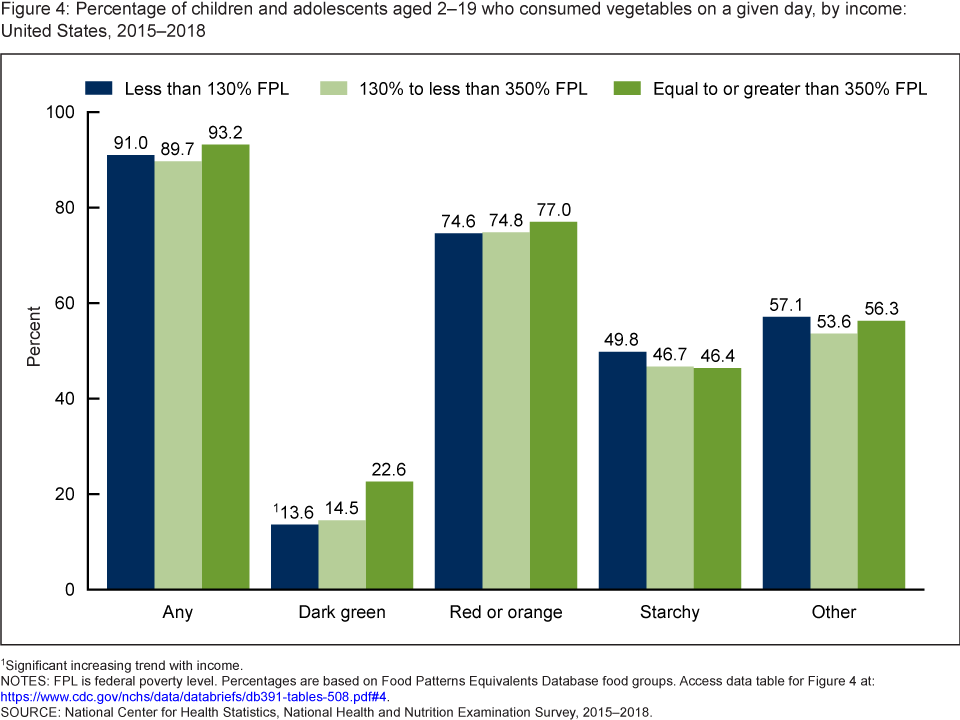
1Significant increasing trend with income.
NOTES: FPL is federal poverty level. Percentages are based on Food Patterns Equivalents Database food groups. Access data table for Figure 4.
SOURCE: National Center for Health Statistics, National Health and Nutrition Examination Survey, 2015–2018.
Summary
In 2015–2018, more than three-quarters of children and adolescents aged 2–19 consumed fruit, and approximately 90% consumed vegetables on a given day. Consumption of fruit declined with age but increased with family income, while there was no difference by these characteristics in the percentage of children and adolescents who consumed vegetables. Just under one-third of children and adolescents (32%) reported consuming citrus, melons, and berries. Approximately 17% reported consuming dark green vegetables, while three-quarters consumed red and orange vegetables.
The U.S. Department of Agriculture’s MyPlate plan (2), a food pattern consistent with the DGA, 2015–2020 (1), states that one-half of the plate should be fruits and vegetables. Overall, the dietary guidelines encourage a variety of fruits and vegetables. While it is not necessary to consume all different groups of fruits and vegetables in a day, varying the types consumed is a way to meet daily intake recommendations (1,4).
Definitions
Food categories: Food categories are from the USDA’s Food Patterns Equivalents Database (FPED) (5). FPED disaggregates all foods reported in NHANES to individual ingredients and assigns those ingredients to food groups and subgroups. Fruit food groups included citrus, melons, berries; other fruit; and fruit juice. Vegetable food groups included dark green vegetables (such as spinach, collard greens, and broccoli), red and orange vegetables (such as carrots, red peppers, and tomatoes), starchy vegetables (such as potatoes, plantains, and cassava), and other vegetables (such as cauliflower, string beans, and eggplants). The 2015–2016 FPED files were used in this analysis. Foods from 2017–2018 not included in the 2015–2016 FPED files were manually coded, representing 2.7% of foods reported in 2015–2018.
Federal poverty level: Levels were based on the income to poverty ratio, a measure of the annual total family income divided by the U.S. Department of Health and Human Services poverty guidelines, after accounting for inflation and family size (6).
Data source and methods
NHANES data for 2015–2018 were used for these analyses. NHANES is a series of cross-sectional, nationally representative surveys of the civilian noninstitutionalized U.S. population. NHANES is administered by the National Center for Health Statistics to assess the diet, health, nutrition status, and health-related behaviors of the U.S. population. It combines an in-home interview and a standardized physical examination at a mobile examination center (MEC). Details of the NHANES study design, implementation, data sets, analytic considerations, and other documentation are available online (7).
This report uses dietary data collected via an in-person 24-hour dietary recall using the U.S. Department of Agriculture’s standardized Automated Multiple Pass Method (AMPM). Dietary recalls cover foods and beverages consumed on the day (midnight to midnight) prior to the examination in the MEC. Survey participants aged 12 and over completed dietary interviews on their own, parents or guardians assisted children aged 6 to 11, and parents or guardians reported intakes for children aged 5 or under. Limitations associated with self-report dietary data, such as misreporting, have been described (8). Despite these limitations, dietary recalls have utility in assessing population level estimates (7,9).
Data were analyzed using the day 1 dietary recall sample weights to account for differential probabilities of selection, nonresponse, and noncoverage. The standard errors of the percentages were estimated using Taylor series linearization, a method that incorporates the sample design.
Differences between groups were evaluated using t statistics. Tests for linear trends by age and income were evaluated using orthogonal polynomials. All significance levels for statistical testing were at the p less than 0.05 significance level. All differences reported are statistically significant unless otherwise indicated. Statistical analyses were conducted using SAS version 9.4 (SAS Institute, Cary, N.C.) and SUDAAN version 11.0 (RTI International, Research Triangle Park, N.C.).
About the authors
Edwina A. Wambogo, Nicholas Ansai, Namanjeet Ahluwalia, and Cynthia L. Ogden are with the National Center for Health Statistics, Division of Health and Nutrition Examination Surveys.
References
- U.S. Department of Health and Human Services, U.S. Department of Agriculture. 2015–2020 Dietary Guidelines for Americans, 8th ed. 2015.
- U.S. Department of Agriculture. Nutrients and health benefits.
- Slavin JL, Lloyd B. Health benefits of fruits and vegetables. Adv Nutr 3(4):506–16. 2012.
- Liu RH. Health-promoting components of fruits and vegetables in the diet. Adv Nutr 4(3):384–92. 2013.
- U.S. Department of Agriculture. Food Patterns Equivalents Database 2015–2016: Methodology and user guide. 2018.
- Chen TC, Clark J, Riddles MK, Mohadjer LK, Fakhouri THI. National Health and Nutrition Examination Survey, 2015–2018: Sample design and estimation procedures. National Center for Health Statistics. Vital Health Stat 2(184). 2020.
- Ahluwalia N, Dwyer J, Terry A, Moshfegh A, Johnson C. Update on NHANES dietary data: Focus on collection, release, analytical considerations, and uses to inform public policy. Adv Nutr 7(1):121–34. 2016.
- Subar AF, Freedman LS, Tooze JA, Kirkpatrick SI, Boushey C, Neuhouser ML, et al. Addressing current criticism regarding the value of self-report dietary data. J Nutr 145(12):2639–45. 2015.
- Hébert JR, Hurley TG, Steck SE, Miller DR, Tabung FK, Peterson KE, et al. Considering the value of dietary assessment data in informing nutrition-related health policy. Adv Nutr 5(4):447–55. 2014.
Suggested citation
Wambogo EA, Ansai N, Ahluwalia N, Ogden CL. Fruit and vegetable consumption of children and adolescents in the United States, 2015–2018. NCHS Data Brief, no 391. Hyattsville, MD: National Center for Health Statistics. 2020.
Copyright information
All material appearing in this report is in the public domain and may be reproduced or copied without permission; citation as to source, however, is appreciated.
National Center for Health Statistics
Brian C. Moyer, Ph.D., Director
Amy M. Branum, Ph.D., Acting Associate Director for Science
Division of Health and Nutrition Examination Surveys
Ryne Paulose-Ram, M.A., Ph.D., Director
Lara J. Akinbami, M.D., Acting Associate Director for Science