Chronic Pain and High-impact Chronic Pain Among U.S. Adults, 2019
- Key findings
- The percentage of adults who had chronic pain and high-impact chronic pain in the past 3 months was higher for women than for men.
- The percentage of adults who had chronic pain and high-impact chronic pain in the past 3 months varied by age group.
- The percentage of adults who had chronic pain and high-impact chronic pain in the past 3 months varied by race and Hispanic origin.
- The percentage of adults who had chronic pain and high-impact chronic pain in the past 3 months varied by urbanization level.
- Summary
- Definitions
- Data source and methods
- About the authors
- References
- Suggested citation
PDF Version (428 KB)
Key findings
Data from the National Health Interview Survey
- In 2019, 20.4% of adults had chronic pain and 7.4% of adults had chronic pain that frequently limited life or work activities (referred to as high impact chronic pain) in the past 3 months.
- Chronic pain and high-impact chronic pain both increased with age and were highest among adults aged 65 and over.
- Non-Hispanic white adults (23.6%) were more likely to have chronic pain compared with non-Hispanic black (19.3%), Hispanic (13.0%), and non-Hispanic Asian (6.8%) adults.
- The percentage of adults with chronic pain and high-impact chronic pain increased as place of residence became more rural.
Chronic pain (1) and chronic pain that frequently limits life or work activities, referred to in this report as high-impact chronic pain (2), are among the most common reasons adults seek medical care (3) and are associated with decreased quality of life, opioid dependence, and poor mental health (1,4,5). This report examines chronic pain and high-impact chronic pain in the past 3 months among U.S. adults aged 18 and over by selected demographic characteristics and urbanization level.
Keywords: pain, health disparities, urban-rural, National Health Interview Survey (NHIS)
The percentage of adults who had chronic pain and high-impact chronic pain in the past 3 months was higher for women than for men.
- Overall, the prevalence of chronic pain was 20.4%, and the prevalence of high-impact chronic pain was 7.4% (Figure 1).
- Women were more likely to have chronic pain (21.7%) and high-impact chronic pain (8.5%) compared with men (19.0% and 6.3%, respectively).
Figure 1. Percentage of adults aged 18 and over with chronic pain and high-impact chronic pain in the past 3 months, overall and by sex: United States, 2019
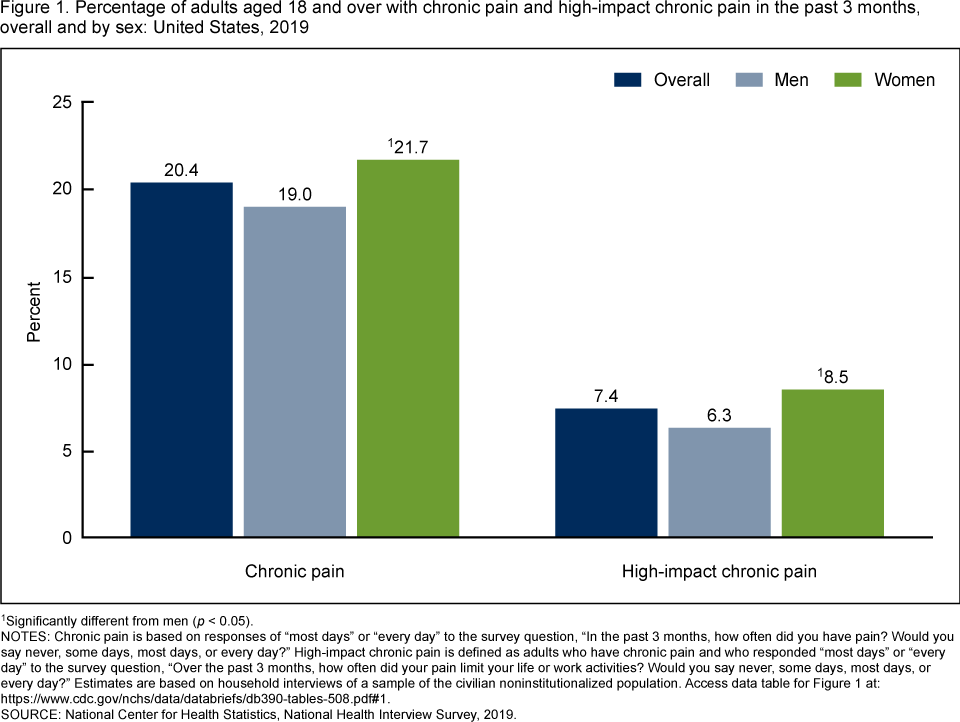
1Significantly different from men (p < 0.05).
NOTES: Chronic pain is based on responses of “most days” or “every day” to the survey question, “In the past 3 months, how often did you have pain? Would you say never, some days, most days, or every day?” High-impact chronic pain is defined as adults who have chronic pain and who responded “most days” or “every day” to the survey question, “Over the past 3 months, how often did your pain limit your life or work activities? Would you say never, some days, most days, or every day?” Estimates are based on household interviews of a sample of the civilian noninstitutionalized population. Access data table for Figure 1.
SOURCE: National Center for Health Statistics, National Health Interview Survey, 2019.
The percentage of adults who had chronic pain and high-impact chronic pain in the past 3 months varied by age group.
- The percentage of adults who had chronic pain in the past 3 months increased with age and was higher among those aged 45–64 (25.8%) and 65 and over (30.8%) compared with those aged 18–29 (8.5%) and 30–44 (14.6%) (Figure 2).
- Similarly, the percentage of adults who had high-impact chronic pain in the past 3 months increased with age and was also higher among those aged 45–64 (10.3%) and 65 and over (11.8%) compared with those aged 18–29 (2.2%) and 30–44 (4.4%).
Figure 2. Percentage of adults aged 18 and over with chronic pain and high-impact chronic pain in the past 3 months, by age group: United States, 2019
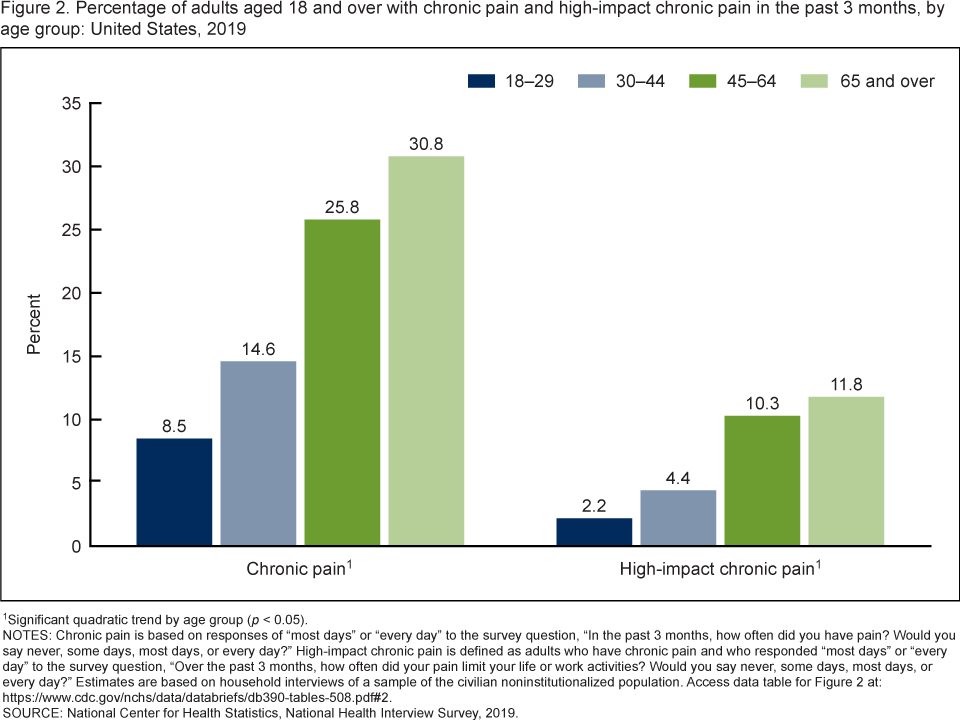
1Significant quadratic trend by age group (p < 0.05).
NOTES: Chronic pain is based on responses of “most days” or “every day” to the survey question, “In the past 3 months, how often did you have pain? Would you say never, some days, most days, or every day?” High-impact chronic pain is defined as adults who have chronic pain and who responded “most days” or “every day” to the survey question, “Over the past 3 months, how often did your pain limit your life or work activities? Would you say never, some days, most days, or every day?” Estimates are based on household interviews of a sample of the civilian noninstitutionalized population. Access data table for Figure 2.
SOURCE: National Center for Health Statistics, National Health Interview Survey, 2019.
The percentage of adults who had chronic pain and high-impact chronic pain in the past 3 months varied by race and Hispanic origin.
- Non-Hispanic white adults (23.6%) were more likely to have chronic pain in the past 3 months compared with non-Hispanic black (19.3%), Hispanic (13.0%), and non-Hispanic Asian (6.8%) adults. Chronic pain was least likely among non-Hispanic Asian adults (Figure 3).
- Non-Hispanic white adults (8.4%) were more likely to have high-impact chronic pain compared with Hispanic (5.3%) and non-Hispanic Asian (2.2%) adults. The observed difference in high-impact chronic pain between non-Hispanic white and non-Hispanic black adults was not significant.
- Non-Hispanic Asian adults were least likely to have high-impact chronic pain compared with adults of other race and Hispanic-origin groups.
- Non-Hispanic black adults were more likely to have chronic pain and high-impact chronic pain (19.3% and 7.4%, respectively) compared with Hispanic adults.
Figure 3. Percentage of adults aged 18 and over with chronic pain and high-impact chronic pain in the past 3 months, by race and Hispanic origin: United States, 2019
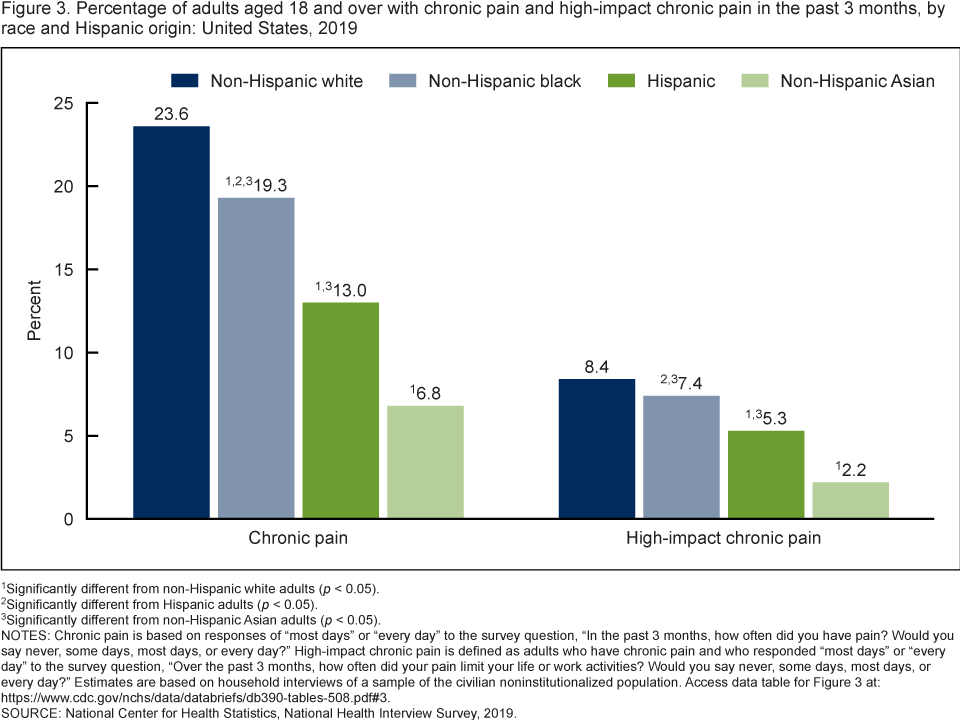
1Significantly different from non-Hispanic white adults (p < 0.05).
2Significantly different from Hispanic adults (p < 0.05).
3Significantly different from non-Hispanic Asian adults (p < 0.05).
NOTES: Chronic pain is based on responses of “most days” or “every day” to the survey question, “In the past 3 months, how often did you have pain? Would you say never, some days, most days, or every day?” High-impact chronic pain is defined as adults who have chronic pain and who responded “most days” or “every day” to the survey question, “Over the past 3 months, how often did your pain limit your life or work activities? Would you say never, some days, most days, or every day?” Estimates are based on household interviews of a sample of the civilian noninstitutionalized population. Access data table for Figure 3.
SOURCE: National Center for Health Statistics, National Health Interview Survey, 2019.
The percentage of adults who had chronic pain and high-impact chronic pain in the past 3 months varied by urbanization level.
- The percentage of adults who had chronic pain in the past 3 months increased as place of residence became more rural, from 16.4% in large central metropolitan areas to 28.1% in rural areas (Figure 4).
- The percentage of adults who had high-impact chronic pain in the past 3 months also increased as place of residence became more rural, from 6.1% in large central metropolitan areas to 10.9% in rural areas.
Figure 4. Percentage of adults aged 18 and over with chronic pain and high-impact chronic pain in the past 3 months, by urbanization level: United States, 2019
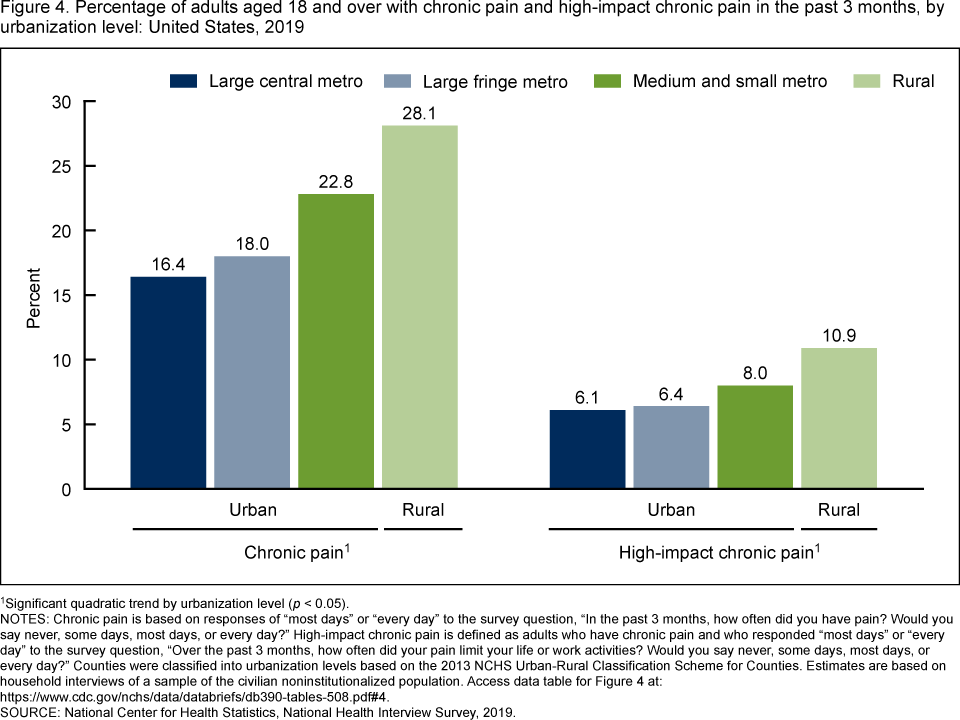
1Significant quadratic trend by urbanization level (p < 0.05).
NOTES: Chronic pain is based on responses of “most days” or “every day” to the survey question, “In the past 3 months, how often did you have pain? Would you say never, some days, most days, or every day?” High-impact chronic pain is defined as adults who have chronic pain and who responded “most days” or “every day” to the survey question, “Over the past 3 months, how often did your pain limit your life or work activities? Would you say never, some days, most days, or every day?” Counties were classified into urbanization levels based on the 2013 NCHS Urban-Rural Classification Scheme for Counties. Estimates are based on household interviews of a sample of the civilian noninstitutionalized population. Access data table for Figure 4.
SOURCE: National Center for Health Statistics, National Health Interview Survey, 2019.
Summary
Overall, the prevalence of chronic pain was 20.4%, and the prevalence of high-impact chronic pain was 7.4% (or 36.4% of adults who had chronic pain). Chronic pain was highest among women (21.7%), non-Hispanic white adults (23.6%), and those aged 65 and over (30.8%). High impact chronic pain was highest among women (8.5%) and those aged 65 and over (11.8%).
These subgroup differences observed with the 2019 National Health Interview Survey (NHIS) are consistent with previously published 2016 NHIS estimates (6). Estimates of chronic pain and high-impact chronic pain by level of urbanization examined in this report show that the percentage of adults who had chronic pain and high-impact chronic pain in the past 3 months increased as place of residence became more rural.
Definitions
Chronic pain: Responses of “most days” or “every day” to the survey question, “In the past 3 months, how often did you have pain? Would you say never, some days, most days, or every day?”
High-impact chronic pain: Adults who have chronic pain and who responded “most days” or “every day” to the survey question, “Over the past 3 months, how often did your pain limit your life or work activities? Would you say never, some days, most days, or every day?”
Race and ethnicity: Based on two separate questions that determine Hispanic or Latino origin and race. Adults of Hispanic or Latino origin may be of any race. Non-Hispanic white, non-Hispanic black, and non-Hispanic Asian refer to adults with the single-race group indicated. Non-Hispanic American Indian or Alaska Native (AIAN) adults and non-Hispanic Native Hawaiian or Pacific Islander (NHPI) adults are included in the totals but are not shown separately.
Urbanization level: Counties were classified according to their metropolitan status using the National Center for Health Statistics (NCHS) Urban–Rural Classification Scheme (7). Metropolitan (or urban) counties include large central counties (inner cities); the fringes of large counties (suburbs); and medium and small counties. Nonmetropolitan (or rural) counties include micropolitan statistical areas and noncore areas, including open countryside, rural towns (populations of less than 2,500), and areas with populations of 2,500–49,999 that are not part of larger labor market areas (metropolitan areas).
Data source and methods
Data from the redesigned 2019 NHIS were used for this analysis. NHIS is a nationally representative, household survey of the civilian noninstitutionalized U.S. population. It is conducted continuously throughout the year by NCHS. Data for this analysis are from the pain section of the Sample Adult interview (n = 31,997). For more information about NHIS, visit its website at: https://www.cdc.gov/nchs/nhis.htm.
Point estimates and the corresponding variances were calculated using SAS-callable SUDAAN version 11.0 (RTI International, Research Triangle Park, N.C.) to account for the complex sample design of NHIS. Linear and quadratic trends by age group and size of place of residence were evaluated using orthogonal polynomials in logistic regression. Differences between percentages were evaluated using two-sided significance tests at the 0.05 level. All estimates presented meet NCHS data presentation standards for proportions (8).
About the authors
Carla E. Zelaya, James M. Dahlhamer, Jacqueline W. Lucas, and Eric M. Connor are with the National Center for Health Statistics (NCHS), Division of Health Interview Statistics. At the time of this report, Eric M. Connor was a guest researcher at NCHS through the Oak Ridge Institute for Science and Education fellowship program.
References
- Institute of Medicine. Relieving pain in America: A blueprint for transforming prevention, care, education, and research. Washington, DC: National Academies Press. 2011.
- U.S. Department of Health and Human Services, National Institutes of Health. Interagency Pain Research Coordinating Committee. National pain strategy: A comprehensive population health-level strategy for pain. 2016.
- Schappert SM, Burt CW. Ambulatory care visits to physician offices, hospital outpatient departments, and emergency departments: United States, 2001–02. National Center for Health Statistics. Vital Health Stat 13(159):1–66. 2006.
- Smith BH, Elliott AM, Chambers WA, Smith WC, Hannaford PC, Penny K. The impact of chronic pain in the community. Fam Pract 18:292–9. 2001.
- Mills SEE, Nicolson KP, Smith BH. Chronic pain: A review of its epidemiology and associated factors in population-based studies. Br J Anaesth 123(2):e27383. 2019.
- Dahlhamer J, Lucas J, Zelaya C, Nahin R, Mackey S, DeBar L, et al. Prevalence of chronic pain and high-impact chronic pain among adults—United States, 2016. MMWR Surveill Summ 67(36):1001–06. 2018.
- Ingram DD, Franco SJ. 2013 NCHS urban–rural classification scheme for counties. National Center for Health Statistics. Vital Health Stat 2(166). 2014.
- Parker JD, Talih M, Malec DJ, Beresovsky V, Carroll M, Gonzalez JF Jr., et al. National Center for Health Statistics data presentation standards for proportions. National Center for Health Statistics. Vital Health Stat 2(175). 2017.
Suggested citation
Zelaya CE, Dahlhamer JM, Lucas JW, Connor EM. Chronic pain and high-impact chronic pain among U.S. adults, 2019. NCHS Data Brief, no 390. Hyattsville, MD: National Center for Health Statistics. 2020.
Copyright information
All material appearing in this report is in the public domain and may be reproduced or copied without permission; citation as to source, however, is appreciated.
National Center for Health Statistics
Brian C. Moyer, Ph.D., Director
Amy M. Branum, Ph.D., Acting Associate Director for Science
Division of Health Interview Statistics
Stephen J. Blumberg, Ph.D., Director
Anjel Vahratian, Ph.D., M.P.H., Associate Director for Science