Special Diets Among Adults: United States, 2015–2018
- Key findings
- What percentage of U.S. adults were on any special diet on a given day, and did this vary by sex and age for 2015–2018?
- Did the percentage of U.S. adults on any special diet on a given day differ by race and Hispanic origin, weight status, or education level?
- What were the most common special diets reported by U.S. adults by age?
- What were the trends in the use of any special diet and the most common types of special diets among U.S. adults between 2007–2008 and 2017–2018?
- Summary
- Definitions
- Data source and methods
- About the authors
- References
- Suggested citation
PDF Version (529 KB) | Visual Abstract
Key findings
Data from the National Health and Nutrition Examination Survey
- In 2015–2018, 17.1% of U.S. adults aged 20 and over were on a special diet on a given day.
- More women were on a special diet than men, and more adults aged 40–59 and 60 and over were on a special diet than adults aged 20–39.
- More non-Hispanic white adults (17.8%) were on a special diet than non-Hispanic black (14.7%) and non-Hispanic Asian (14.9%) adults.
- The most common type of special diet reported among all adults was a weight loss or low-calorie diet.
- From 2007–2008 through 2017–2018, the percentage of adults on any special diet, weight loss or low-calorie diets, and low carbohydrate diets increased, while the percentage of adults on low-fat or low-cholesterol diets decreased.
To help achieve and maintain a healthy body weight, support nutrient adequacy, and reduce the risk of chronic disease, the 2015–2020 Dietary Guidelines for Americans recommend following a healthy eating pattern across the lifespan (1). Some people adhere to specific eating patterns, otherwise known as special diets, for the purposes of weight loss or other health-related reasons. This report shows the percentage of U.S. adults who, on a given day, were on any special diet and specific types of special diets in 2015–2018 and trends from 2007–2008 through 2017–2018.
Keywords: weight loss, nutrition, NHANES
What percentage of U.S. adults were on any special diet on a given day, and did this vary by sex and age for 2015–2018?
Approximately 17% (17.1%) of adults aged 20 and over reported being on any type of special diet in 2015–2018, with more women (19.0%) reporting being on a special diet than men (15.1%) (Figure 1). Among all adults, the percentage of younger adults aged 20–39 reporting being on a special diet (13.3%) was lower compared with those aged 40–59 (19.2%) and those aged 60 and over (19.3%).
A similar pattern was seen among men (10.8% for ages 20–39, 17.6% for 40–59, and 17.7% for 60 and over) and among women (15.8% for ages 20–39, 20.7% for 40–59, and 20.7% for 60 and over). The percentage of adults aged 20–39 on a special diet was higher among women than men, but the observed difference in special diets between men and women among those 40 and over was not significant.
Figure 1. Percentage of adults aged 20 and over on any special diet on a given day, by sex and age: United States, 2015–2018
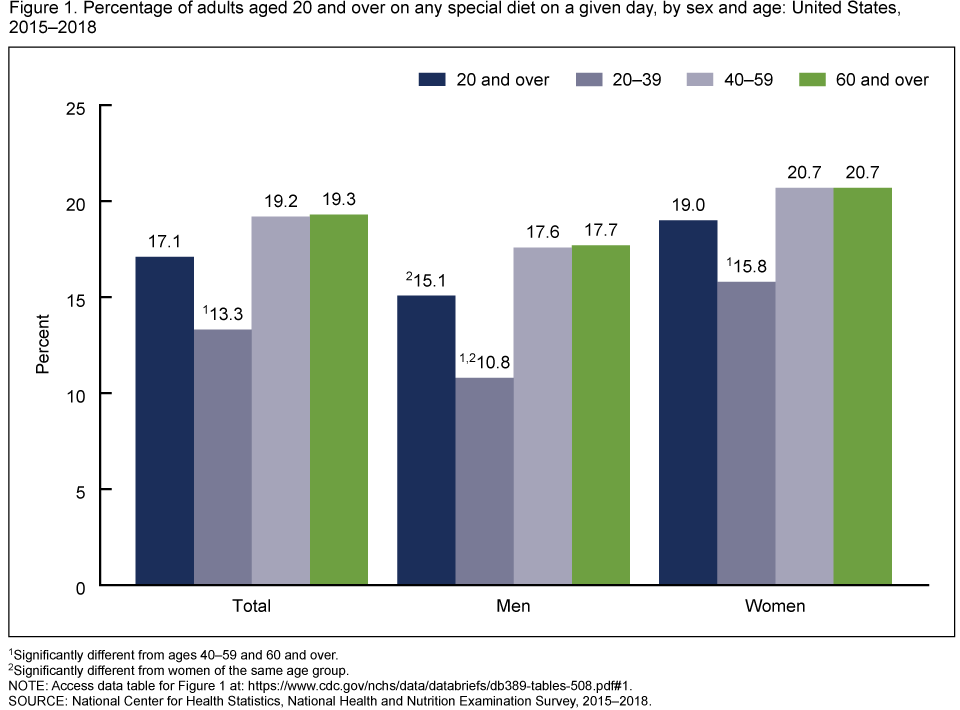
1Significantly different from ages 40–59 and 60 and over.
2Significantly different from women of the same age group.
NOTE: Access data table for Figure 1.
SOURCE: National Center for Health Statistics, National Health and Nutrition Examination Survey, 2015–2018.
Did the percentage of U.S. adults on any special diet on a given day differ by race and Hispanic origin, weight status, or education level?
The percentage of adults on a special diet was higher among non-Hispanic white adults (17.8%), than non-Hispanic black (14.7%) and non-Hispanic Asian (14.9%) adults (Figure 2). The percentage of Hispanic adults on a special diet (16.4%) was not significantly different compared with the other race and Hispanic-origin groups. The percentage of adults on a special diet increased with increasing weight status (8.3% for normal or underweight, 17.1% for overweight, and 23.1% for obesity) and increasing educational level (14.1% for less than high school education, 17.0% for high school education or some college, and 18.6% for college graduate or higher).
Figure 2. Percentage of adults aged 20 and over on any special diet on a given day, by race and Hispanic origin, weight status, and educational attainment: United States, 2015–2018
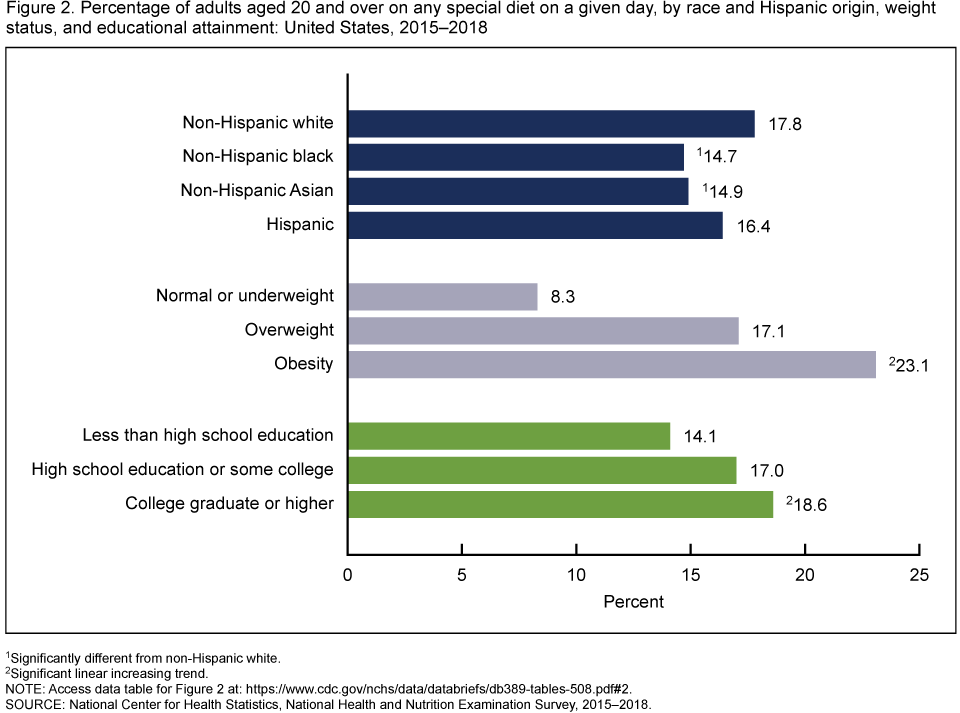
1Significantly different from non-Hispanic white.
2Significant linear increasing trend.
NOTE: Access data table for Figure 2.
SOURCE: National Center for Health Statistics, National Health and Nutrition Examination Survey, 2015–2018.
What were the most common special diets reported by U.S. adults by age?
The top four most common types of special diets reported by adults aged 20 and over were weight loss or low-calorie diets (used by 9.3% of adults), diabetic diets (2.3%), low carbohydrate diets (2.0%), and low-fat or low-cholesterol diets (1.8%) (Figure 3). The pattern of most common types of special diets varied by age; however, the most common type of special diet among every age group was a weight loss or low-calorie diet.
Figure 3. Percentage of adults aged 20 and over on most common special diets on a given day, by age: United States, 2015–2018

NOTES: Participants could report more than one kind of special diet. Access data table for Figure 3.
SOURCE: National Center for Health Statistics, National Health and Nutrition Examination Survey, 2015–2018.
What were the trends in the use of any special diet and the most common types of special diets among U.S. adults between 2007–2008 and 2017–2018?
The percentage of U.S. adults on any type of special diet increased from 14.3% in 2007–2008 to 17.4% in 2017–2018 (Figure 4). In addition, the percentage of adults on a weight loss or low-calorie diet increased from 7.5% in 2007–2008 to 10.0% in 2017–2018 and the percentage of adults on a low carbohydrate diet increased from 0.9% in 2007–2008 to 2.2% in 2017–2018. The percentage of adults on a low-fat or low-cholesterol diet decreased from 2.7% in 2007–2008 to 1.5% in 2017–2018. There was no significant trend in the percentage of adults on a diabetic diet.
Figure 4. Trends in age-adjusted percentage of adults aged 20 and over on any special diet and most common special diets on a given day: United States, 2007–2008 through 2017–2018
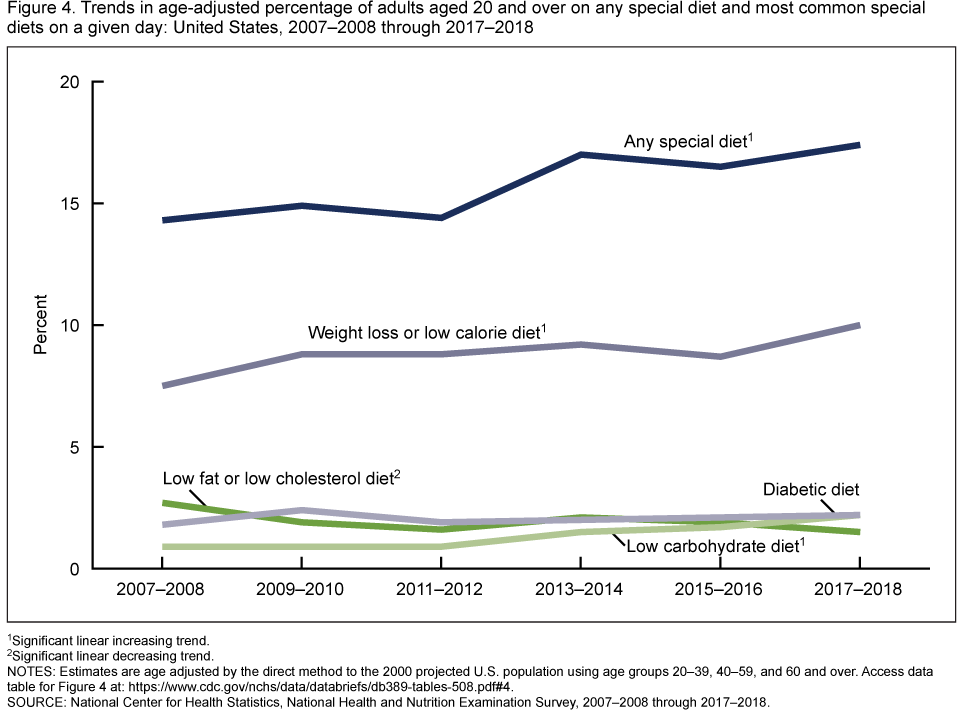
1Significant linear increasing trend.
2Significant linear decreasing trend.
NOTES: Participants could report more than one kind of special diet. Estimates are age adjusted by the direct method to the 2000 projected U.S. population using age groups 20–39, 40–59, and 60 and over. Access data table for Figure 4.
SOURCE: National Center for Health Statistics, National Health and Nutrition Examination Survey, 2007–2008 through 2017–2018.
Summary
In 2015–2018, 17.1% of U.S. adults were on a special diet on a given day. More women were on a special diet than men, more adults aged 40–59 and 60 and over were on a special diet than adults aged 20–39, and more non-Hispanic white adults were on a special diet than non-Hispanic black and non-Hispanic Asian adults. The percentage of adults on a special diet increased with increasing weight categories and increasing educational level. Weight loss or low-calorie diets were the most common special diet among adults. From 2007–2008 through 2017–2018, the percentage of adults on any special diet, the percentage of adults on a weight loss or low-calorie diet, and the percentage of adults on a low carbohydrate diet increased while the percentage of adults on a low-fat or low-cholesterol diet use decreased.
About one-half of U.S. adults have diet-related chronic diseases, such as cardiovascular disease, high blood pressure, or type 2 diabetes (1). Special diets are one way that many adults prevent, treat, and manage such diseases.
Definitions
Special diet: Participants were asked, “Are you currently on any kind of diet, either to lose weight or for some other health-related reason?” (2).
Kinds of special diets: Participants who reported currently being on a diet were asked, “What kind of diet are you on?” No list or standardized definitions of kinds of special diets were provided to participants. Participants could report more than one kind of special diet. Responses were categorized to: weight loss or low-calorie diet, low-fat or low-cholesterol diet, low-salt or low-sodium diet, sugar-free or low-sugar diet, low-fiber diet, high-fiber diet, diabetic diet, low-carbohydrate diet, high-protein diet, weight-gain diet, or other. From 2009–2010 onwards, gluten-free or celiac diet and renal or kidney diet were added as specific categories.
Weight status: Body mass index (BMI) was calculated as weight in kilograms divided by height in meters squared, rounded to one decimal place. Normal or underweight was defined as a BMI less than 25, overweight as a BMI of greater than or equal to 25 and less than 30, and obesity as a BMI greater than or equal to 30.
Education: Educational level indicated the highest degree or grade finished. Categories were defined as: 1) less than high school graduation, 2) high school graduation or equivalent, associate’s degree or some college, and 3) college graduate or higher.
Data source and methods
Data from the National Health and Nutrition Examination Surveys (NHANES) for the years 2007–2008, 2009–2010, 2011–2012, 2013–2014, 2015–2016, and 2017–2018 were used for these analyses. Data from NHANES 2015–2016 and 2017–2018 were combined to provide the most recent reliable estimates of adults on a special diet and specific diet types and were used to test differences between subgroups.
NHANES is a cross-sectional survey designed to provide nationally representative estimates of the noninstitutionalized population of the United States and is conducted by the National Center for Health Statistics (3). The survey consists of home interviews followed by standardized physical examinations in a mobile examination center (MEC). Information on special diets was obtained following an in-person 24-hour dietary recall interview with trained interviewers in the MEC and can be found in the “Dietary Interview—Total Nutrient Intakes, First Day” file (2). Weight and height were measured during the standardized physical examination in the MEC.
In 2015–2018, non-Hispanic black, non-Hispanic Asian, and Hispanic persons, among other groups, were oversampled to obtain reliable estimates for these population subgroups (4). Race- and Hispanic-origin-specific estimates reflect individuals reporting only one race; those reporting more than one race are included in the total but are not reported separately.
The sample is selected through a complex, multistage probability design, and sample weights—which account for the differential probabilities of selection, nonresponse, and noncoverage—are incorporated into the estimation process. Dietary interview day one sample weights, which additionally account for day of the week of dietary recall and nonresponse to the dietary interview, were used in this analysis. Standard errors were estimated using Taylor series linearization to account for the complex sampling design. Pregnant women were excluded from analysis by weight status only. Pair-wise differences between groups were tested using a univariate t statistic. For trends among categorical variables, the categories were ordered as continuous independent variables and tested using linear regression. For trends over time, the 2-year cycles were used as a continuous independent variable and were tested using orthogonal polynomial regression. Calculated estimates for trends over time were age-adjusted using the direct method to the 2000 projected U.S. population using age groups 20–39, 40–59, and 60 and over. All estimates meet the standards for presentation described in the National Center for Health Statistics Data Presentation Standards for Proportions (5). All differences reported are statistically significant at the p < 0.05 significance level unless otherwise indicated. Statistical analyses were conducted using R version 3.6.0 (R Foundation for Statistical Computing, Vienna, Austria), including the R survey package (6), SAS System for Windows version 9.4 (SAS Institute, Inc., Cary, N.C.), and SUDAAN version 11.0 (RTI International, Research Triangle Park, N.C.) to account for the complex sample design.
About the authors
Bryan Stierman is an Epidemic Intelligence Service Officer assigned to the National Center for Health Statistics (NCHS), Division of Health and Nutrition Examination Surveys. Nicholas Ansai, Suruchi Mishra, and Craig M. Hales are with NCHS, Division of Health and Nutrition Examination Surveys.
References
- U.S. Department of Health and Human Services and U.S. Department of Agriculture.
2015–2020 Dietary Guidelines for Americans. 8th ed. 2015. - National Center for Health Statistics. National Health and Nutrition Examination Survey 2017–2018 data documentation, codebook, and frequencies: Dietary interview—Total nutrient intakes, first day.
- National Center for Health Statistics. National Health and Nutrition Examination Survey: Questionnaires, datasets, and related documentation.
- Chen TC, Clark J, Riddles MK, Mohadjer LK, Fakhouri THI. National Health and Nutrition Examination Survey, 2015−2018: Sample design and estimation procedures. National Center for Health Statistics. Vital Health Stat 2(184). 2020.
- Parker JD, Talih M, Malec DJ, Beresovsky V, Carroll M, Gonzalez Jr JF. National Center for Health Statistics Data Presentation Standards for Proportions. National Center for Health Statistics. Vital Health Stat 2(175). 2017.
- Lumley T. Survey: Analysis of complex survey samples. R package version 3.36 ed. 2019.
Suggested citation
Stierman B, Ansai N, Mishra S, Hales CM. Special diets among adults: United States, 2015–2018. NCHS Data Brief, no 389. Hyattsville, MD: National Center for Health Statistics. 2020.
Copyright information
All material appearing in this report is in the public domain and may be reproduced or copied without permission; citation as to source, however, is appreciated.
National Center for Health Statistics
Brian C. Moyer, Ph.D., Director
Amy M. Branum, Ph.D., Acting Associate Director for Science
Division of Health and Nutrition Examination Surveys
Ryne Paulose-Ram, M.A., Ph.D., Acting Director
Lara J. Akinbami, M.D., Acting Associate Director for Science