Nonalcoholic Beverage Consumption Among Adults: United States, 2015–2018
- Key findings
- What was the contribution of different beverage types to total nonalcoholic beverage consumption among adults in 2015–2018?
- Were there differences by sex in the contribution of different types of beverages to total nonalcoholic beverage consumption among adults in 2015–2018?
- Were there differences by age in the contribution of different types of beverages to total nonalcoholic beverage consumption among adults in 2015–2018?
- Were there differences by race and Hispanic origin in the contribution of different types of beverages to total nonalcoholic beverage consumption among adults in 2015–2018?
- Summary
- Definition
- Data source and methods
- About the authors
- References
- Suggested citation
PDF Version (403 KB) | Visual Abstract
Key findings
Data from the National Health and Nutrition Examination Survey
- In 2015–2018, water accounted for more than one-half of total nonalcoholic beverage consumption (51.2%) among U.S. adults.
- Compared with women, men consumed more coffee, sweetened beverages, and fruit beverages as a percentage of total beverage consumption, and less water and tea.
- The contribution of water and sweetened beverages to total beverage consumption decreased with age, while the contribution of coffee, tea, milk, and diet beverages increased with age.
- The contribution of water (60.7%) and tea (13.6%) to total beverage consumption was highest among non-Hispanic Asian adults, while the contribution of coffee (17.3%) was highest among non-Hispanic white adults.
Beverages play a substantial role in meeting total water intake needs and are a major contributor to overall nutrient and caloric intake for the U.S. population (1,2). The 2015–2020 Dietary Guidelines for Americans recommend that water, fat-free and low-fat milk, and 100% juice be the primary beverages consumed (2). This report provides estimates of the contribution of beverage types to total nonalcoholic beverage consumption, by grams, for U.S. adults.
Keywords: drinks, National Health and Nutrition Examination Survey (NHANES)
What was the contribution of different beverage types to total nonalcoholic beverage consumption among adults in 2015–2018?
Water accounted for 51.2% of total nonalcoholic beverage consumption among adults on a given day in 2015–2018, followed by coffee (14.9%), sweetened beverages (10.2%), tea (8.7%), fruit beverages (5.6%), milk (5.5%), and diet beverages (3.8%) (Figure 1).
Figure 1. Contribution of beverage types to total nonalcoholic beverage consumption among adults aged 20 and over: United States, 2015–2018
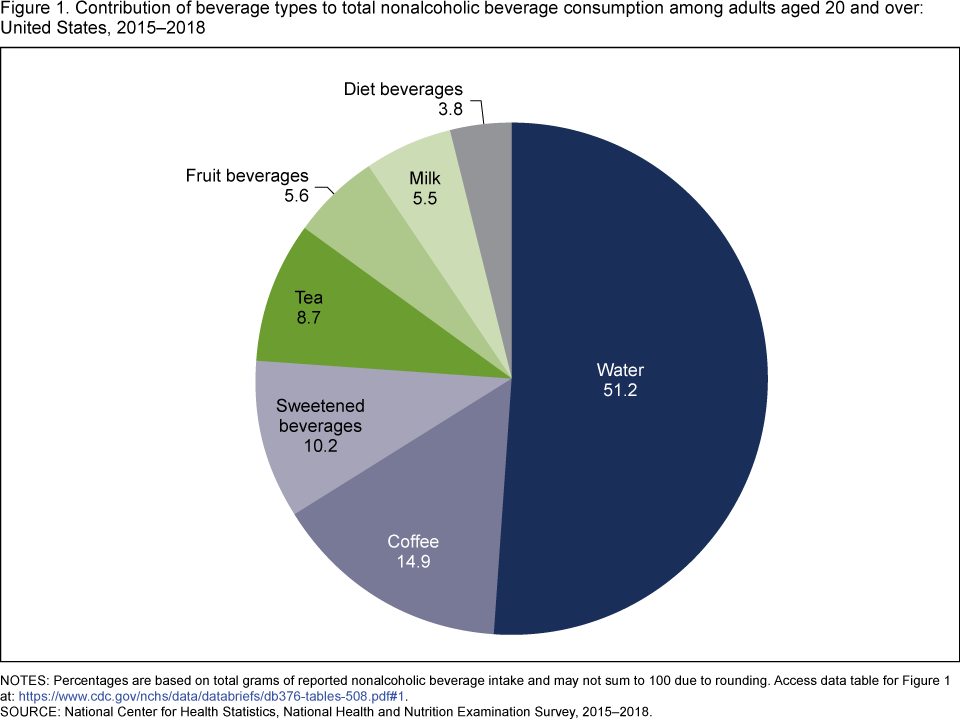
NOTES: Percentages are based on total grams of reported nonalcoholic beverage intake and may not sum to 100 due to rounding. Access data table for Figure 1.
SOURCE: National Center for Health Statistics, National Health and Nutrition Examination Survey, 2015–2018.
Were there differences by sex in the contribution of different types of beverages to total nonalcoholic beverage consumption among adults in 2015–2018?
Water contributed a lower percentage of total beverage consumption among men (48.2%) than women (54.0%), as did tea (7.8% compared with 9.6%) (Figure 2). However, coffee (16.0% for men compared with 13.9% for women), sweetened beverages (11.8% compared with 8.7%), and fruit beverages (6.1% compared with 5.2%) contributed a higher percentage of total beverage consumption among men than women.
Figure 2. Contribution of beverage types to total nonalcoholic beverage consumption among adults aged 20 and over, by sex: United States, 2015–2018
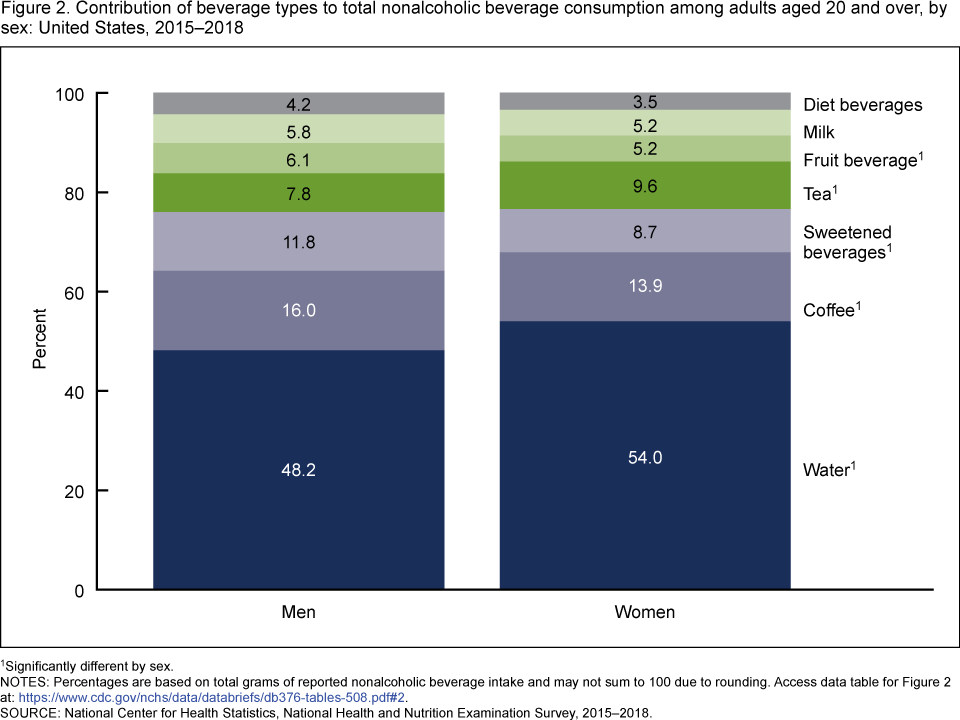
1Significantly different by sex.
NOTES: Percentages are based on total grams of reported nonalcoholic beverage intake and may not sum to 100 due to rounding. Access data table for Figure 2.
SOURCE: National Center for Health Statistics, National Health and Nutrition Examination Survey, 2015–2018.
Were there differences by age in the contribution of different types of beverages to total nonalcoholic beverage consumption among adults in 2015–2018?
The contribution of water to total beverage consumption decreased with age: 56.5% among younger adults aged 20–39, 49.3% among middle-aged adults aged 40–59, and 46.9% among older adults aged 60 and over (Figure 3). The contribution of sweetened beverages also decreased with age, and the contribution of fruit beverages was highest among adults aged 20–39. The contribution of coffee increased with age, from 9.2% among adults aged 20–39 to 16.1% among adults aged 40–59 and 20.5% among adults aged 60 and over. The contributions of tea, milk, and diet beverages also increased with age.
Figure 3. Contribution of beverage types to total nonalcoholic beverage consumption among adults aged 20 and over, by age: United States, 2015–2018
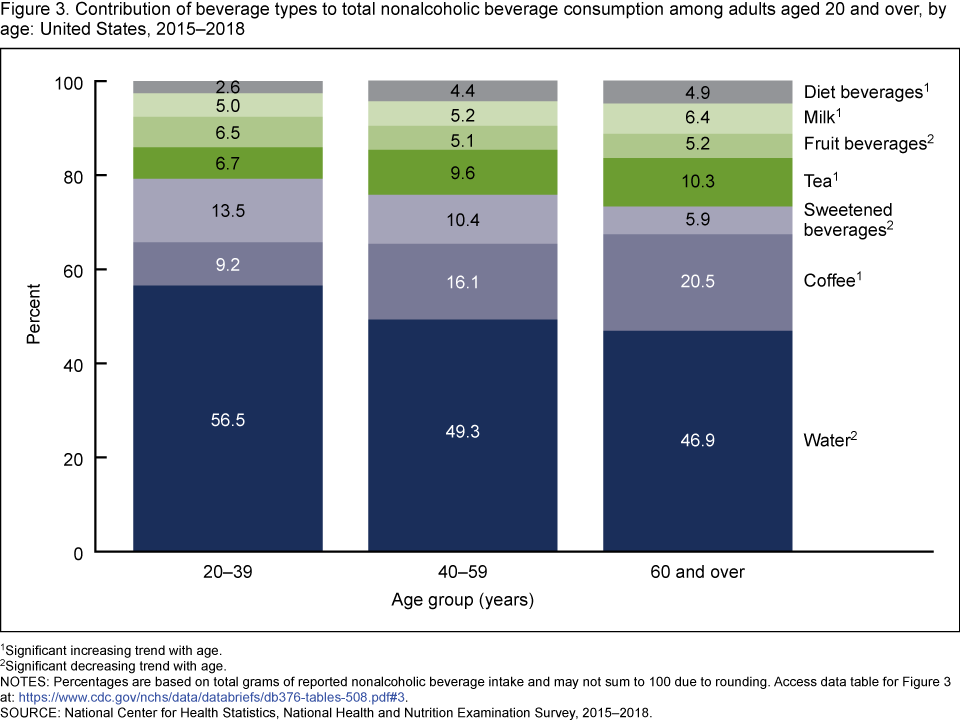
1Significant increasing trend with age.
2Significant decreasing trend with age
NOTES: Percentages are based on total grams of reported nonalcoholic beverage intake and may not sum to 100 due to rounding. Access data table for Figure 3.
SOURCE: National Center for Health Statistics, National Health and Nutrition Examination Survey, 2015–2018.
Were there differences by race and Hispanic origin in the contribution of different types of beverages to total nonalcoholic beverage consumption among adults in 2015–2018?
Water consumption as a percentage of total beverage consumption was highest among non-Hispanic Asian adults (60.7%) (Figure 4). Tea intake as a percentage of total beverage intake was also highest among non-Hispanic Asian adults (13.6%) compared with non-Hispanic white (9.3%), non-Hispanic black (7.1%), and Hispanic (5.5%) adults.
Coffee consumption as a percentage of total beverage consumption was highest among non-Hispanic white adults (17.3%), followed by Hispanic (12.6%), non-Hispanic Asian (8.9%), and non-Hispanic black (7.3%) adults. Diet beverages as a percentage of total beverage intake were also highest among non-Hispanic white adults (4.9%).
The contribution of sweetened beverages to total beverage consumption was higher among non-Hispanic black (14.5%) and Hispanic (14.3%) adults, compared with non-Hispanic white (9.0%) and non-Hispanic Asian (4.4%) adults. Fruit beverage intake as a percentage of total beverage intake was highest among non-Hispanic black adults (13.0%). The contribution of milk to total beverage consumption was higher for non-Hispanic Asian (5.9%) and non-Hispanic white (5.7%) adults than for non-Hispanic black adults (4.5%).
Figure 4. Contribution of beverage types to total nonalcoholic beverage consumption among adults aged 20 and over, by race and Hispanic origin: United States, 2015–2018
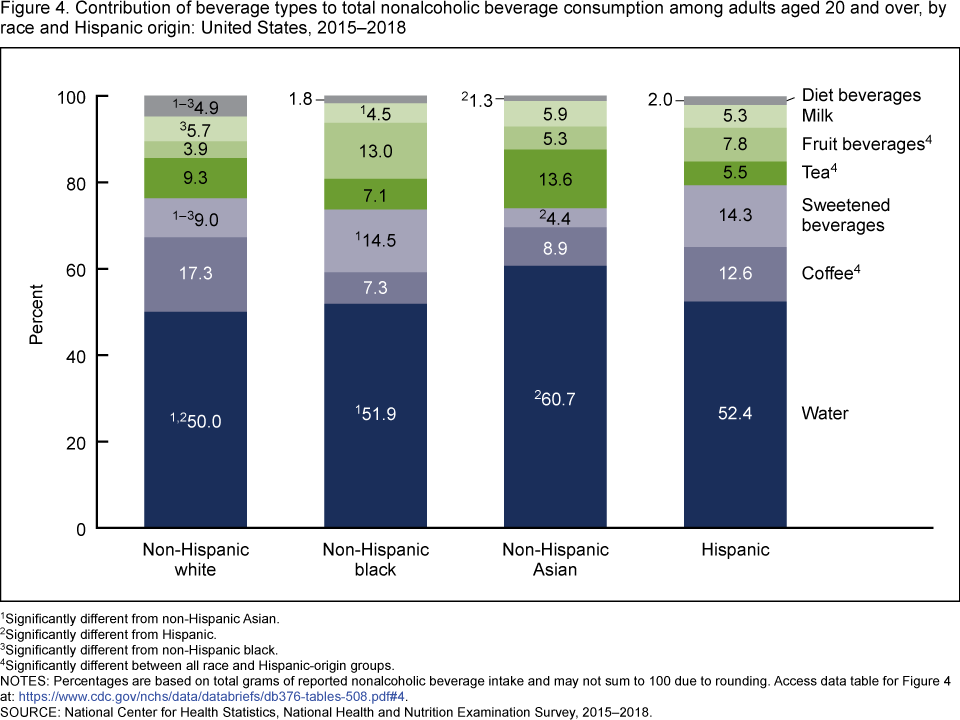
1Significantly different from non-Hispanic Asian.
2Significantly different from Hispanic.
3Significantly different from non-Hispanic black.
4Significantly different between all race and Hispanic-origin groups
NOTES: Percentages are based on total grams of reported nonalcoholic beverage intake and may not sum to 100 due to rounding. Access data table for Figure 4.
SOURCE: National Center for Health Statistics, National Health and Nutrition Examination Survey, 2015–2018.
Summary
In 2015–2018, water accounted for more than one-half of total nonalcoholic beverage consumption (51.2%) on a given day among U.S. adults. Compared with men, women consumed a higher percentage of their total beverages as water and tea and a lower percentage as coffee, sweetened beverages, and fruit beverages. The contribution of coffee, tea, milk, and diet beverages increased with age, while the contribution of water, sweetened beverages, and fruit beverages decreased with age.
Significant differences were seen in beverage consumption patterns by race and Hispanic origin. For non-Hispanic Asian adults, water and tea contributed a higher percentage of total beverage consumption, and sweetened beverages contributed a lower percentage, compared with other race and Hispanic-origin groups. The contribution of coffee and diet beverages was higher for non-Hispanic white adults than for other groups. Sweetened beverages accounted for a higher percentage of total beverage consumption among non-Hispanic black and Hispanic adults than among non-Hispanic white or non-Hispanic Asian adults. The contribution of fruit beverages was highest among non-Hispanic black adults.
Beverages vary in their nutrient and calorie contents, and some beverages can contribute excess calories while supplying few or no key nutrients (2). The 2015–2020 Dietary Guidelines for Americans recommend consuming primarily beverages that are calorie-free or that contribute beneficial nutrients (2).
Definition
Beverages: Nonalcoholic beverages are grouped as water, milk, coffee, tea, fruit beverages, sweetened beverages, and diet beverages. Water includes tap and bottled water, carbonated or noncarbonated. Milk includes flavored varieties, dairy milk substitutes (such as soy or almond milk), and milk consumed as part of a combination food (e.g., milk added to cereal). Coffee includes brewed and instant coffee as well as prepared coffee drinks that may contain lightener or sweetener. Tea includes brewed or prepared teas or herbal teas as well as prepared tea drinks that may contain sweetener. Fruit beverages include 100% fruit and vegetable juices, fruit juice drinks and nectars, fruit-flavored drinks, and fruit and vegetable smoothies. A fruit beverage category was created because 100% juice makes up only 2.5% of total beverage consumption. Sweetened beverages include soft drinks, sports and energy drinks, nutritional beverages, and grain drinks from the U.S. Department of Agriculture’s What We Eat in America (WWEIA) food categories (3). Diet beverages include diet soft drinks, diet sports and energy drinks, and other diet drinks from WWEIA food categories (3). Alcoholic beverages are not included.
The contribution of each beverage type to total nonalcoholic beverage consumption was computed for each participant who reported any nonalcoholic beverage intake on a given day as the grams of that beverage divided by the total grams of all included (nonalcoholic) beverages, multiplied by 100.
Data source and methods
Data for this report are from the National Health and Nutrition Examination Survey (NHANES), a cross-sectional survey conducted by the National Center for Health Statistics and designed to monitor the health and nutritional status of the civilian noninstitutionalized U.S. population. NHANES dietary data are collected through an in-person dietary recall conducted by trained interviewers in mobile examination centers, covering intake during the preceding day (24 hours, midnight to midnight) (4). Limitations of 24-hour dietary recalls, including underreporting, have been well-characterized (5) but do not diminish the utility of such dietary data in assessing population outcomes (6). Beverage consumption, expressed as a percentage of total beverage consumption, partially adjusts for misreporting (7).
The NHANES sample is selected through a complex, multistage probability design. For survey period 2015–2018, non-Hispanic black, non-Hispanic Asian, and Hispanic persons, among other groups, were oversampled to obtain reliable estimates for these population subgroups. Non-Hispanic race categories reflect persons reporting only one race; non-Hispanic persons reporting more than one race are included in the total but are not reported separately.
Day 1 dietary weights were used to account for differential probabilities of selection, nonresponse, and noncoverage as well as the days of the week and dietary interview nonresponse. Taylor series linearization was used to compute variance estimates. Pairwise differences between groups were tested using a univariate t statistic. Tests for linear trends by age were evaluated using orthogonal polynomials. The significance level for statistical testing was set at p < 0.05. All differences reported are statistically significant unless otherwise indicated. Data management and statistical analyses were conducted using SAS System for Windows version 9.4 (SAS Institute, Inc., Cary, N.C.) and SUDAAN version 11.0 (RTI International, Research Triangle Park, N.C.).
About the authors
Crescent B. Martin, Edwina A. Wambogo, Namanjeet Ahluwalia, and Cynthia L. Ogden are with the National Center for Health Statistics, Division of Health and Nutrition Examination Surveys.
References
- Institute of Medicine. Dietary reference intakes for water, potassium, sodium, chloride, and sulfate. Washington, DC: The National Academies Press. 2005.
- U.S. Department of Health and Human Services and U.S. Department of Agriculture. Dietary Guidelines for Americans, 2015–2020. 8th ed. 2015.
- U.S. Department of Agriculture. What We Eat in America, food categories.
- National Center for Health Statistics. National Health and Nutrition Examination Survey (NHANES): MEC in-person dietary interviewers procedures manual. 2016 and 2017.
- Subar AF, Freedman LS, Tooze JA, Kirkpatrick SI, Boushey C, Neuhouser ML, et al. Addressing current criticism regarding the value of self-report dietary data. J Nutr 145(12):2639–45. 2015.
- Ahluwalia N, Dwyer J, Terry A, Moshfegh A, Johnson C. Update on NHANES dietary data: Focus on collection, release, analytical considerations, and uses to inform public policy. Adv Nutr 7(1):121–34. 2016.
- Hébert JR, Hurley TG, Steck SE, Miller DR, Tabung FK, Peterson KE, et al. Considering the value of dietary assessment data in informing nutrition-related health policy. Adv Nutr 5(4):447–55. 2014.
Suggested citation
Martin CB, Wambogo EA, Ahluwalia N, Ogden CL. Nonalcoholic beverage consumption among adults: United States. 2015–2018. NCHS Data Brief, no 376. Hyattsville, MD: National Center for Health Statistics. 2020.
Copyright information
All material appearing in this report is in the public domain and may be reproduced or copied without permission; citation as to source, however, is appreciated.
National Center for Health Statistics
Brian C. Moyer, Ph.D., Director
Amy M. Branum, Ph.D., Acting Associate Director for Science
Division of Health and Nutrition Examination Surveys
Ryne Paulose-Ram, M.A., Ph.D., Acting Director
Lara J. Akinbami, M.D., Acting Associate Director for Science