Racial and Ethnic Differences in Mortality Rate of Infants Born to Teen Mothers: United States, 2017–2018
- Key findings
- Teenagers aged 15–19 had the highest infant, neonatal, and postneonatal mortality rates in 2017–2018.
- Total infant, neonatal, and postneonatal mortality rates were highest for infants born to non-Hispanic black teenagers and lowest for infants born to Hispanic teenagers.
- Disorders related to short gestation and low birthweight was the cause of death with the largest racial and ethnic disparities among the five leading causes of infant death.
- Summary
- Definitions
- Data source and methods
- About the authors
- References
- Suggested citation
PDF Version (466 KB)
Key findings
Data from the National Vital Statistics System
- In 2017–2018, infants of teenagers aged 15–19 had the highest rate of mortality (8.77 deaths per 1,000 live births) compared with infants of women aged 20 and over.
- Mortality rates were highest for infants of non-Hispanic black teenagers (12.54) compared with infants of non-Hispanic white (8.43) and Hispanic (6.47) teenagers.
- Infants of non-Hispanic black teenagers aged 15–19 had the highest mortality rates for four of the five leading causes of death compared with infants of non-Hispanic white and Hispanic teenagers.
- The mortality rate of infants born to non-Hispanic black teenagers related to preterm birth and low birthweight (284.31 deaths per 100,000 live births) was more than double the rate of infants born to non-Hispanic white teenagers (119.18) and three times the rate of infants born to Hispanic teenagers (94.44).
When compared with births among women aged 20 and over, teen pregnancies result in higher rates of neonatal and infant mortality, preterm birth, low birthweight, and maternal complications (1,2). Despite the declining birth rate for teenagers aged 15–19 since 1991, differences continue to occur in the mortality of infants born to teenagers by race and ethnicity and cause of death (1,3). This report examines 2017–2018 linked birth/infant death data from the National Vital Statistics System to describe the recent pattern in racial and ethnic differences in mortality and the leading causes of death for infants born to teen mothers aged 15–19.
Keywords: infant death, racial disparities, maternal age, National Vital Statistics System
Teenagers aged 15–19 had the highest infant, neonatal, and postneonatal mortality rates in 2017–2018.
- In 2017–2018, mortality rates were highest among infants born to teenagers aged 15–19 (8.77 infant deaths per 1,000 live births) compared with infants born to women aged 20 and over (Figure 1).
- Neonatal mortality rates (infant deaths within the first 28 days of life) were highest for infants born to teenagers (5.34) compared with all older maternal age groups. Infants born to teenagers were 1.6 times as likely to die during the neonatal period compared with infants born to women aged 30–34 (3.33), who had the lowest neonatal mortality rate.
- Postneonatal mortality rates (infant deaths from 28 days through 364 days) were highest for infants born to teenagers (3.43) compared with the older maternal age groups. The postneonatal mortality rate was more than twice as high among teenagers aged 15–19 as it was among women aged 30–34 and 35–39 (1.36), who had the lowest postneonatal mortality rates.
Figure 1. Infant mortality rates, by maternal age and infant age at death: United States, 2017–2018
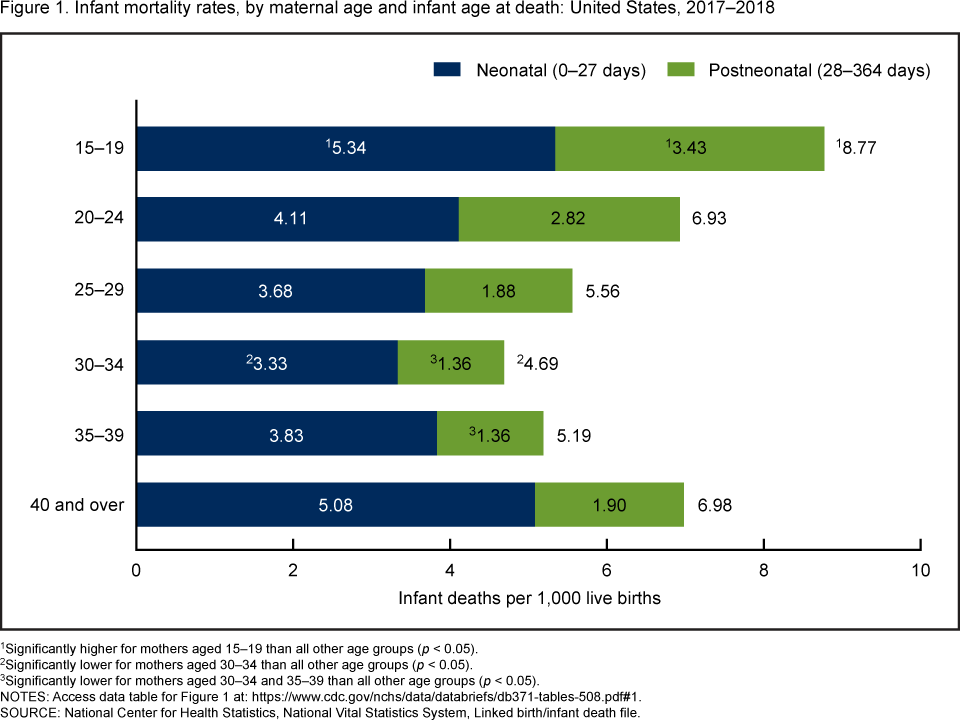
1Significantly higher for mothers aged 15–19 than all other age groups (p < 0.05).
2Significantly lower for mothers aged 30–34 than all other age groups (p < 0.05).
3Significantly lower for mothers aged 30–34 and 35–39 than all other age groups (p < 0.05).
NOTE: Access data table for Figure 1.
SOURCE: National Center for Health Statistics, National Vital Statistics System, Linked birth/infant death file.
Total infant, neonatal, and postneonatal mortality rates were highest for infants born to non-Hispanic black teenagers and lowest for infants born to Hispanic teenagers.
- Among infants born to teenagers aged 15–19 in 2017–2018, the mortality rate was highest among infants born to non-Hispanic black teenagers (12.54 per 1,000 live births), followed by infants born to non-Hispanic white (8.43) and Hispanic (6.47) teenagers (Figure 2).
- Both neonatal and postneonatal mortality rates were highest for infants born to non-Hispanic black teenagers (7.92 and 4.63, respectively) and lowest for infants born to Hispanic teenagers (4.08 and 2.39).
Figure 2. Mortality rate of infants born to mothers aged 15–19, by age at death and maternal race and Hispanic origin: United States, 2017–2018
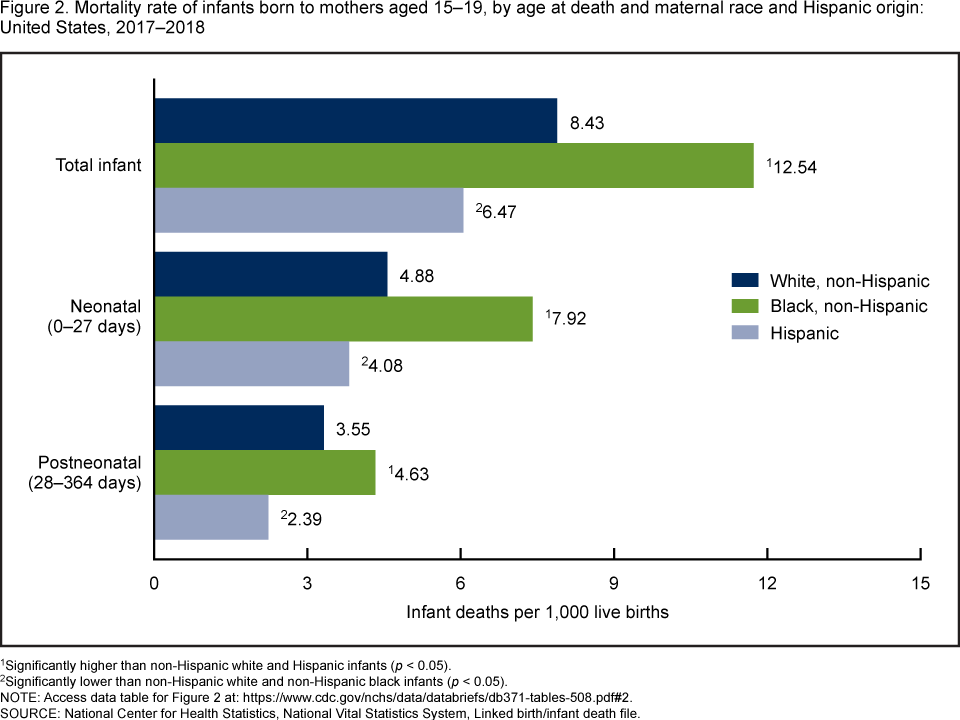
1Significantly higher than non-Hispanic white and Hispanic (p < 0.05).
2Significantly lower than non-Hispanic white and non-Hispanic black infants (p < 0.05).
NOTE: Access data table for Figure 2.
SOURCE: National Center for Health Statistics, National Vital Statistics System, Linked birth/infant death file.
Disorders related to short gestation and low birthweight was the cause of death with the largest racial and ethnic disparities among the five leading causes of infant death.
- In 2017–2018, the five leading causes of death among infants born to teenagers aged 15–19 were disorders related to short gestation (preterm birth) and low birthweight, congenital malformations, unintentional injuries (accidents), sudden infant death syndrome (SIDS), and maternal complications of pregnancy (Figure 3).
- Infants born to non-Hispanic black teenagers had the highest mortality rates for all five leading causes of death except SIDS, which was highest among non-Hispanic white teenagers (90.66 per 100,000 live births).
- Infants born to Hispanic teenagers had the lowest mortality rates for all five leading causes of death except maternal complications of pregnancy (35.69 compared with 28.51 among non-Hispanic white and 68.18 among non-Hispanic black teenagers).
- Infants born to non-Hispanic black teenagers were more than twice as likely to die from disorders related to preterm birth and low birthweight (284.31) as infants born to non-Hispanic white teenagers (119.18) and three times as likely to die as infants born to Hispanic teenagers (94.44).
Figure 3. Infant mortality rates for the five leading causes of death among infants born to mothers aged 15–19, by maternal race and Hispanic origin: United States, 2017–2018
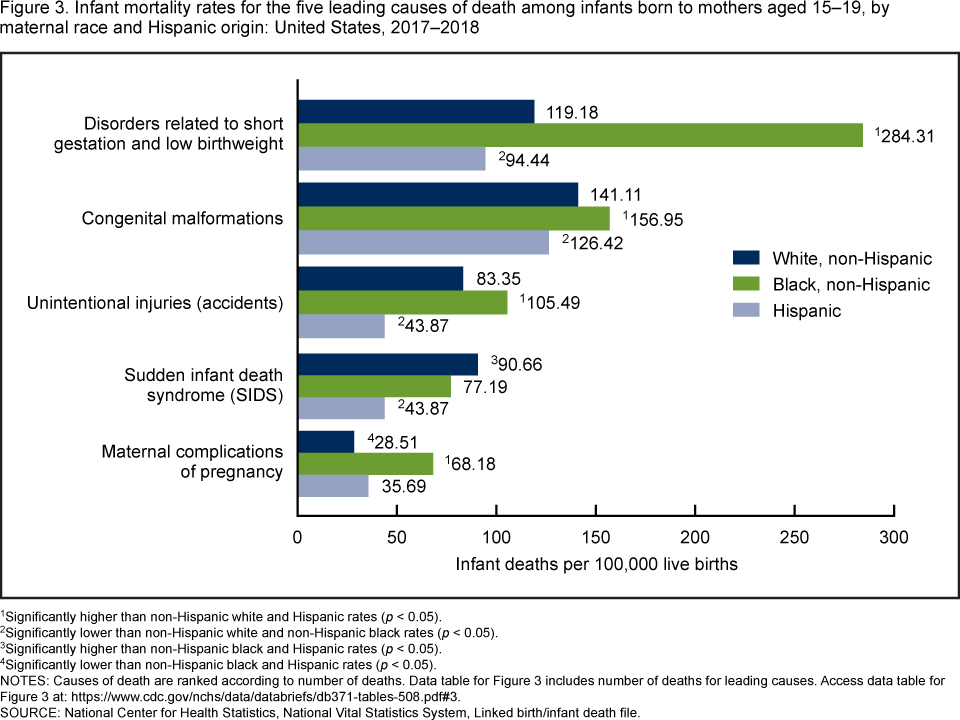
1Significantly higher than non-Hispanic white and Hispanic (p < 0.05).
2Significantly lower than non-Hispanic white and non-Hispanic black rates (p < 0.05).
3Significantly higher than non-Hispanic black and Hispanic rates (p < 0.05).
4Significantly lower than non-Hispanic black and Hispanic rates (p < 0.05).
NOTES: Causes of death are ranked according to number of deaths. Data table for Figure 3 includes number of deaths for leading causes. Access data table for Figure 3.
SOURCE: National Center for Health Statistics, National Vital Statistics System, Linked birth/infant death file.
Summary
In the United States, infants born to teenagers aged 15–19 were more likely to die within the first year of life than infants born to women aged 20 and over in 2017–2018. Historically, infants born to non-Hispanic black females of all ages have higher mortality rates compared with infants born to mothers in other racial and ethnic groups (4), which is consistent with the findings for teenagers aged 15–19 in this analysis. Mortality rates for infants born to non-Hispanic black teenagers were higher than those for infants born to non-Hispanic white and Hispanic teenagers during both the neonatal and postneonatal periods.
Among the five leading causes of death, the largest racial and ethnic difference in mortality rates was found for preterm- and low birthweight-related causes, where rates were two to three times higher for infants of non-Hispanic black teenagers compared with the rates for infants of non-Hispanic white and Hispanic teenagers. Moreover, infants born to non-Hispanic black teenagers are more likely to be born preterm or at low birthweight compared with infants born to non-Hispanic white and Hispanic teenagers (3).
Definitions
Cause-of-death classification: Medical information—including injury diagnoses and external causes of injury—is entered on death certificates filed in the United States and classified and coded in accordance with the International Statistical Classification of Diseases and Related Health Problems, 10th Revision (ICD–10) (5). Corresponding abbreviations of infant cause-of-death categories and ICD–10 codes presented in this report are:
- Maternal complications: Newborn affected by maternal complications of pregnancy (P01)
- Preterm birth and low birthweight: Disorders related to short gestation and low birthweight, not elsewhere classified (P07)
- Congenital malformations: Congenital malformations, deformations and chromosomal abnormalities (Q00–Q99)
- Sudden infant death syndrome (R95)
- Unintentional injuries: Accidents (unintentional injuries [V01–X59])
Infant mortality rate: Number of infant (under age 1 year) deaths per 1,000 live births.
Leading causes of death: Ranked according to the number of deaths assigned to rankable causes (5).
Neonatal mortality rate: Number of deaths to infants aged 0–27 days per 1,000 live births.
Postneonatal mortality rate: Number of deaths to infants aged 28–364 days per 1,000 live births.
Data source and methods
This report contains data from the period linked birth/infant death data set, which are collected by the National Vital Statistics System (6). The period linked birth/infant death data set includes all infant deaths under 1 year of age reported on death certificates and all births reported from birth certificates. The period linked birth/infant death data set is the primary data set for analyzing infant mortality trends and patterns in the United States, and it is the only source for examining race and Hispanic-origin infant mortality and factors related to birth (6,7). Linked birth/infant death data sets are available from: https://www.cdc.gov/nchs/nvss/linked-birth.htm.
Race and Hispanic origin are self-reported by the mother on the birth certificate. The race and Hispanic-origin groups shown in this report follow the 1997 Office of Management and Budget (OMB) Standards for the Classification of Federal Data on Race and Ethnicity. The 1997 OMB standards classify persons into one of the following five racial groups: white, black or African American, Asian, American Indian or Alaska Native, and Native Hawaiian or Other Pacific Islander. All categories are single race. Data on race and Hispanic origin are collected and reported separately. Persons of Hispanic origin may be of any race. Due to the smaller population counts and declining birth rates among teenagers aged 15–19, analysis is limited to non-Hispanic white, non-Hispanic black, and Hispanic groups.
Infant mortality rates are presented per 1,000 live births, while rates for specific causes of infant death are presented per 100,000 live births. Pairwise comparisons between race and Hispanic-origin groups were tested using the z test statistic at the 0.05 level of significance.
About the authors
Ashley M. Woodall is with the National Center for Health Statistics (NCHS), Division of Analysis and Epidemiology. Anne K. Driscoll is with NCHS, Division of Vital Statistics.
References
- Gilbert W, Jandial D, Field N, Bigelow P, Danielsen B. Birth outcomes in teenage pregnancies. J Matern Fetal Neonatal Med 16(5):265–70. 2004.
- Kawakita T, Wilson K, Grantz KL, Landy HJ, Huang C, Gomez-Lobo V. Adverse maternal and neonatal outcomes in adolescent pregnancy. J Pediatr Adolesc Gynecol 29(2):130–6. 2016.
- Martin JA, Hamilton BE, Osterman MJK, Driscoll AK. Births: Final data for 2018. National Vital Statistics Reports; vol 68 no 13. Hyattsville, MD: National Center for Health Statistics. 2019.
- Kochanek KD, Murphy SL, Xu JQ, Arias E. Deaths: Final data for 2017. National Vital Statistics Reports; vol 68 no 9. Hyattsville, MD: National Center for Health Statistics. 2019.
- Heron M. Deaths: Leading causes for 2017. National Vital Statistics Reports; vol 68 no 6. Hyattsville, MD: National Center for Health Statistics. 2019.
- Mathews TJ, MacDorman MF, Thoma ME. Infant mortality statistics from the 2013 period linked birth/infant death data set. National Vital Statistics Reports; vol 64 no 9. Hyattsville, MD: National Center for Health Statistics. 2015.
- Kochanek KD, Murphy SL, Xu JQ, Tejada-Vera B. Deaths: Final data for 2014. National Vital Statistics Reports; vol 65 no 4. Hyattsville, MD: National Center for Health Statistics. 2016.
Suggested citation
Woodall AM, Driscoll AK. Racial and ethnic differences in mortality rate of infants born to teen mothers: United States, 2017–2018. NCHS Data Brief, no 371. Hyattsville, MD: National Center for Health Statistics. 2020.
Copyright information
All material appearing in this report is in the public domain and may be reproduced or copied without permission; citation as to source, however, is appreciated.
National Center for Health Statistics
Brian C. Moyer, Ph.D., Director
Amy M. Branum, Ph.D., Acting Associate Director for Science
Division of Analysis and Epidemiology
Irma E. Arispe, Ph.D., Director
Kevin C. Heslin, Ph.D., Acting Associate Director for Science
Division of Vital Statistics
Steven Schwartz, Ph.D., Director
Isabelle L. Horon, Dr.P.H., Acting Associate Director for Science