Emergency Department Visits Among Adults Aged 60 and Over: United States, 2014–2017
- Key findings
- The ED visit rate increased with age for persons aged 60 and over.
- The percentage of ED visits made by nursing home residents increased with age for patients aged 60 and over.
- The percentage of ED visits made by patients arriving at the hospital in an ambulance increased with age for patients aged 60 and over.
- The percentage of ED visits caused by an unintentional fall increased with age for patients aged 60 and over.
- The percentage of ED visits that resulted in a hospital admission increased with age for patients aged 60 and over.
- Summary
- Definitions
- Data source and methods
- About the authors
- References
- Suggested citation
PDF Version (429 KB)
Key findings
Data from the National Hospital Ambulatory Medical Care Survey
- In 2014–2017, the emergency department (ED) visit rate for persons aged 60 and over was 43 visits per 100 persons aged 60 and over and increased with age, from 34 visits per 100 persons aged 60–69 to 86 visits per 100 persons aged 90 and over.
- About 7% of ED visits among patients aged 60 and over were made by nursing home residents, and this percentage increased with age.
- About 30% of patients aged 60 and over who visited the ED arrived by ambulance, and this percentage increased with age.
- The percentage of ED visits among patients aged 60 and over due to unintentional falls increased with age.
- Nearly one-quarter of ED visits among patients aged 60 and over resulted in a hospital admission, and this percentage increased with age.
In the United States, the number of older adults is increasing. From 2007 to 2017, the number of adults aged 60 and over increased from 52 million to 71 million, and during the same time period, the share of the U.S. population comprising older adults also increased from 17% to 22% (1,2). During 2014–2017, 20% of all emergency department (ED) visits in the United States were made by patients aged 60 and over, representing an annual average of approximately 29 million ED visits (3–6). Given their growing proportion of the population, older individuals will make up an increasingly larger share of ED visits in the coming years. This report describes ED visits made by adults aged 60 and over, assessing selected characteristics by age.
Keywords: ambulance, emergency care, falls, hospital admission, older adults, National Hospital Ambulatory Medical Care Survey
The ED visit rate increased with age for persons aged 60 and over.
- In 2014–2017, there were 43 ED visits per 100 persons aged 60 and over (Figure 1).
- The ED visit rate increased with age, from 34 visits per 100 persons aged 60–69 to 86 visits per 100 persons aged 90 and over.
Figure 1. Emergency department visit rates for patients aged 60 and over, by age: United States, 2014–2017
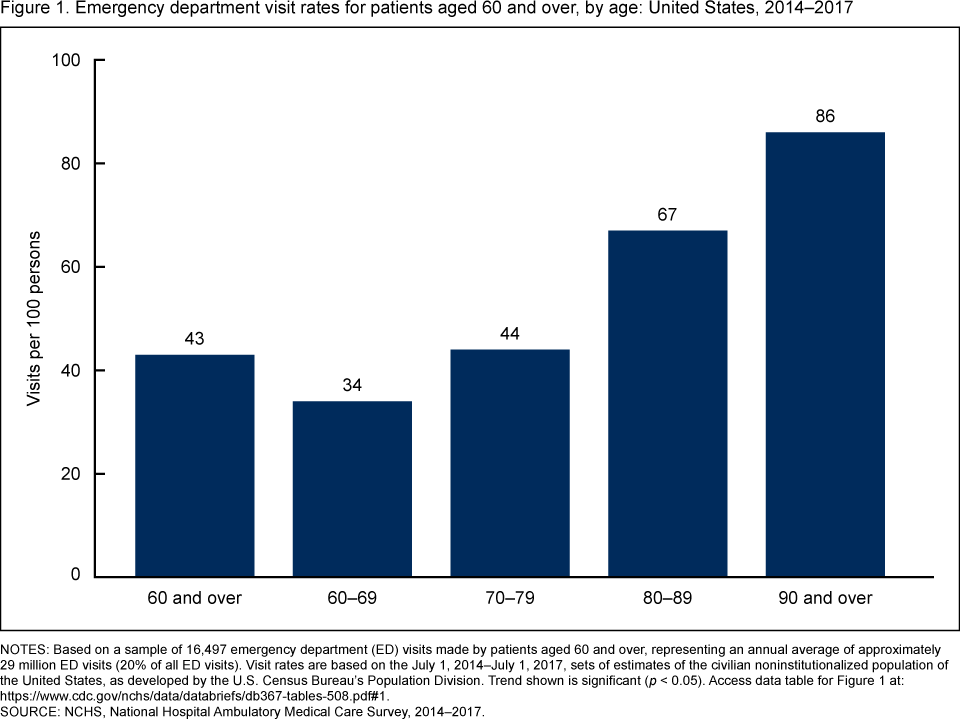
NOTES: Based on a sample of 16,497 emergency department (ED) visits made by patients aged 60 and over, representing an annual average of approximately 29 million ED visits (20% of all ED visits). Visit rates are based on the July 1, 2014–July 1, 2017, sets of estimates of the civilian noninstitutionalized population of the United States, as developed by the U.S. Census Bureau’s Population Division. Trend shown is significant (p < 0.05). Access data table for Figure 1.
SOURCE: NCHS, National Hospital Ambulatory Medical Care Survey, 2014–2017.
The percentage of ED visits made by nursing home residents increased with age for patients aged 60 and over.
- In 2014–2017, nursing home residents accounted for 7% of ED visits made by patients aged 60 and over (Figure 2).
- The percentage of ED visits made by nursing home residents increased with age: 2% of visits by patients aged 60–69, 6% of visits by patients aged 70–79, 12% of visits by patients aged 80–89, and 24% of visits by patients aged 90 and over.
Figure 2. Emergency department visits made by nursing home residents aged 60 and over, by age: United States, 2014–2017
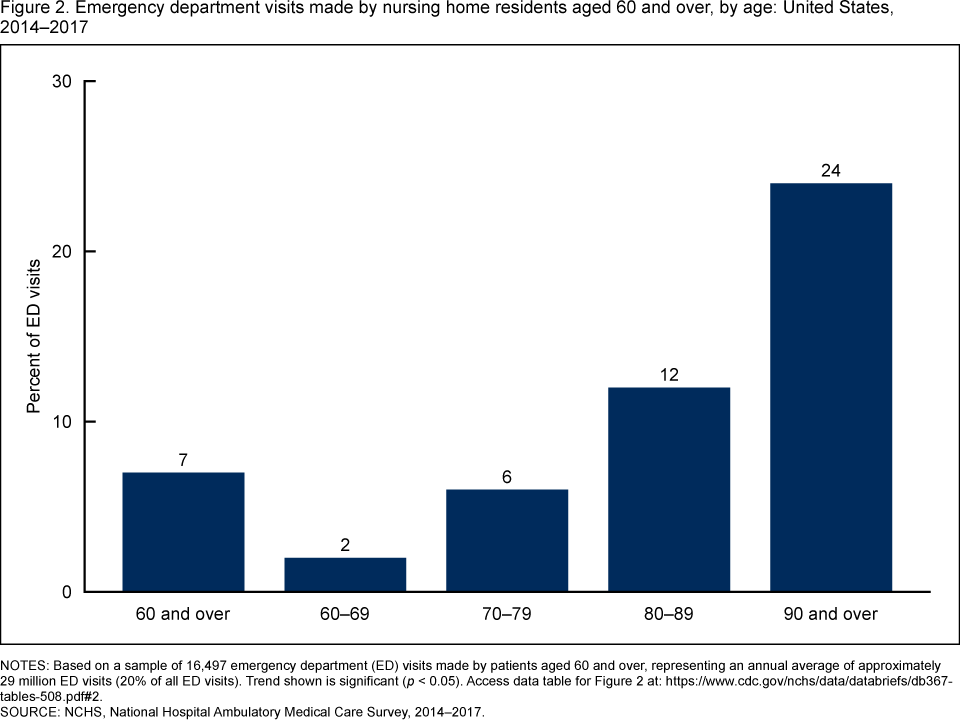
NOTES: Based on a sample of 16,497 emergency department (ED) visits made by patients aged 60 and over, representing an annual average of approximately 29 million ED visits (20% of all ED visits). Trend shown is significant (p < 0.05). Access data table for Figure 2.
SOURCE: NCHS, National Hospital Ambulatory Medical Care Survey, 2014–2017.
The percentage of ED visits made by patients arriving at the hospital in an ambulance increased with age for patients aged 60 and over.
- In 2014–2017, patients arriving at the hospital in an ambulance accounted for 30% of ED visits made by patients aged 60 and over (Figure 3).
- The percentage of ED visits where patients arrived at the hospital in an ambulance increased with age: 23% of visits by patients aged 60–69, 29% of visits by patients aged 70–79, 39% of visits by patients aged 80–89, and 53% of visits by patients aged 90 and over.
Figure 3. Arrival by ambulance for emergency department visits made by patients aged 60 and over, by age: United States, 2014–2017
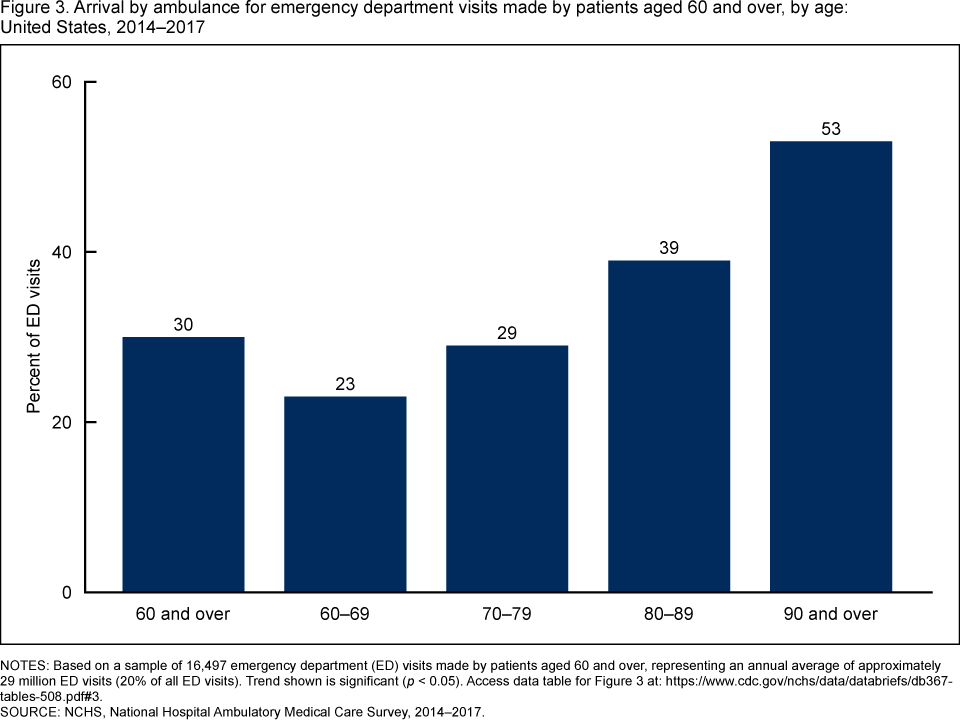
NOTE: Based on a sample of 16,497 emergency department (ED) visits made by patients aged 60 and over, representing an annual average of approximately 29 million ED visits (20% of all ED visits). Trend shown is significant (p < 0.05). Access data table for Figure 3.
SOURCE: NCHS, National Hospital Ambulatory Medical Care Survey, 2014–2017.
The percentage of ED visits caused by an unintentional fall increased with age for patients aged 60 and over.
- In 2014–2017, unintentional falls accounted for 13% of ED visits made by patients aged 60 and over (Figure 4).
- The percentage of ED visits caused by an unintentional fall increased with age: 10% of visits by patients aged 60–69, 12% of visits by patients aged 70–79, 17% of visits by patients aged 80–89, and 25% of visits by patients aged 90 and over.
Figure 4. Emergency department visits caused by unintentional falls for patients aged 60 and over, by age: United States, 2014–2017
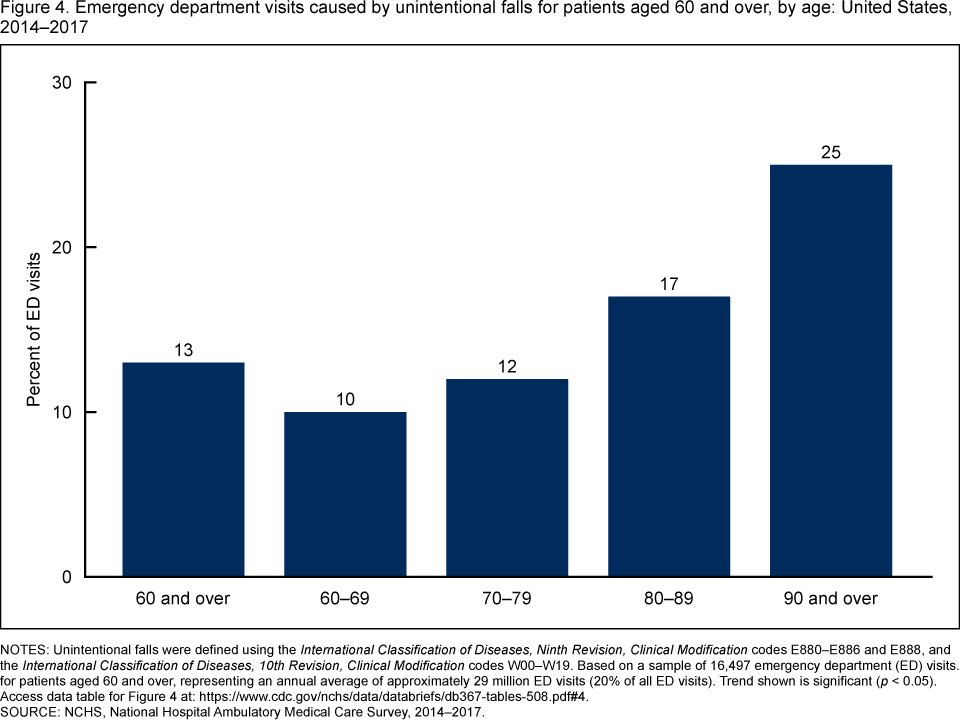
NOTES: Unintentional falls were defined using the International Classification of Diseases, Ninth Revision, Clinical Modification codes E880–E886 and E888, and the International Classification of Diseases, 10th Revision, Clinical Modification codes W00–W19. Based on a sample of 16,497 emergency department (ED) visits for patients aged 60 and over, representing an annual average of approximately 29 million ED visits (20% of all ED visits). Trend shown is significant (p < 0.05). Access data table for Figure 4.
SOURCE: NCHS, National Hospital Ambulatory Medical Care Survey, 2014–2017.
The percentage of ED visits that resulted in a hospital admission increased with age for patients aged 60 and over.
- In 2014–2017, the percentage of ED visits that resulted in hospital admission accounted for 23% of ED visits made by patients aged 60 and over (Figure 5).
- The percentage of ED visits that resulted in hospital admission increased with age: 19% of visits by patients aged 60–69, 23% of visits by patients aged 70–79, 30% of visits by patients aged 80–89, and 33% of visits by patients aged 90 and over.
Figure 5. Emergency department visits resulting in a hospital admission for patients aged 60 and over, by age: United States, 2014–2017
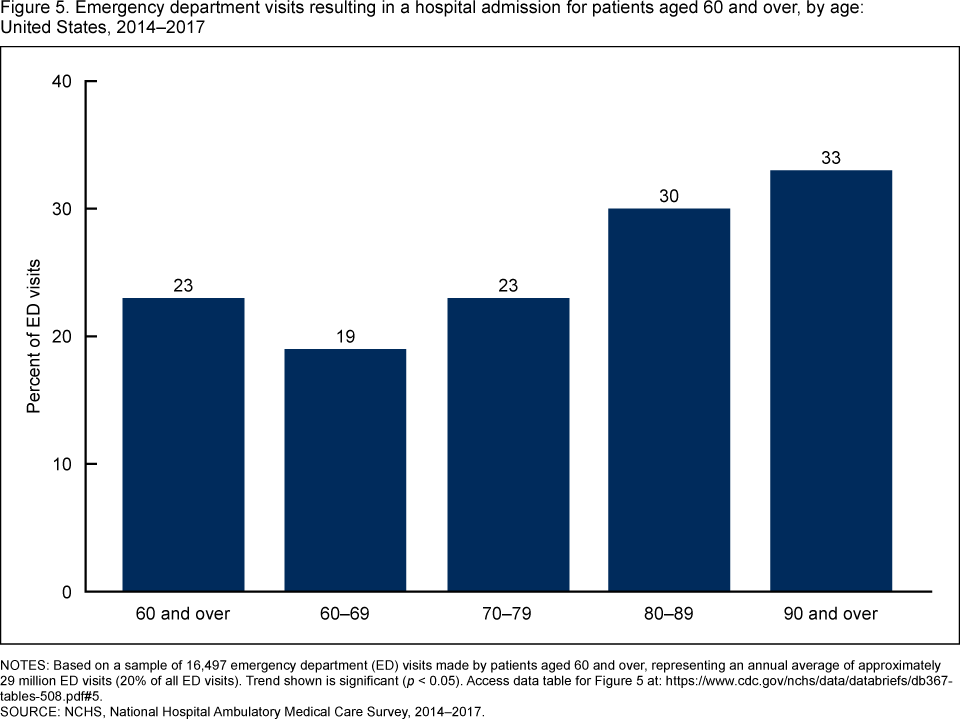
NOTES: Based on a sample of 16,497 emergency department (ED) visits made by patients aged 60 and over, representing an annual average of approximately 29 million ED visits (20% of all ED visits). Trend shown is significant (p < 0.05). Access data table for Figure 5.
SOURCE: NCHS, National Hospital Ambulatory Medical Care Survey, 2014–2017.
Summary
This report examined ED visits made by older adults in 2014–2017 by age group: 60–69, 70–79, 80–89, and 90 and over. The ED visit rate increased with age. In addition, several other characteristics also increased with age, including the percentage of visits made by nursing home residents; the percentage of visits where the patient arrived by ambulance; the percentage of visits where the visit was caused by an unintentional fall; and the percentage of visits where the patient was admitted to the hospital after the ED visit. As the U.S. population continues to grow older, monitoring use and provision of ED services among this population may help inform the ability of EDs to handle the unique needs of older patients.
Definitions
Arrival by ambulance: ED visits at which the patient arrived in an ambulance, either by air or ground. This includes private and public ambulances that can provide either advanced life support or basic life support.
ED visit rate: Calculated by dividing the number of ED visits by persons aged 60 and over, by the July 1, 2014–July 1, 2017, estimates of the civilian noninstitutionalized population of the United States (obtained from the U.S. Census Bureau’s Population Division) for each demographic group.
Hospital admission: ED visits that resulted in the patient being admitted to the hospital.
Nursing home resident: Refers to the patient’s current place of residence being a nursing home.
Unintentional fall: Any mention of the International Classification of Diseases, Ninth Revision, Clinical Modification (7) codes E880–E886 and E888 (2014–2015), and the International Classification of Diseases, 10th Revision, Clinical Modification (8) codes W00–W19 (2016–2017). Up to five diagnoses and three causes of injury were included.
Data source and methods
Data for this report are from the National Hospital Ambulatory Medical Care Survey (NHAMCS), an annual nationally representative survey of nonfederal, general, and short-stay hospitals. NHAMCS provides data on the use and provision of ambulatory care services in hospital emergency departments. Between 2014 and 2017, the weighted NHAMCS response rate ranged from 62.8% (2017) to 73.9% (2014). Additional information on the methodology of NHAMCS has been previously described (9–12).
This report presents results combining data for 2014–2017 to enable more detailed subgroup analyses. Estimates of the weighted number of visits are based on 4-year annual averages. Data analyses were performed using the statistical packages SAS version 9.4 (SAS Institute, Cary, N.C.) and SAS-callable SUDAAN version 11.0 (RTI International, Research Triangle Park, N.C.). Linear regression was used to test the significance of slopes for all age trends. All percentage estimates presented meet NCHS guidelines for presentation of proportions (13) and follow National Center for Health Statistics (NCHS) trend analysis guidelines (14) . Linear trends by age were evaluated using linear regression. The significance level for statistical testing was set at p < 0.05.
About the authors
Jill J. Ashman, Susan M. Schappert, and Loredana Santo are with the National Center for Health Statistics, Division of Health Care Statistics, Ambulatory and Hospital Care Statistics Branch.
References
- U.S. Census Bureau. POV–01. Age and sex of all people, family members and unrelated individuals, 2007 and 2017.
- Administration for Community living, U.S. Department of Health and Human Services. 2018 profile of older Americans. 2018
- National Center for Health Statistics. 2014 NHAMCS micro-data file. 2017.
- National Center for Health Statistics. 2015 NHAMCS micro-data file. 2017.
- National Center for Health Statistics. 2016 NHAMCS micro-data file. 2018.
- National Center for Health Statistics. 2017 NHAMCS micro-data file. 2019.
- U.S. Department of Health and Human Services, Centers for Medicare and Medicaid Services. International classification of diseases, ninth revision, clinical modification (ICD–9–CM), Sixth Edition. DHHS Pub No. (PHS) 06–1260. 2011.
- U.S. Department of Health and Human Services. Centers for Disease Control and Prevention, Centers for Medicare and Medicaid Services. International classification of diseases, 10th revision, clinical modification (ICD–10–CM). 2017.
- National Center for Health Statistics. 2014 NHAMCS micro-data file documentation. 2017.
- National Center for Health Statistics. 2015 NHAMCS micro-data file documentation. 2017.
- National Center for Health Statistics. 2016 NHAMCS micro-data file documentation. 2018.
- National Center for Health Statistics. 2017 NHAMCS micro-data file documentation. 2019.
- Parker JD, Talih M, Malec DJ, Beresovsky V, Carroll M, Gonzalez JF Jr, et al. National Center for Health Statistics data presentation standards for proportions. National Center for Health Statistics. Vital Health Stat 2(175). 2017.
- Ingram DD, Malec DJ, Makuc DM, Kruszon-Moran D, Gindi RM, Albert M, et al. National Center for Health Statistics guidelines for analysis of trends. National Center for Health Statistics. Vital Health Stat 2(179). 2018.
Suggested citation
Ashman JJ, Schappert SM, Santo L. Emergency department visits among adults aged 60 and over: United States, 2014–2017. NCHS Data Brief, no 367. Hyattsville, MD: National Center for Health Statistics. 2020.
Copyright information
All material appearing in this report is in the public domain and may be reproduced or copied without permission; citation as to source, however, is appreciated.
National Center for Health Statistics
Jennifer H. Madans, Ph.D., Acting Director
Amy M. Branum, Ph.D., Acting Associate Director for Science
Division of Health Care Statistics
Denys T. Lau, Ph.D., Director
Alexander Strashny, Ph.D., Associate Director for Science