Hypertension Prevalence Among Adults Aged 18 and Over: United States, 2017–2018
- Key findings
- Were differences seen in the prevalence of hypertension among adults by sex and age during 2017–2018?
- Were differences seen in the prevalence of hypertension among adults by race and Hispanic origin during 2017–2018?
- Were differences seen in the prevalence of hypertension among adults by education level during 2017–2018?
- Has overall prevalence of hypertension changed between 1999 and 2018?
- Summary
- Definitions
- Data source and methods
- About the authors
- References
- Suggested citation
PDF Version (599 KB) | Visual Abstract
Key findings
Data from the National Health and Nutrition Examination Survey
- In survey period 2017–2018, the prevalence of age-adjusted hypertension was 45.4% among adults and was higher among men (51.0%) than women (39.7%).
- Hypertension increased with age: 22.4% (aged 18–39), 54.5% (40–59), and 74.5% (60 and over).
- Hypertension prevalence was higher among non-Hispanic black (57.1%) than non-Hispanic white (43.6%) or Hispanic (43.7%) adults.
- Hypertension was lowest among college graduates compared with those having a high school education or less, and those with more than high school or some college. This trend was similar among both men and women.
- Overall hypertension prevalence decreased from 47.0% in 1999–2000 to 41.7% in 2013–2014 and then increased to 45.4% in 2017–2018.
Hypertension is a major risk factor for cardiovascular disease. Lowering blood pressure has been shown to decrease the incidences of stroke, heart attack, and heart failure (1,2). This report provides 2017–2018 U.S. hypertension prevalence estimates using the 2017 American College of Cardiology and American Heart Association definition of hypertension (3) and new guidelines, which redefine hypertension by lowering the previous threshold levels of 140/90 mmHg to 130/80 mmHg (4). This change categorizes a greater percentage of people as having hypertension.
Keywords: high blood pressure, National Health and Nutrition Examination Survey (NHANES)
Were differences seen in the prevalence of hypertension among adults by sex and age during 2017–2018?
Adjusted for age, the 2017–2018 hypertension prevalence among adults aged 18 and over was 45.4% and was higher among men (51.0%) than women (39.7%) (Figure 1). The prevalence of hypertension increased with age.
The prevalence was 22.4% among adults aged 18–39 and increased to 54.5% among those aged 40–59, and 74.5% among those aged 60 and over.
For both men and women, a similar pattern of increasing prevalence of hypertension by age was observed. Hypertension prevalence was higher among men than women aged 18–39 (31.2% compared with 13.0%) and 40–59 (59.4% compared with 49.9%), but the prevalence was not significantly different between men and women aged 60 and over (75.2% compared with 73.9%).
Figure 1. Prevalence of hypertension among adults aged 18 and over, by sex and age: United States, 2017–2018
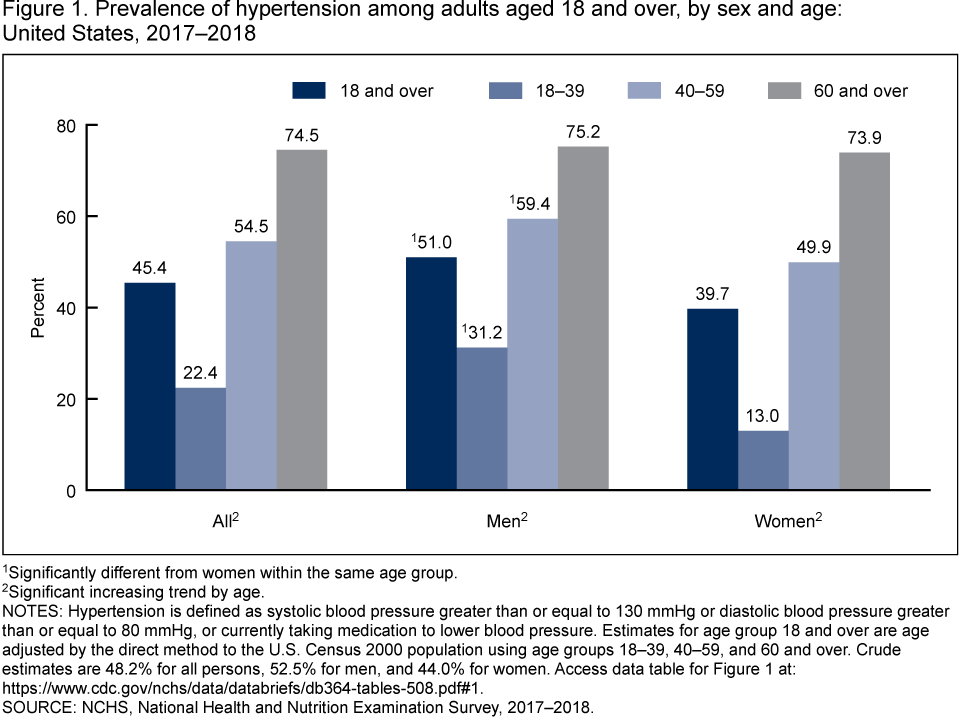
1Significantly different from women within the same age group.
2Significant increasing trend by age.
NOTES: Hypertension is defined as systolic blood pressure greater than or equal to 130 mmHg or diastolic blood pressure greater than or equal to 80 mmHg, or currently taking medication to lower blood pressure. Estimates for age group 18 and over are age adjusted by the direct method to the U.S. Census 2000 population using age groups 18–39, 40–59, and 60 and over. Crude estimates are 48.2% for all persons, 52.5% for men, and 44.0% for women. Access data table for Figure 1.
SOURCE: NCHS, National Health and Nutrition Examination Survey, 2017–2018.
Were differences seen in the prevalence of hypertension among adults by race and Hispanic origin during 2017–2018?
For all adults, the age-adjusted prevalence of hypertension was higher among non-Hispanic black (57.1%) than among non-Hispanic white (43.6%) and Hispanic (43.7%) adults (Figure 2).
Among men, the age-adjusted prevalence of hypertension was higher among non-Hispanic black (57.2%) than non-Hispanic white (50.2%) and Hispanic (50.1%) adults. Percentages of hypertension were similar between non-Hispanic white and Hispanic men.
Among women, the age-adjusted prevalence of hypertension was higher among non-Hispanic black (56.7%) than non-Hispanic white (36.7%) and Hispanic (36.8%) adults.
Both non-Hispanic white and Hispanic men had higher age-adjusted prevalence of hypertension than women of the same race and Hispanic-origin group.
Figure 2. Age-adjusted prevalence of hypertension among adults aged 18 and over, by sex and race and Hispanic origin: United States, 2017–2018
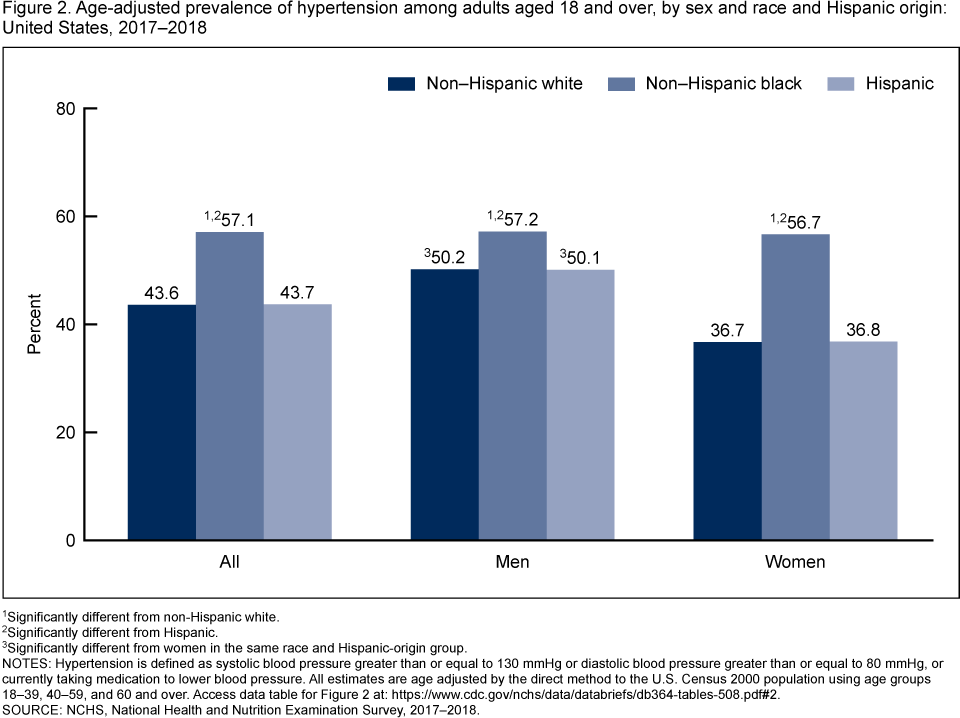
1Significantly different from non-Hispanic white.
2Significantly different from Hispanic.
3Significantly different from women in the same race and Hispanic-origin group.
NOTES: Hypertension is defined as systolic blood pressure greater than or equal to 130 mmHg or diastolic blood pressure greater than or equal to 80 mmHg, or currently taking medication to lower blood pressure. All estimates are age adjusted by the direct method to the U.S. Census 2000 population using age groups 18–39, 40–59, and 60 and over. Access data table for Figure 2.
SOURCE: NCHS, National Health and Nutrition Examination Survey, 2017–2018.
Were differences seen in the prevalence of hypertension among adults by education level during 2017–2018?
For all adults aged 18 and over, level of education was associated with the prevalence of hypertension. College graduates had a significantly lower prevalence of hypertension (38.5%) than adults with high school education or less (47.0%) or more than high school or some college (50.5%) (Figure 3).
Among men, the prevalence of hypertension was highest among adults with more than high school or some college education (57.6%) compared with adults having a high school education or less (50.0%) or college graduates (46.7%). The observed difference between men with a high school education or less and those with a college degree was not statistically significant.
Among women, hypertension prevalence was significantly lower among college graduates (31.3%) than among those with a high school education or less (42.9%) or more than high school or some college (43.9%).
Men had significantly higher prevalence of hypertension than women across all categories of education.
Figure 3. Age-adjusted prevalence of hypertension among adults aged 18 and over, by sex and education: United States, 2017–2018
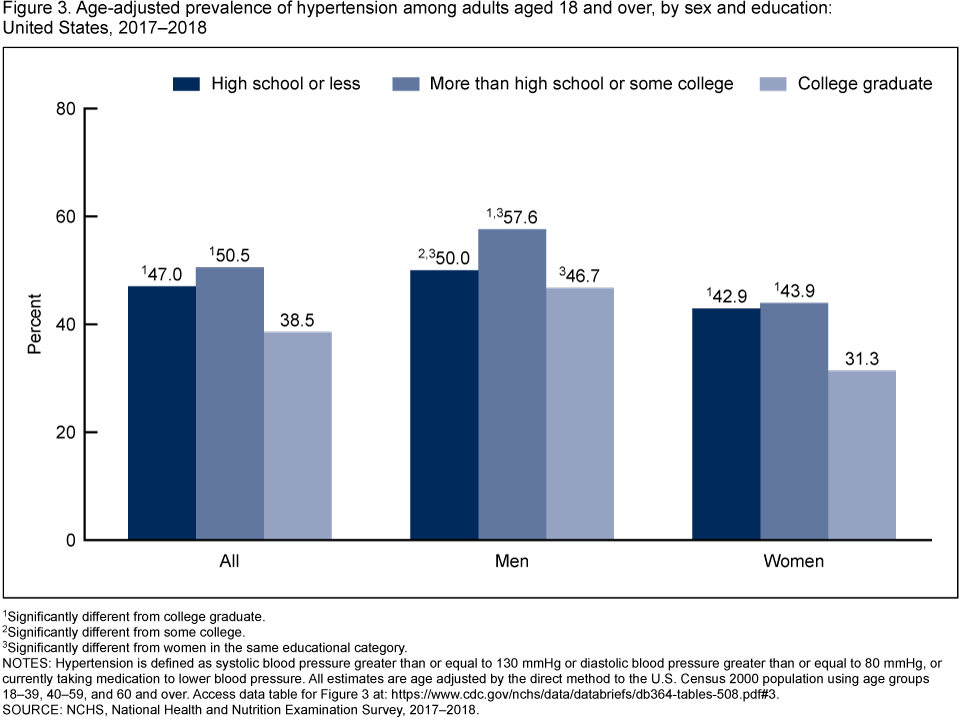
1Significantly different from college graduate.
2Significantly different from some college.
3Significantly different from women in the same educational category.
NOTES: Hypertension is defined as systolic blood pressure greater than or equal to 130 mmHg or diastolic blood pressure greater than or equal to 80 mmHg, or currently taking medication to lower blood pressure. All estimates are age adjusted by the direct method to the U.S. Census 2000 population using age groups 18–39, 40–59, and 60 and over. Access data table for Figure 3.
SOURCE: NCHS, National Health and Nutrition Examination Survey, 2017–2018.
Has overall prevalence of hypertension changed between 1999 and 2018?
Overall, the age-adjusted prevalence of hypertension decreased from 47.0% in 1999–2000 to 41.7% in 2013–2014, and then increased to 45.4% in 2017–2018 (Figure 4).
Men followed a similar pattern, with age-adjusted prevalence decreasing from 51.7% in 1999–2000 to 45.2% in 2013–2014, and then increasing to 51.0% in 2017–2018.
However, age-adjusted hypertension prevalence for women did not significantly change from 1999–2000 (42.0%) to 2017–2018 (39.7%).
Figure 4. Age-adjusted trend in hypertension prevalence among adults aged 18 and over, by sex: United States, 1999–2018
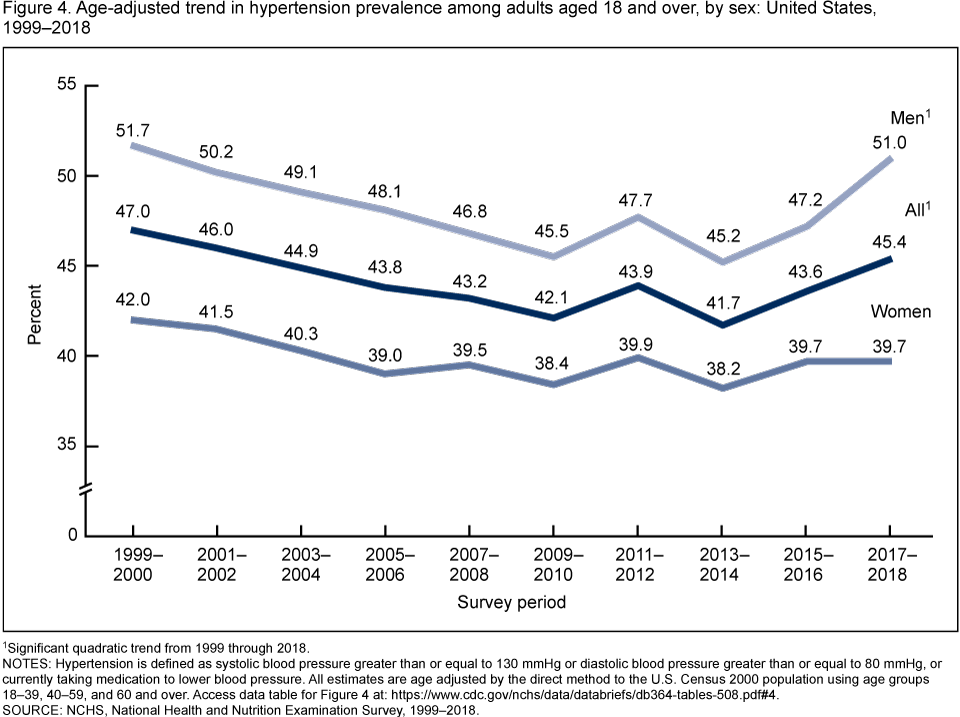
1Significant quadratic trend from 1999 through 2018.
NOTES: Hypertension is defined as systolic blood pressure greater than or equal to 130 mmHg or diastolic blood pressure greater than or equal to 80 mmHg, or currently taking medication to lower blood pressure. All estimates are age adjusted by the direct method to the U.S. Census 2000 population using age groups 18–39, 40–59, and 60 and over. Access data table for Figure 4.
SOURCE: NCHS, National Health and Nutrition Examination Survey, 1999–2018.
Summary
Forty-five percent of U.S. adults had hypertension in 2017–2018, and prevalence increased with age. Three-quarters of adults aged 60 and over had hypertension. Hypertension prevalence was highest among non-Hispanic black men and women. Level of education—specifically, being a college graduate—was associated with lower prevalence of hypertension in 2017–2018. Between 1999–2000 and 2017–2018, the prevalence of hypertension decreased and then increased among men, but no significant trend was observed among women.
In 2017, the American College of Cardiology in partnership with the American Heart Association released new guideline recommendations for the definition of hypertension. This report has adopted the new guidelines; earlier reports used the previous national guidelines (5). In contrast with the earlier high blood pressure guidelines (4), the 2017 guidelines (3) result in a higher percentage of the population being categorized as having hypertension. Based on the previous threshold of 140 mmHg for systolic and 90 mmHg for diastolic blood pressure, the 2017–2018 estimate of hypertension is 30.7%, compared with 45.4% using the new definition based on a threshold of 130 mmHg for systolic and 80 mmHg for diastolic. In general, lowering the blood pressure threshold for the diagnosis of hypertension is expected to result in earlier treatment (6).
Definitions
Hypertension: Systolic blood pressure greater than or equal to 130 mmHg or diastolic blood pressure greater than or equal to 80 mmHg, or currently taking medication to lower high blood pressure (3).
Education level: Based on response to the question, “What is the highest grade or level of school you have completed or the highest degree you have received?”
Data source and methods
Data from the National Health and Nutrition Examination Surveys (NHANES) 1999–2018 were used for these analyses. Data from the most recent 2-year survey cycle, 2017–2018, were used to test differences between demographic subgroups. Ten 2-year cycles (1999–2000 through 2017–2018) were used in testing for trends in hypertension prevalence.
NHANES is a cross-sectional survey designed to monitor the health and nutritional status of the civilian noninstitutionalized U.S. population using highly stratified, multistage probability designs (7). Since 2011–2012, non-Hispanic black, non-Hispanic Asian, and Hispanic persons, among other groups, were oversampled to obtain reliable estimates for these population subgroups. Specific race and Hispanic-origin estimates reflect persons reporting only one race; those reporting more than one race are included in the total but not reported separately.
The survey consists of interviews conducted in participants’ homes, and standardized health examinations conducted in mobile examination centers (MECs). Blood pressure was measured in the MEC by trained physicians using a standard protocol on a total sample of 5,199 nonpregnant persons aged 18 and over (8). All blood pressure readings were obtained during a single examination visit. After a 5-minute rest in a seated position, participants had up to three brachial systolic and diastolic blood pressure measurements taken 30 seconds apart. An average of up to three systolic and diastolic blood pressure readings was used for systolic and diastolic blood pressure values (8). Close to 98.0% of all participants had at least three blood pressure determinations. For participants with only one blood pressure reading, a single measurement was used.
Examination sample weights, which account for the differential probabilities of selection, nonresponse, and noncoverage, were incorporated into the estimation process. All variance estimates accounted for the complex survey design by using Taylor series linearization.
Adjusted hypertension prevalence estimates for the total adult population were age adjusted to the projected U.S. Census 2000 population using the direct method and age groups 18–39, 40–59, and 60 and over (9).
Differences between groups were tested using a t statistic at the p < 0.05 significance level. All differences reported are statistically significant unless otherwise indicated. Adjustments were not made for multiple comparisons. Linear and quadratic trends were tested using orthogonal contrast matrices. If a quadratic trend was found, Joinpoint software and piecewise regression were used to determine if changes in trend occurred over time (10). Statistical analyses were conducted using the SAS System for Windows (Release 9.4, SAS Institute Inc., Cary, N.C.) and SUDAAN (Release 11.1, RTI International, Research Triangle Park, N.C.).
About the authors
Yechiam Ostchega, Cheryl D. Fryar, Tatiana Nwankwo, and Duong T. Nguyen are with the National Center for Health Statistics, Division of Health and Nutrition Examination Surveys.
References
- SPRINT Research Group, Wright JT Jr, Williamson JD, Whelton PK, Snyder JK, Sink KM, et al. A randomized trial of intensive versus standard blood-pressure control. N Engl J Med 373(22):2103–16. 2015.
- Thomopoulos C, Parati G, Zanchetti A. Effects of blood pressure-lowering treatment on cardiovascular outcomes and mortality: 14 – Effects of different classes of antihypertensive drugs in older and younger patients: Overview and meta-analysis. J Hypertens 36(8):1637–47. 2018.
- Whelton PK, Carey RM, Aronow WS, Casey DE Jr, Collins KJ, Dennison Himmelfarb C, et al. 2017 CC/AHA/AAPA/ABC/ACPM/AGS/APhA/ASH/ASPC/NMA/PCNA guideline for the prevention, detection, evaluation, and management of high blood pressure in adults: A report of the American College of Cardiology/American Heart Association Task Force on Clinical Practice Guidelines. J Am Coll Cardiol 71(19):e127–248. 2018.
- Chobanian AV, Bakris GL, Black HR, Cushman WC, Green LA, Izzo JL Jr, et al. Seventh report of the Joint National Committee on Prevention, Detection, Evaluation, and Treatment of High Blood Pressure. Hypertension 42(6):1206–52. 2003.
- Fryar CD, Ostchega Y, Hales CM, Zhang G, Kruszon-Moran D. Hypertension prevalence and control among adults: United States, 2015–2016. NCHS Data Brief, no 289. Hyattsville, MD: National Center for Health Statistics. 2017.
- Bundy JD, Mills KT, Chen J, Li C, Greenland P, He J. Estimating the association of the 2017 and 2014 hypertension guidelines with cardiovascular events and deaths in US adults: An analysis of national data. JAMA Cardiol 3(7):572–81. 2018.
- Johnson CL, Dohrmann SM, Burt VL, Mohadjer LK. National Health and Nutrition Examination Survey: Sample design, 2011–2014. Vital Health Stat 2(162). 2014.
- National Center for Health Statistics. National Health and Nutrition Examination Survey (NHANES): Physician examination procedures manual. 2018.
- Klein RJ, Schoenborn CA. Age adjustment using the 2000 projected U.S. population. Healthy People 2010 Statistical Notes, no 20. Hyattsville, MD: National Center for Health Statistics. 2001.
- National Cancer Institute. Joinpoint trend analysis software (Version 4.4.0.0). 2017.
Suggested citation
Ostchega Y, Fryar CD, Nwankwo T, Nguyen DT. Hypertension prevalence among adults aged 18 and over: United States, 2017–2018. NCHS Data Brief, no 364. Hyattsville, MD: National Center for Health Statistics. 2020.
Copyright information
All material appearing in this report is in the public domain and may be reproduced or copied without permission; citation as to source, however, is appreciated.
National Center for Health Statistics
Jennifer H. Madans, Ph.D., Acting Director
Amy M. Branum, Ph.D., Acting Associate Director for Science
Division of Health and Nutrition Examination Surveys
Ryne Paulose-Ram, M.A., Ph.D., Acting Director
Lara J. Akinbami, M.D., Acting Associate Director for Science