Total and High-density Lipoprotein Cholesterol in Adults: United States, 2015–2018
- Key findings
- What was the prevalence of high total cholesterol among adults during 2015–2018?
- What was the prevalence of low HDL-C among adults during 2015–2018?
- What were the differences in the prevalence of low HDL-C among adults by race and Hispanic origin during 2015–2018?
- What were the trends in high total cholesterol and low HDL-C among adults?
- Summary
- Definitions
- Data source and methods
- About the authors
- References
- Suggested citation
PDF Version (534 KB) | Visual Abstract
Key findings
Data from the National Health and Nutrition Examination Survey
- During 2015–2018, 11.4% of adults had high total cholesterol, and prevalence was similar by race and Hispanic origin.
- The prevalence of high total cholesterol was highest among adults aged 40–59.
- Over one-quarter of men (26.6%) and 8.5% of women had low high-density lipoprotein cholesterol (HDL-C).
- In men, the prevalence of low HDL-C was lowest in non-Hispanic black adults. In women, prevalence was highest in Hispanic adults.
- High total cholesterol prevalence declined from 1999–2000 to 2017–2018. Low HDL-C prevalence declined from 2007–2008 to 2017–2018.
High total cholesterol (≥ 240 mg/dL) and low high-density lipoprotein cholesterol (HDL-C, < 40 mg/dL) are independent and modifiable risk factors for coronary heart disease (1–3). Declining trends were seen in the prevalence of high total cholesterol from 1999–2000 to 2015–2016 and in low HDL-C from 2007–2008 to 2015–2016 (4). This report presents 2015–2018 estimates of the prevalence of high total cholesterol and low HDL-C among U.S. adults aged 20 and over and trends through 2017–2018.
Keywords: total cholesterol, HDL, National Health and Nutrition Examination Survey
What was the prevalence of high total cholesterol among adults during 2015–2018?
During 2015–2018, the prevalence of high total cholesterol in U.S. adults was 11.4%. No significant difference was seen in the prevalence of high total cholesterol between men (10.5%) and women (12.1%) (Figure 1). The prevalence was highest among adults aged 40–59 (15.7%) compared with those aged 20–39 (7.5%) and 60 and over (11.4%). Adults aged 60 and over also had a higher prevalence of high total cholesterol than adults aged 20–39. No significant differences were seen between race and Hispanic-origin groups in the prevalence of high total cholesterol among adults.
Figure 1. Prevalence of high total cholesterol among adults aged 20 and over, by sex, age, and race and Hispanic origin: United States, 2015–2018
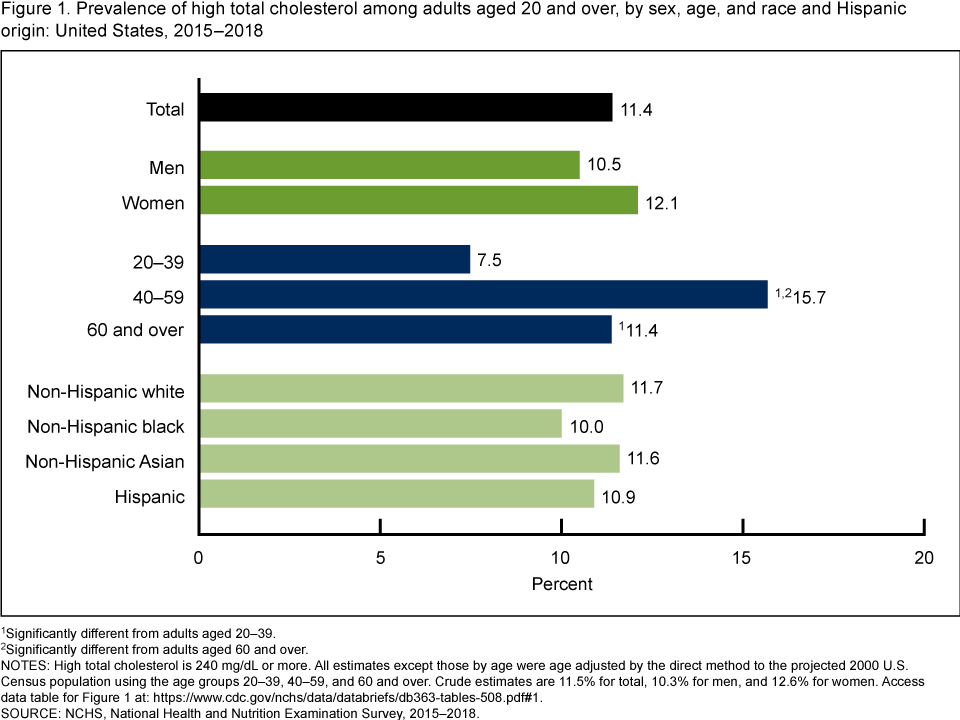
1Significantly different from adults aged 20–39.
2Significantly different from adults aged 60 and over.
NOTES: High total cholesterol is 240 mg/dL or more. All estimates except those by age were age adjusted by the direct method to the projected 2000 U.S. Census population using the age groups 20–39, 40–59, and 60 and over. Crude estimates are 11.5% for total, 10.3% for men, and 12.6% for women. Access data table for Figure 1.
SOURCE: NCHS, National Health and Nutrition Examination Survey, 2015–2018.
What was the prevalence of low HDL-C among adults during 2015–2018?
The prevalence of low HDL-C among adults aged 20 and over was 17.2% in 2015–2018 and was higher among those aged 20–39 (17.6%) and 40–59 (18.5%) than among those aged 60 and over (14.6%) (Figure 2).
Among men, the prevalence of low HDL-C was higher among those aged 40–59 (29.6%) than those aged 60 and over (24.6%). While the difference in prevalence between men aged 20–39 (25.0%) and 40–59 was similar to the difference between men aged 60 and over and 40–59, it was not statistically significant.
In women, the prevalence of low HDL-C declined with age, from 10.3% among those aged 20–39 to 7.8% among those aged 40–59 and 6.4% among those aged 60 and over.
The prevalence of low HDL-C was over three times higher among men (26.6%) than among women (8.5%). The prevalence was higher among men than among women in each age group.
Figure 2. Prevalence of low high-density lipoprotein cholesterol among adults aged 20 and over, by sex and age: United States, 2015–2018
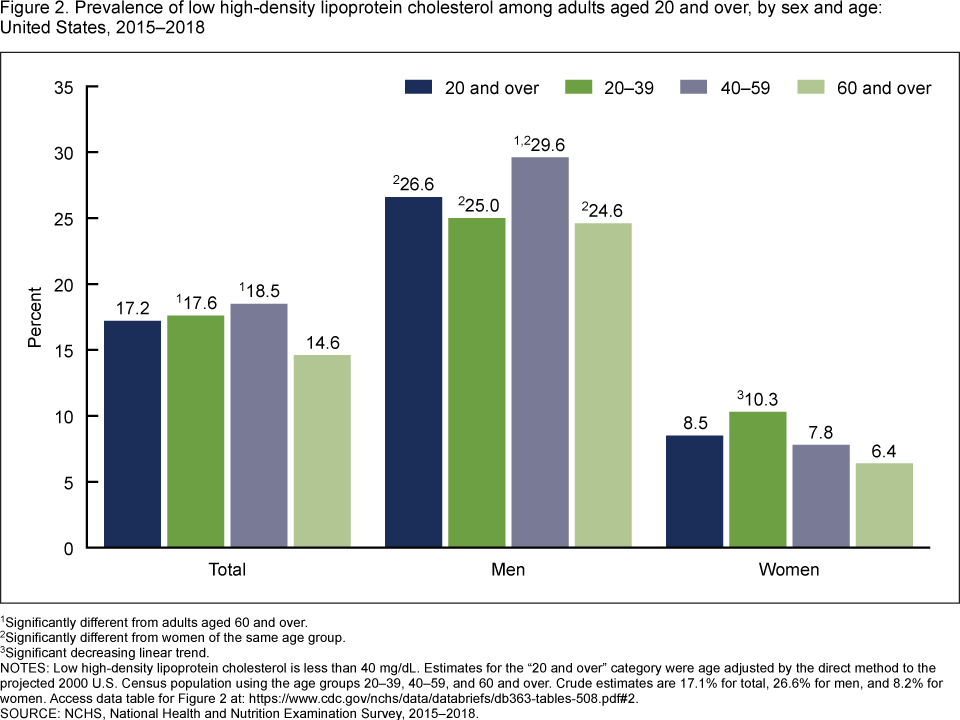
1Significantly different from adults aged 60 and over.
2Significantly different from women of the same age group.
3Significant decreasing linear trend.
NOTES: Low high-density lipoprotein cholesterol is less than 40 mg/dL. Estimates for the “20 and over” category were age adjusted by the direct method to the projected 2000 U.S. Census population using the age groups 20–39, 40–59, and 60 and over. Crude estimates are 17.1% for total, 26.6% for men, and 8.2% for women. Access data table for Figure 2.
SOURCE: NCHS, National Health and Nutrition Examination Survey, 2015–2018.
What were the differences in the prevalence of low HDL-C among adults by race and Hispanic origin during 2015–2018?
The prevalence of low HDL-C was lowest in non-Hispanic black (11.9%) adults compared with non-Hispanic white (16.6%), non-Hispanic Asian (15.8%), and Hispanic (21.9%) adults. The prevalence of low HDL-C was also lower in non-Hispanic white and non-Hispanic Asian adults than in Hispanic adults (Figure 3).
Among men, similar to differences seen among all adults, the prevalence of low HDL-C was lowest in non-Hispanic black men (17.0%) compared with non-Hispanic white (26.3%), non-Hispanic Asian (26.3%), and Hispanic (31.9%) men, and was lower in both non-Hispanic white and non-Hispanic Asian men than in Hispanic men.
Among women, the prevalence of low HDL-C was lower in non-Hispanic white (7.4%), non-Hispanic black (7.9%), and non-Hispanic Asian (6.7%) women than in Hispanic women (12.3%).
The prevalence of low HDL-C was consistently lower among women than among men across all race and Hispanic-origin groups.
Figure 3. Age-adjusted prevalence of low high-density lipoprotein cholesterol among adults aged 20 and over, by sex and race and Hispanic origin: United States, 2015–2018
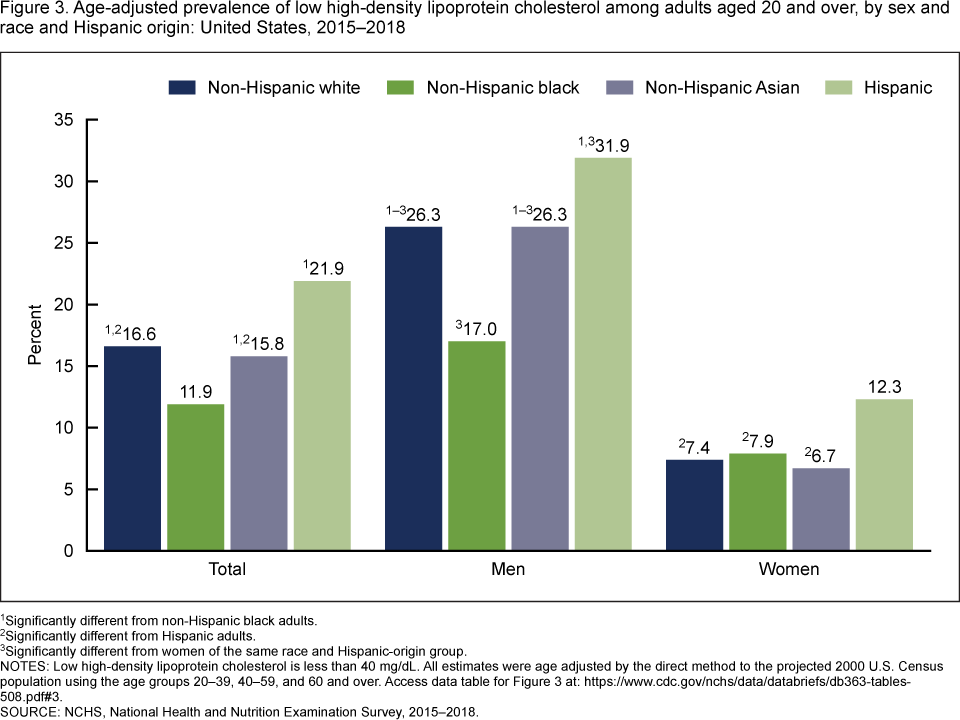
1Significantly different from non-Hispanic black adults.
2Significantly different from Hispanic adults.
3Significantly different from women of the same race and Hispanic-origin group.
NOTES: Low high-density lipoprotein cholesterol is less than 40 mg/dL. All estimates were age adjusted by the direct method to the projected 2000 U.S. Census population using the age groups 20–39, 40–59, and 60 and over. Access data table for Figure 3.
SOURCE: NCHS, National Health and Nutrition Examination Survey, 2015–2018.
What were the trends in high total cholesterol and low HDL-C among adults?
The prevalence of high total cholesterol declined from 18.3% in 1999–2000 to 10.5% in 2017–2018. The prevalence of low HDL-C declined from 22.2% during 2007–2008 to 16.0% during 2017–2018 (Figure 4).
Figure 4. Trends in age-adjusted prevalence of high total cholesterol and low high-density lipoprotein cholesterol among adults aged 20 and over: United States, 1999–2000 through 2017–2018
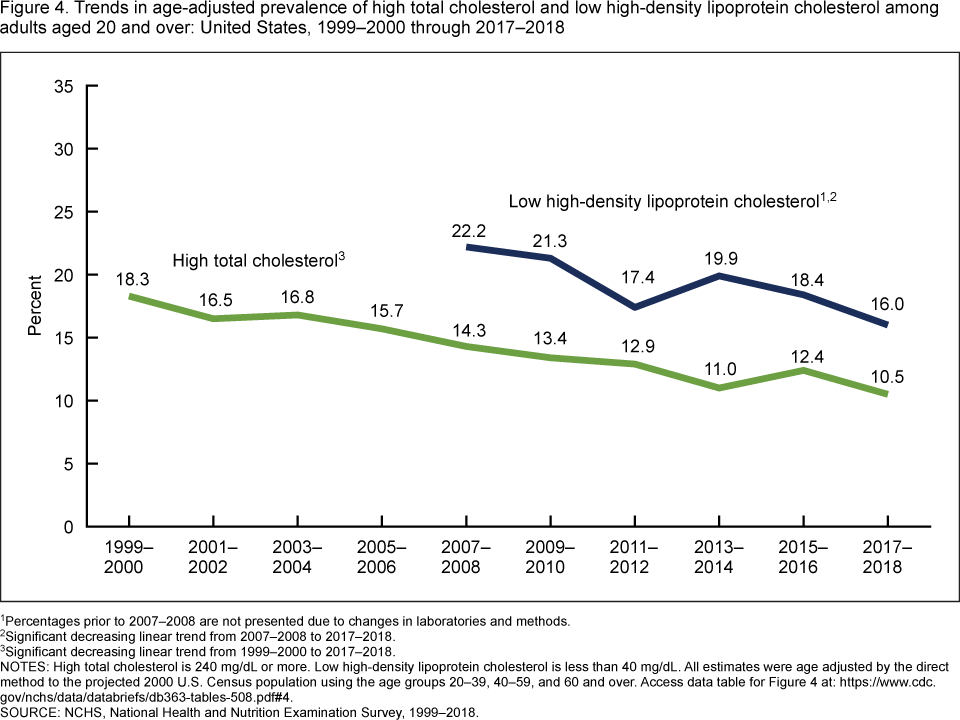
1Percentages prior to 2007–2008 are not presented due to changes in laboratories and methods.
2Significant decreasing linear trend from 2007–2008 to 2017–2018.
3Significant decreasing linear trend from 1999–2000 to 2017–2018.
NOTES: High total cholesterol is 240 mg/dL or more. Low high-density lipoprotein cholesterol is less than 40 mg/dL. All estimates were age adjusted by the direct method to the projected 2000 U.S. Census population using the age groups 20–39, 40–59, and 60 and over. Access data table for Figure 4.
SOURCE: NCHS, National Health and Nutrition Examination Survey, 1999–2018.
Summary
During 2015–2018, 11.4% of adults had high total cholesterol, and 17.2% had low HDL-C. No significant difference was seen in the prevalence of high total cholesterol between men and women, but the prevalence of low HDL-C was over three times higher in men than women. No significant differences in prevalence of high total cholesterol were observed between race and Hispanic-origin groups. The prevalence of low HDL-C was lowest in non-Hispanic black adults overall and among men, but not among women. Declining trends were seen in the prevalence of high total cholesterol between 1999–2000 and 2017–2018 and low HDL-C between 2007–2008 and 2017–2018.
In this report, low HDL-C for both men and women is defined as an HDL-C level of less than 40 mg/dL. In contrast, a sex-specific definition of less than 40 mg/dl for men and less than 50 mg/dL for women is used to define metabolic syndrome, a group of risk factors that raise the risk of heart disease (5).
In its task of monitoring the health of the U.S. population, Healthy People 2020 established a goal of lowering the percentage of adults with high total cholesterol to no more than 13.5% (6). During 2015–2018, the overall prevalence in both men and women met this goal, however, the prevalence of high total cholesterol among adults aged 40–59 was above this goal.
Definitions
High total cholesterol: Serum total cholesterol greater than or equal to 240 mg/dL.
Low high-density lipoprotein cholesterol (HDL-C): Serum HDL-C less than 40 mg/dL.
Data source and methods
Data from the National Health and Nutrition Examination Survey (NHANES) from 1999–2000 through 2017–2018 were used for these analyses. Data from NHANES 2015–2018 were used to test differences between subgroups. Ten 2-year cycles (1999–2018) were used in testing for trends in the prevalence of high total cholesterol, and six 2-year cycles (2007–2018) were used for prevalence of low HDL-C. The methods used to measure HDL-C concentration prior to 2007 differed and may not be directly comparable with 2007–2008 and subsequent cycles (7).
NHANES is a cross-sectional survey designed to monitor the health and nutritional status of the civilian noninstitutionalized U.S. population using highly stratified, multistage probability designs (8). The survey consists of an interview conducted in participants’ homes and standardized physical examinations conducted in mobile examination centers.
In 2015–2018, non-Hispanic black, non-Hispanic Asian, and Hispanic persons, among other groups, were oversampled to obtain reliable estimates for these population subgroups. Specific race and Hispanic-origin estimates reflect persons reporting only one race. Those reporting more than one race are included in the total only and are not shown separately.
Examination sample weights, accounting for the differential selection probabilities and adjusting for nonresponse and noncoverage, were used to estimate prevalence. Standard errors of these prevalences were estimated by Taylor series linearization (9), a design-based method. Estimates were age adjusted to the projected 2000 U.S. standard population (10) using the age groups 20–39, 40–59, and 60 and over, to compare prevalence estimates between subgroups or over time that differ with respect to their age distributions.
Differences between groups were tested using a t statistic at the p < 0.05 significance level. Linear trends were tested using orthogonal contrast matrices. All differences reported are statistically significant unless otherwise indicated. Adjustments were not made for multiple comparisons. Statistical analyses were conducted using the SAS System for Windows version 9.4 (SAS Institute, Inc., Cary, N.C.) and SUDAAN version 11.1 (RTI International, Research Triangle Park, N.C.).
About the authors
Margaret D. Carroll and Cheryl D. Fryar are with the National Center for Health Statistics, Division of Health and Nutrition Examination Surveys.
References
- Wilson PW, D’Agostino RB, Levy D, Belanger AM, Silbershatz H, Kannel WB. Prediction of coronary heart disease using risk factor categories. Circulation 97(18):1837–47. 1998.
- Stamler J, Wentworth D, Neaton JD. Is the relationship between serum cholesterol and risk of premature death from coronary heart disease continuous or graded? Findings in 356,222 primary screenees of the Multiple Risk Factor Intervention Trial (MRFIT). JAMA 256(20):2823–8. 1986.
- Assmann G, Schulte H, von Eckardstein A, Huang Y. High-density lipoprotein cholesterol as a predictor of coronary heart disease risk. The PROCAM experience and pathophysiological implications for reverse cholesterol transport. Atherosclerosis 124 Suppl:S11–20. 1996.
- Carroll MD, Fryar CD, Nguyen DO. Total and high-density lipoprotein cholesterol in adults: United States, 2015–2016. NCHS Data Brief, no 290. Hyattsville, MD: National Center for Health Statistics. 2017.
- National Heart, Lung and Blood Institute. Metabolic syndrome.
- Office of Disease Prevention and Health Promotion. Healthy People 2020 topics and objectives: Heart disease and stroke.
- National Center for Health Statistics. National Health and Nutrition Examination Survey: 2007–2008 data documentation, codebook, and frequencies. 2010.
- National Center for Health Statistics. National Health and Nutrition Examination Survey: NHANES questionnaires, datasets, and related documentation.
- Wolter KM. Chapter 6: Taylor series methods. In: Introduction to variance estimation. 2nd ed. New York, NY: Springer. 2007.
- Klein RJ, Schoenborn CA. Age adjustment using the 2000 projected U.S. population. Healthy People Statistical Notes, no 20. Hyattsville, MD: National Center for Health Statistics. 2001.
Suggested citation
Carroll MD, Fryar CD. Total and high-density lipoprotein cholesterol in adults: United States, 2015–2018. NCHS Data Brief, no 363. Hyattsville, MD: National Center for Health Statistics. 2020.
Copyright information
All material appearing in this report is in the public domain and may be reproduced or copied without permission; citation as to source, however, is appreciated.
National Center for Health Statistics
Jennifer H. Madans, Ph.D., Acting Director
Amy M. Branum, Ph.D., Acting Associate Director for Science
Division of Health and Nutrition Examination Surveys
Ryne Paulose-Ram, M.A., Ph.D., Acting Director
Lara Akinbami, M.D., Acting Associate Director for Science