Recent Trends in Vaginal Birth After Cesarean Delivery: United States, 2016–2018
- Key findings
- The VBAC rate increased during 2016–2018 overall and for women in their 20s and 30s.
- VBAC rates increased for most race and Hispanic-origin groups from 2016 through 2018.
- VBAC rates increased in 17 states from 2016 through 2018.
- By gestational age, VBAC rates increased among births delivered at 38 and greater weeks from 2016 through 2018.
- Summary
- Definition
- Data source and methods
- About the authors
- References
- Suggested citation
PDF Version (480 KB)
Michelle J.K. Osterman, M.H.S.
Key findings
Data from the National Vital Statistics System
- Rates of vaginal birth after previous cesarean delivery (VBAC) increased from 12.4% in 2016 to 12.8% in 2017 and 13.3% in 2018.
- From 2016 through 2018, VBAC rates increased for women in their 20s and 30s.
- All race and Hispanic-origin groups had higher VBAC rates in 2018 than in 2016 except non-Hispanic Native Hawaiian or Other Pacific Islander women.
- In 2018 compared with 2016, VBAC rates increased in 17 states and declined in 1 state.
- VBAC rates increased 5%–13% among births delivered at 38, 39, 40, and 41 or more weeks of gestation.
Keywords: race and Hispanic origin, age of mother, method of delivery, gestational age, National Vital Statistics System
For the first time since 2004 (1), national data on vaginal birth after cesarean delivery (VBAC) became available in 2016 after all reporting areas implemented the 2003 revision of the U.S. Standard Certificate of Live Birth. Women who deliver vaginally after a previous cesarean are less likely to experience birth-related morbidity such as blood transfusion, ruptured uterus, unplanned hysterectomy, and admission to the Intensive Care Unit than women who have repeat cesareans (2). This report describes recent trends in the VBAC rates by maternal age, race and Hispanic origin, mother’s state of residence, and gestational age of the newborn from 2016 to 2018.
The VBAC rate increased during 2016–2018 overall and for women in their 20s and 30s.
- The VBAC rate increased from 12.4% of births to women with a previous cesarean delivery in 2016 to 12.8% in 2017, and to 13.3% in 2018 (up 7% in 2018 from 2016) (Figure 1).
- VBAC rates increased for women in their 20s and 30s during 2016–2018. Rates increased from 12.7% to 13.6% for women aged 20–29 and from 12.4% to 13.3% for women aged 30–39.
- The observed increases in VBAC rates for 2016 compared with 2018 for women under 20 (12.7% to 13.5%) and women aged 40 and over (10.7% to 11.0%) were not statistically significant.
Figure 1. Rates of vaginal birth after cesarean delivery, by age of mother: United States, 2016–2018
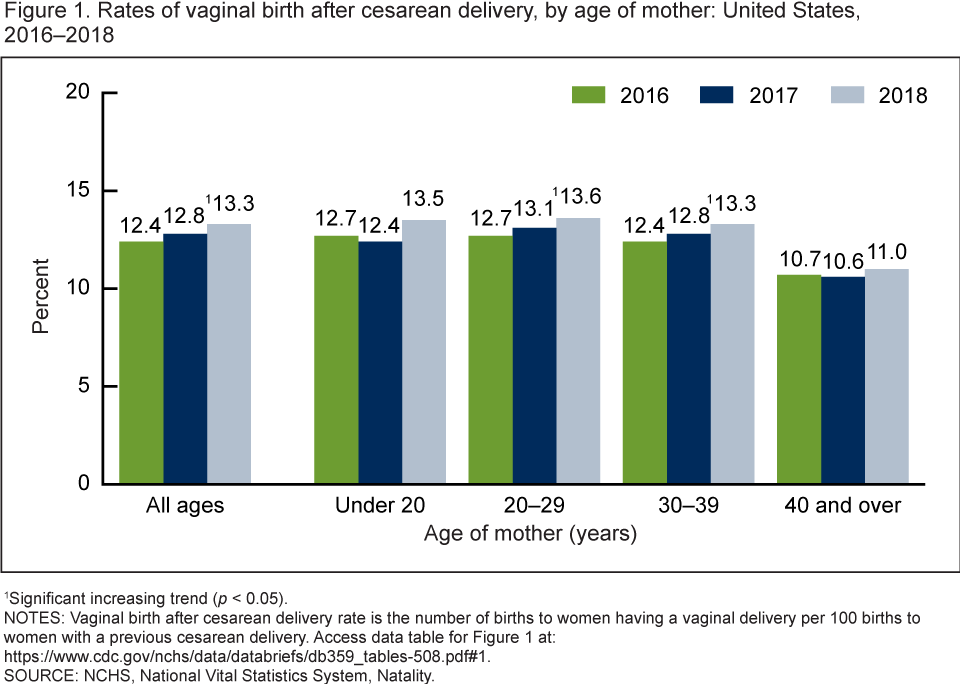
1Significant increasing trend (p < 0.05).
NOTES: Vaginal birth after cesarean delivery rate is the number of births to women having a vaginal delivery per 100 births to women with a previous cesarean delivery. Access data table for Figure 1.
SOURCE: NCHS, National Vital Statistics System, Natality.
VBAC rates increased for most race and Hispanic-origin groups from 2016 through 2018.
- VBAC rates increased from 2016 through 2018 for all race and Hispanic-origin groups except for births to Native Hawaiian or Other Pacific Islander (NHOPI) women (Figure 2).
- Increases ranged from 5% for non-Hispanic white (12.8% to 13.5%), non-Hispanic black (12.4% to 13.0%), and non-Hispanic Asian (12.9% to 13.6%) women to 10% for Hispanic women (11.5% to 12.7%) and 11% for non-Hispanic American Indian or Alaska Native women (13.4% to 14.9%).
- For non-Hispanic NHOPI women, VBAC rates declined 7% from 2016 through 2018, from 20.8% to 19.4%.
Figure 2. Rates of vaginal birth after cesarean delivery, by race and Hispanic origin of mother: United States, 2016–2018
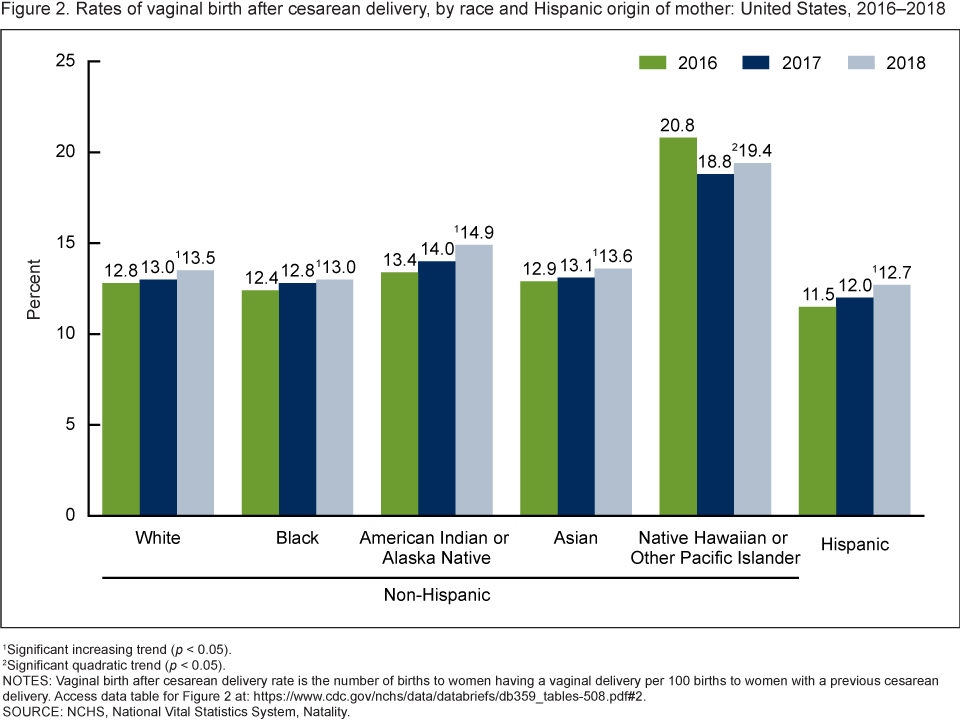
1Significant increasing trend (p < 0.05).
2Significant quadratic trend (p < 0.05).
NOTES: Vaginal birth after cesarean delivery rate is the number of births to women having a vaginal delivery per 100 births to women with a previous cesarean delivery. Access data table for Figure 2.
SOURCE: NCHS, National Vital Statistics System, Natality.
VBAC rates increased in 17 states from 2016 through 2018.
- From 2016 through 2018, VBAC rates increased in 17 states. Four states (Arkansas, California, Florida, and New Hampshire) had increases of more than 20% over this time (Figure 3).
- An increase in 2018 compared with 2016 was observed in an additional 20 states and the District of Columbia, although the changes were not statistically significant.
- One state (Wisconsin) had a significantly lower VBAC rate in 2018 (19.2%) than in 2016 (20.5%); nonsignificant declines were observed for 12 states.
Figure 3. Change in rates of vaginal birth after cesarean delivery, by state: United States, 2016 and 2018
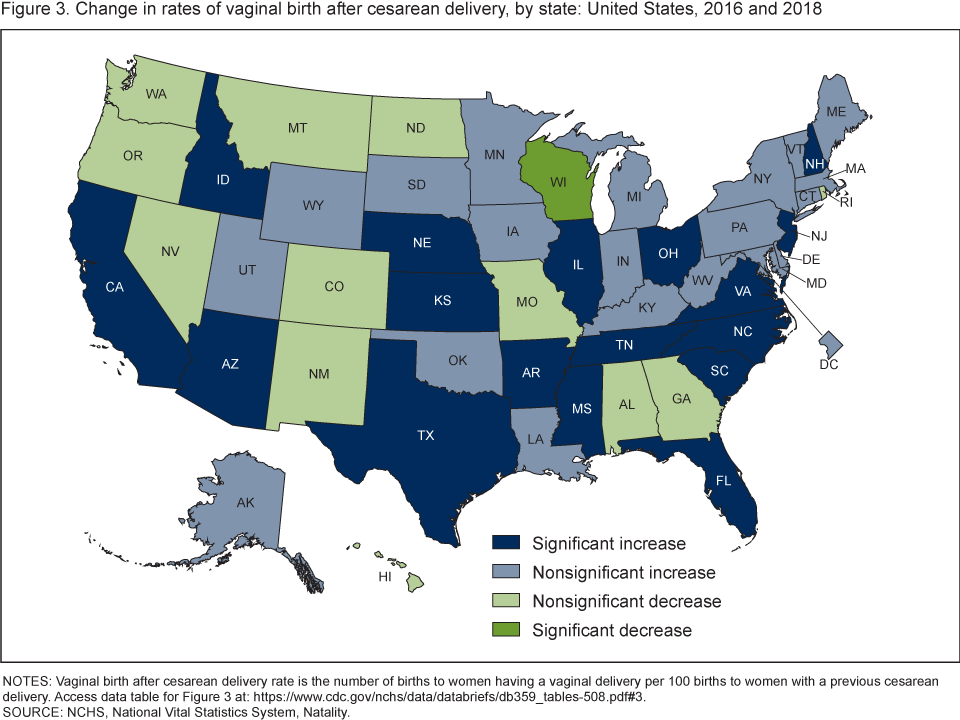
NOTES: Vaginal birth after cesarean delivery rate is the number of births to women having a vaginal delivery per 100 births to women with a previous cesarean delivery. Access data table for Figure 3.
SOURCE: NCHS, National Vital Statistics System, Natality.
By gestational age, VBAC rates increased among births delivered at 38 and greater weeks from 2016 through 2018.
- Changes in VBAC varied by gestational age. Births under 28 weeks were less likely to be delivered via VBAC in 2018 (26.4%) than in 2016 (27.9%), although this observed decline was not significant; VBAC births were similar at 28–33 weeks between 2016 (10.3%) and 2018 (10.8%).
- There was essentially no change in the VBAC rate among births delivered at 37 weeks (from 10.6% in 2016 to 10.7% in 2018).
- VBAC rates increased for all gestational ages of 38 or more weeks. At 38 weeks, the VBAC rate increased 7% from 14.0% to 15.0% (Figure 4). VBAC deliveries increased 13%, from 8.0% to 9.0% at 39 weeks, and 10%, from 33.8% to 37.3% at 40 weeks.
- The VBAC rate increased 5% among late- or post-term births (41 or more weeks), from 43.4% in 2016 to 45.6% in 2018.
Figure 4. Rates of vaginal birth after cesarean delivery, by gestational age: United States, 2016 and 2018
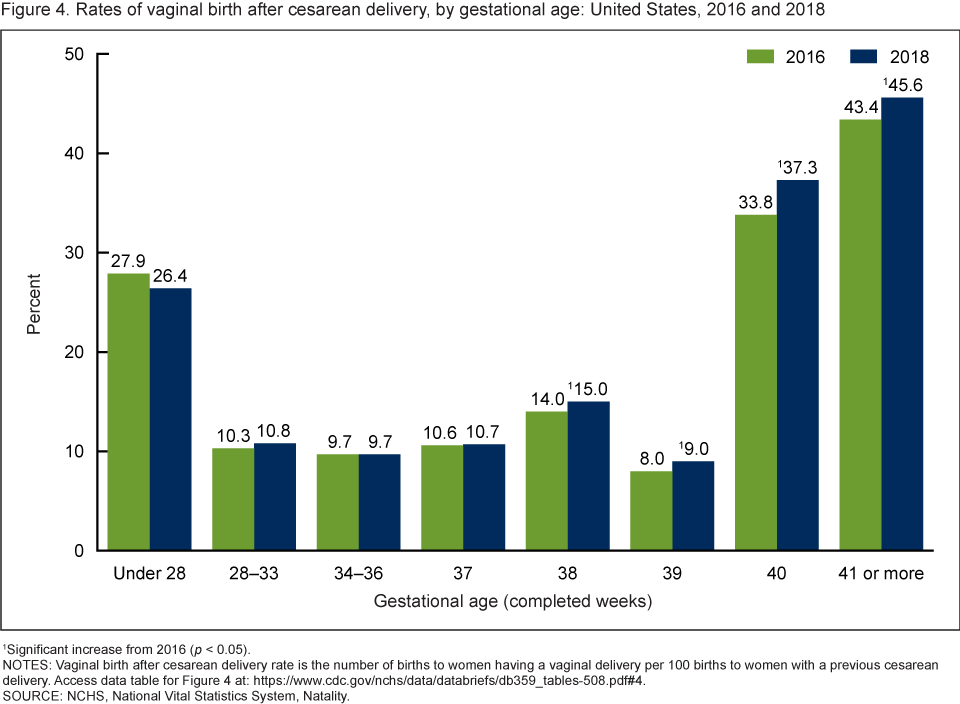
1Significant increase from 2016 (p < 0.05).
NOTES: Vaginal birth after cesarean delivery rate is the number of births to women having a vaginal delivery per 100 births to women with a previous cesarean delivery. Access data table for Figure 4.
SOURCE: NCHS, National Vital Statistics System, Natality.
Summary
From 2016 to 2018, VBAC rates in the United States increased each year, reaching 13.3% in 2018. Increases in VBAC rates were widespread, rising among women in their 20s and 30s, for most race and Hispanic-origin groups, in 17 states, and among births delivered at 38 weeks of gestation and greater.
The Healthy People 2020 goal is to increase VBAC to 18.3% of women with a previous cesarean delivery (3). If the current annual rate of increase continues (3%–4% per year), the total VBAC rate would reach this goal in approximately 10 years.
Definition
Vaginal birth after cesarean delivery rate (VBAC): Number of births to women having a vaginal delivery per 100 births to women with a previous cesarean delivery.
Data source and methods
This report is based on data from the Natality Data Files from the National Vital Statistics System. The vital statistics natality file is derived from birth certificates and includes information for all births occurring in the United States. The natality files include information on a wide range of maternal and infant demographic and health characteristics for babies born in the United States.
Race and Hispanic origin are reported separately on the birth certificate. Persons of Hispanic origin may be of any race. Persons of non-Hispanic ancestry are further classified by race because there are substantial differences in fertility between Hispanic and non-Hispanic persons. Single race is defined as only one race reported on the birth certificate.
References to differences in VBAC rates indicate that the change is statistically significant at the 0.05 level based on a two-tailed z test unless otherwise noted. Trends are statistically significant at the 0.05 level and were assessed using the Cochran-Armitage test for trends, a modified chi squared test.
About the authors
Michelle J.K. Osterman is with the National Center for Health Statistics, Division of Vital Statistics, Reproductive Statistics Branch.
References
- Martin JA, Hamilton BE, Sutton PD, Ventura SJ, Menacker F, Kirmeyer S. Births: Final data for 2004. National Vital Statistics Reports; vol 55 no 1. Hyattsville, MD: National Center for Health Statistics. 2006.
- Curtin SC, Gregory KD, Korst LM, Uddin SF. Maternal morbidity for vaginal and cesarean deliveries, according to previous cesarean history: New data from the birth certificate, 2013. National Vital Statistics Reports; vol 64 no 4. Hyattsville, MD: National Center for Health Statistics. 2015.
- U.S. Department of Health and Human Services, Office of Disease Prevention and Health Promotion. Healthy People 2020: Maternal, infant, and child health. Washington, D.C.
Suggested citation
Osterman MJK. Recent trends in vaginal birth after cesarean delivery: United States, 2016–2018. NCHS Data Brief, no 359. Hyattsville, MD: National Center for Health Statistics. 2020.
Copyright information
All material appearing in this report is in the public domain and may be reproduced or copied without permission; citation as to source, however, is appreciated.
National Center for Health Statistics
Jennifer H. Madans, Ph.D., Acting Director
Amy M. Branum, Ph.D., Acting Associate Director for Science
Division of Vital Statistics
Steven Schwartz, Ph.D., Director
Hanyu Ni, Ph.D., M.P.H., Associate Director for Science