Racial and Ethnic Differences in the Prevalence of Attention-deficit/Hyperactivity Disorder and Learning Disabilities Among U.S. Children Aged 3–17 Years
- Key findings
- Does the prevalence of diagnosed ADHD or a learning disability vary by race and ethnicity?
- Does the prevalence of diagnosed ADHD or a learning disability vary by both race and ethnicity and age?
- Does the prevalence of diagnosed ADHD or a learning disability vary by both race and ethnicity and family poverty level?
- Does the prevalence of diagnosed ADHD or a learning disability vary by both race and ethnicity and parental educational attainment?
- Summary
- Definitions
- Data source and methods
- About the authors
- References
- Suggested citation
PDF Version (402 KB)
Key findings
Data from the National Health Interview Survey, 2016–2018
- In 2016–2018, nearly 14% of children aged 3–17 years were reported as ever having been diagnosed with either attention-deficit/hyperactivity disorder (ADHD) or a learning disability; non-Hispanic black children were the most likely to be diagnosed (16.9%).
- Among children aged 3–10 years, non-Hispanic black children were more likely to have ever been diagnosed with ADHD or a learning disability compared with non-Hispanic white or Hispanic children.
- Diagnosis of ADHD or a learning disability differed by federal poverty level for children in all racial and ethnic groups.
- Diagnosis of ADHD or a learning disability differed by parental education among non-Hispanic white children only.
Attention-deficit/hyperactivity disorder (ADHD) and learning disabilities are the most commonly diagnosed neurodevelopmental disorders in children and often coexist (1,2). Previous research has suggested that the prevalence of these conditions may differ by race and Hispanic origin (3,4). Using timely, nationally representative data, this report examines the reported prevalence of ADHD and learning disabilities by race and ethnicity and select demographic characteristics that are associated with the diagnosis of these conditions (1).
Keywords: poverty, education, neurodevelopmental disorders, National Health Interview Survey
Does the prevalence of diagnosed ADHD or a learning disability vary by race and ethnicity?
- In 2016–2018, 13.8% of children aged 3–17 years had ever been diagnosed with either ADHD or a learning disability. Non-Hispanic black children (16.9%) were more likely than non-Hispanic white (14.7%) or Hispanic (11.9%) children to be diagnosed with either condition (Figure 1).
- Non-Hispanic white children were more likely to be diagnosed with ADHD or a learning disability than Hispanic children.
Figure 1. Prevalence of children aged 3–17 years ever diagnosed with attention-deficit/hyperactivity disorder or a learning disability, by race and ethnicity: United States, 2016–2018
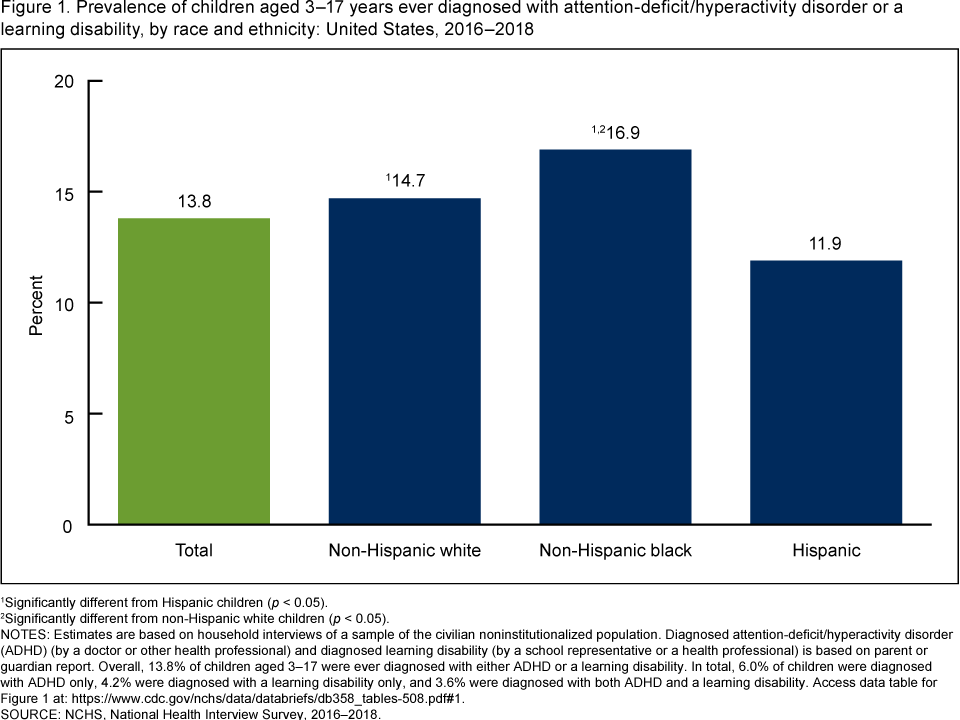
1Significantly different from Hispanic children (p < 0.05).
2Significantly different from non-Hispanic white children (p < 0.05).
NOTES: Estimates are based on household interviews of a sample of the civilian noninstitutionalized population. Diagnosed attention-deficit/hyperactivity disorder (ADHD) (by a doctor or other health professional) and diagnosed learning disability (by a school representative or a health professional) is based on parent or guardian report. Overall, 13.8% of children aged 3–17 were ever diagnosed with either ADHD or a learning disability. In total, 6.0% of children were diagnosed with ADHD only, 4.2% were diagnosed with a learning disability only, and 3.6% were diagnosed with both ADHD and a learning disability. Access data table for Figure 1.
SOURCE: NCHS, National Health Interview Survey, 2016–2018.
Does the prevalence of diagnosed ADHD or a learning disability vary by both race and ethnicity and age?
- Overall, children aged 3–10 years (10.1%) were less likely to ever be diagnosed with ADHD or a learning disability compared with children aged 11–17 years (18.1%). This pattern was consistent across all racial and ethnic groups (Figure 2).
- Among children aged 3–10 years, non-Hispanic black children (12.8%) were more likely to be diagnosed with ADHD or a learning disability than non-Hispanic white (10.1%) or Hispanic (10.1%) children.
- Among children aged 11–17 years, Hispanic children (14.2%) were less likely to be diagnosed with ADHD or a learning disability than non-Hispanic black (21.6%) and non-Hispanic white (19.7%) children.
Figure 2. Prevalence of children aged 3–17 years ever diagnosed with attention-deficit/hyperactivity disorder or a learning disability, by age group and race and ethnicity: United States, 2016–2018
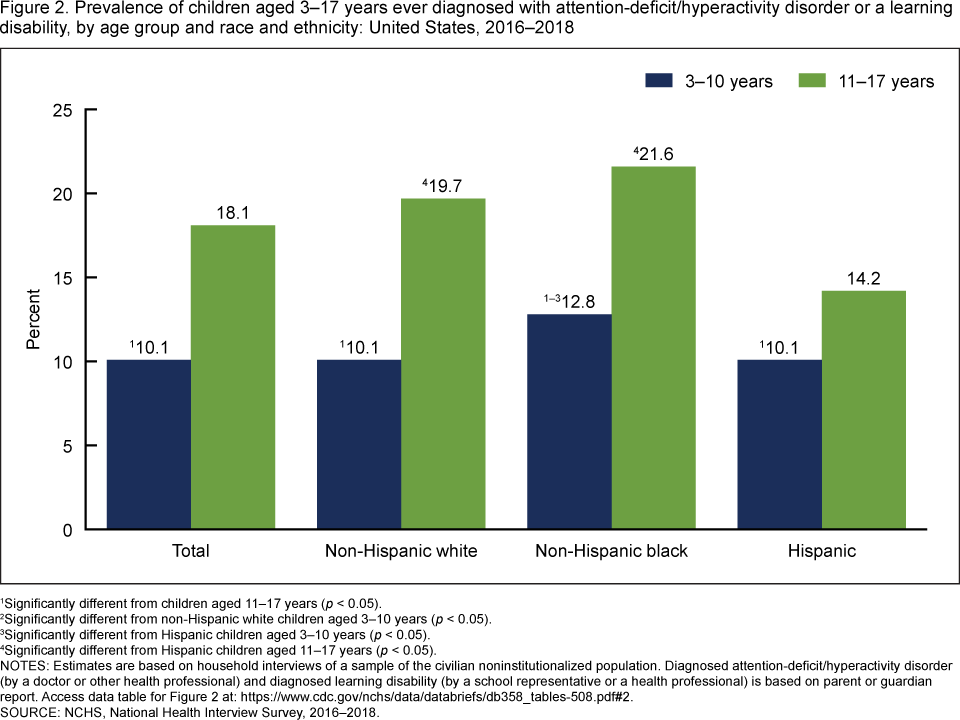
1Significantly different from children aged 11–17 years (p < 0.05).
2Significantly different from non-Hispanic white children aged 3–10 years (p < 0.05).
3Significantly different from Hispanic children aged 3–10 years (p < 0.05).
4Significantly different from Hispanic children aged 11–17 years (p < 0.05).
NOTES: Estimates are based on household interviews of a sample of the civilian noninstitutionalized population. Diagnosed attention-deficit/hyperactivity disorder (by a doctor or other health professional) and diagnosed learning disability (by a school representative or a health professional) is based on parent or guardian report. Access data table for Figure 2.
SOURCE: NCHS, National Health Interview Survey, 2016–2018.
Does the prevalence of diagnosed ADHD or a learning disability vary by both race and ethnicity and family poverty level?
- Overall, children living in families at less than 100% of the federal poverty level (18.7%) were more likely to be diagnosed with ADHD or a learning disability compared with children living in families at 100% or more of the federal poverty level (12.7%). This pattern was consistent across all racial and ethnic groups (Figure 3).
- Among children living in families at less than 100% of the federal poverty level, non-Hispanic white (24.6%) and non-Hispanic black (20.2%) children were more likely to be diagnosed with ADHD or a learning disability than Hispanic children (14.1%).
- Similarly, among children living in families at 100% or more of the federal poverty level, non-Hispanic white (13.7%) and non-Hispanic black (15.2%) children were more likely to be diagnosed with ADHD or a learning disability than Hispanic children (10.9%).
Figure 3. Prevalence of children aged 3–17 years ever diagnosed with attention-deficit/hyperactivity disorder or a learning disability, by family poverty level and race and ethnicity: United States,
2016–2018
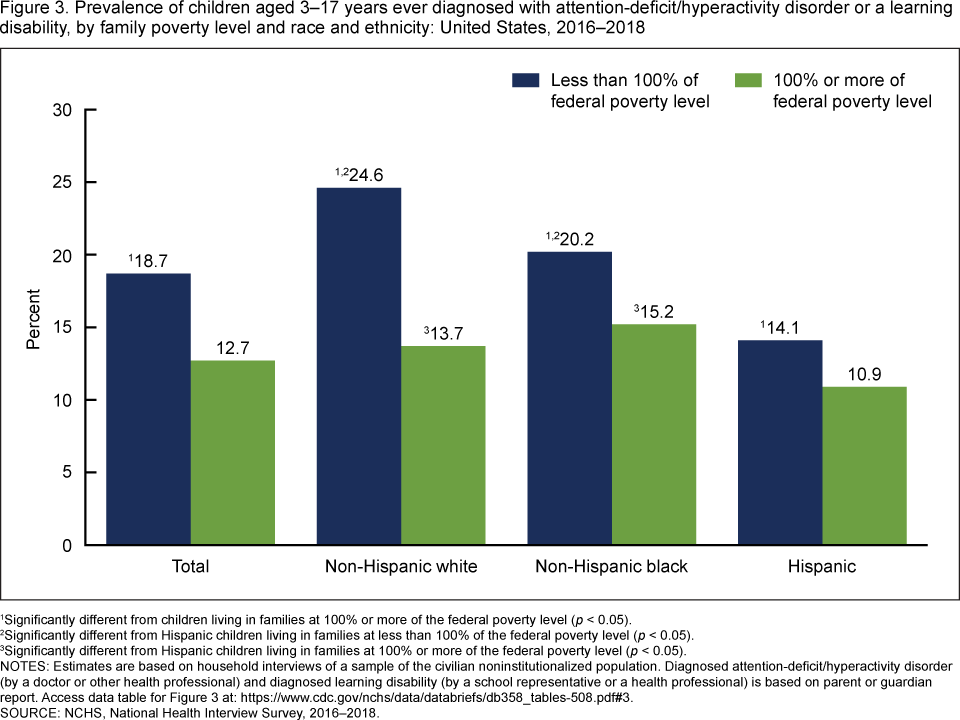
1Significantly different from children living in families at 100% or more of the federal poverty level (p < 0.05).
2Significantly different from Hispanic children living in families at less than 100% of the federal poverty level (p < 0.05).
3Significantly different from Hispanic children living in families at 100% or more of the federal poverty level (p < 0.05).
NOTES: Estimates are based on household interviews of a sample of the civilian noninstitutionalized population. Diagnosed attention-deficit/hyperactivity disorder (by a doctor or other health professional) and diagnosed learning disability (by a school representative or a health professional) is based on parent or guardian report. Access data table for Figure 3.
SOURCE: NCHS, National Health Interview Survey, 2016–2018.
Does the prevalence of diagnosed ADHD or a learning disability vary by both race and ethnicity and parental educational attainment?
- Overall, children with parents who have a high school education or less (15.4%) were more likely to be diagnosed with ADHD or a learning disability when compared with children with parents who have more than a high school education (12.8%) (Figure 4).
- Among children with parents who have a high school education or less, non-Hispanic white children (21.0%) were more likely to be diagnosed with ADHD or a learning disability than non-Hispanic black (16.3%) and Hispanic (11.5%) children.
- Among children with parents who have more than a high school education, non-Hispanic black children (16.6%) were more likely to be diagnosed with ADHD or a learning disability than non-Hispanic white (13.1%) and Hispanic (12.2%) children.
- Among non-Hispanic white children, those with parents who have a high school education or less were more likely to be diagnosed with ADHD or a learning disability compared with children with parents who have more than a high school education.
Figure 4. Prevalence of children aged 3–17 years ever diagnosed with attention-deficit/hyperactivity disorder or a learning disability, by parental educational attainment and race and ethnicity:
United States, 2016–2018
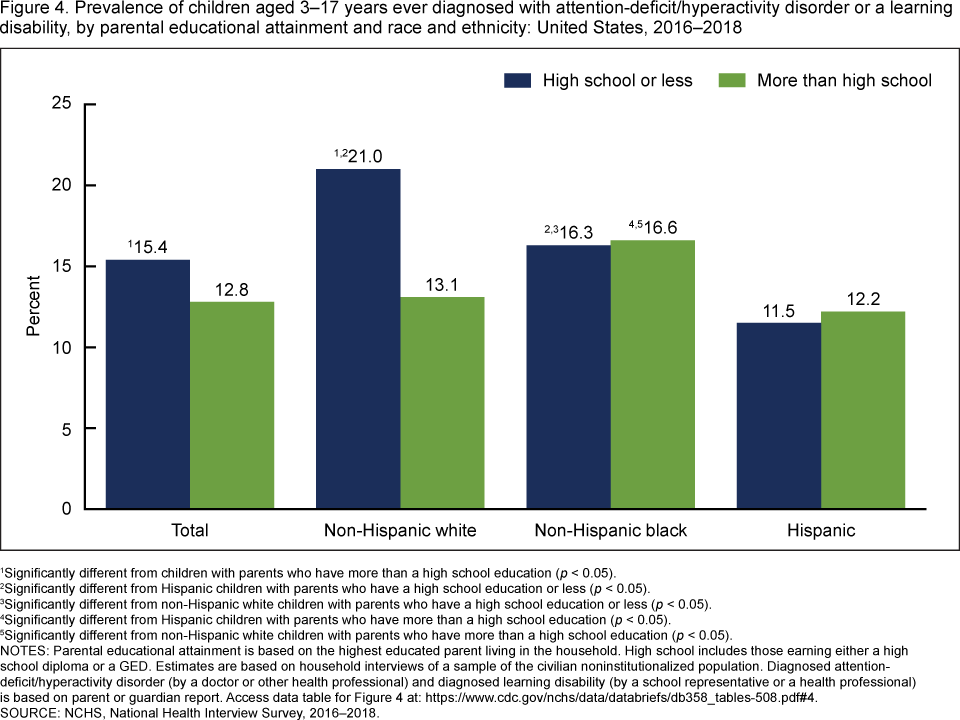
1Significantly different from children with parents who have more than a high school education (p < 0.05).
2Significantly different from Hispanic children with parents who have a high school education or less (p < 0.05).
3Significantly different from non-Hispanic white children with parents who have a high school education or less
(p < 0.05).
4Significantly different from Hispanic children with parents who have more than a high school education
(p < 0.05).
5Significantly different from non-Hispanic white children with parents who have more than a high school education (p < 0.05).
NOTES: Parental educational attainment is based on the highest educated parent living in the household. High school includes those earning either a high school diploma or a GED. Estimates are based on household interviews of a sample of the civilian noninstitutionalized population. Diagnosed attention-deficit/hyperactivity disorder (by a doctor or other health professional) and diagnosed learning disability (by a school representative or a health professional) is based on parent or guardian report. Access data table for Figure 4.
SOURCE: NCHS, National Health Interview Survey, 2016–2018.
Summary
During 2016–2018, approximately 14% of children were reported as ever having been diagnosed with either ADHD or a learning disability. Non-Hispanic black and white children were more likely to be diagnosed with these developmental conditions than Hispanic children, a finding that is consistent with other research (1,5,6). Previous research has attributed the disparity in the diagnosis of developmental conditions to language, service, and cultural barriers (7,8). However, the higher prevalence of either condition among non-Hispanic black children compared with non-Hispanic white children contrasts with previous research (5,6).
Sociodemographic characteristics frequently associated with a diagnosis of either ADHD or a learning disability (1). differed by racial and ethnic groups. Younger non-Hispanic black children were more likely to be diagnosed than younger Hispanic and non-Hispanic white children. The percentage of children diagnosed with ADHD or a learning disability decreased with higher incomes for all racial and ethnic groups. However, this pattern was not seen for parental education for all racial and ethnic groups; only non-Hispanic white children were less likely to be diagnosed with ADHD or a learning disability with higher parental educational attainment.
Definitions
Diagnosed attention-deficit/hyperactivity disorder: Based on a positive response to the survey question, “Has a doctor or health professional ever told you that [sample child] had Attention Deficit Hyperactivity Disorder (ADHD) or Attention Deficit Disorder (ADD)?”
Diagnosed learning disability: Based on a positive response to the survey question, “Has a representative from a school or a health professional ever told you that [sample child] had a learning disability?”
Race and ethnicity: Based on two separate questions that determine Hispanic or Latino origin and race. Children of Hispanic or Latino origin may be of any race. Non-Hispanic white and non-Hispanic black refer to persons with a single race group indicated. Total prevalence was estimated using responses from all eligible children. Results for persons of other races, or persons of more than one race are not presented in this report.
Parental educational attainment: Based on the education level of the parent living in the child’s household with the highest education, regardless of that parent’s age.
Federal poverty level: Categories were based on the ratio of the family’s income in the previous calendar year to the appropriate poverty threshold (given the family’s size and number of children), as defined by the U.S. Census Bureau. Family income was imputed when missing.
Data source and methods
Data from the 2016–2018 National Health Interview Survey (NHIS) were used for this analysis. NHIS is a nationally representative survey of the civilian noninstitutionalized U.S. population. It is conducted continuously throughout the year by the National Center for Health Statistics (NCHS). NHIS is an in-person interview conducted in the respondent’s home. In some cases, follow-up to complete the interview is conducted via telephone. The Sample Child component is completed by a family respondent, usually a parent (approximately 91% of all cases). Data for this analysis come from the Sample Child and Family Core components of NHIS. For more information about NHIS, visit: https://www.cdc.gov/nchs/nhis.htm.
NHIS is designed to yield a nationally representative sample, and these analyses used weights to produce national estimates. The sample design is described in more detail elsewhere (9). Point estimates and the corresponding variances for this analysis were calculated using SUDAAN software (10) to account for the complex sample design of NHIS. All estimates in this report meet NCHS standards of reliability as specified in “National Center for Health Statistics Data Presentation Standards for Proportions” (11). Differences between percentages were evaluated using two-sided significance tests at the 0.05 level via logistic regressions.
About the authors
Benjamin Zablotsky is with the National Center for Health Statistics, Division of Health Interview Statistics. Josephine M. Alford was a guest researcher through the Oak Ridge Institute for Science and Education (ORISE) fellowship program.
References
- Zablotsky B, Black LI, Maenner MJ, Schieve LA, Danielson ML, Bitsko RH, et al. Prevalence and trends of developmental disabilities among children in the United States: 2009–2017. Pediatrics 144(4):e20190811. 2019.
- Mayes SD, Calhoun SL, Crowell EW. Learning disabilities and ADHD: Overlapping spectrum disorders. J Learn Disabil 33(5):417–24. 2000.
- Morgan PL, Farkas G, Hillemeier MM, Mattison R, Maczuga S, Li H, Cook M. Minorities are disproportionately underrepresented in special education: Longitudinal evidence across five disability conditions. Educ Res 44(5):278–92. 2015.
- Morgan PL, Staff J, Hillemeier MM, Farkas G, Maczuga S. Racial and ethnic disparities in ADHD diagnosis from kindergarten to eighth grade. Pediatrics 132(1):85–93. 2013.
- Danielson ML, Bitsko RH, Ghandour RM, Holbrook JR, Kogan MD, Blumberg SJ. Prevalence of parent-reported ADHD diagnosis and associated treatment among U.S. children and adolescents, 2016. J Clin Child Adolesc Psych 47(2):199–212. 2018.
- Pastor PN, Reuben CA, Duran CR, Hawkins LD. Association between diagnosed ADHD and selected characteristics among children aged 4–17 years: United States, 2011–2013. NCHS Data Brief, no 201. Hyattsville, MD: National Center for Health Statistics. 2015.
- Hervey-Jumper H, Douyon K, Falcone T, Franco KN. Identifying, evaluating, diagnosing, and treating ADHD in minority youth. J Atten Disord 11(5):522–8. 2008.
- Shifrer D, Muller C, Callahan R. Disproportionality and learning disabilities: Parsing apart race, socioeconomic status, and language. J Learn Disabil 44(3):246–57. 2011.
- National Center for Health Statistics. Survey description, National Health Interview Survey, 2018. Hyattsville, MD. 2019.
- RTI International. SUDAAN (Release 11.0.0) [computer software]. 2012.
- Parker JD, Talih M, Malec DJ, Beresovsky V, Carroll M, Gonzalez Jr JF, et al. National Center for Health Statistics Data Presentation Standards for Proportions. National Center for Health Statistics. Vital Health Stat 2(175). 2017.
Suggested citation
Zablotsky B, Alford JM. Racial and ethnic differences in the prevalence of attention-deficit/hyperactivity disorder and learning disabilities among U.S. children aged 3–17 years. NCHS Data Brief, no 358. Hyattsville, MD: National Center for Health Statistics. 2020.
Copyright information
All material appearing in this report is in the public domain and may be reproduced or copied without permission; citation as to source, however, is appreciated.
National Center for Health Statistics
Jennifer H. Madans, Ph.D., Acting Director
Amy M. Branum, Ph.D., Acting Associate Director for Science
Division of Health Interview Statistics
Stephen J. Blumberg Ph.D., Director
Anjel Vahratian, Ph.D., M.P.H., Associate Director for Science