Is Twin Childbearing on the Decline? Twin Births in the United States, 2014–2018
- Key findings
- The U.S. twin birth rate declined 4% from 2014 to 2018.
- Twin birth rates declined by 10% or more for mothers in all age groups 30 and over.
- Twinning declined among non-Hispanic white mothers, but was essentially stable for non-Hispanic black and Hispanic mothers.
- Twin birth rates declined in 17 states and rose in three states from 2014 to 2018
- Summary
- Definitions
- Data sources and methods
- About the authors
- References
- Suggested citation
PDF Version (423 KB)
Joyce A. Martin, M.P.H., Michelle J.K. Osterman, M.H.S.
Key findings
Data from the National Vital Statistics System
- Following more than three decades of increases, the twin birth rate declined 4% during 2014–2018, to the lowest rate in more than a decade, 32.6 twins per 1,000 total births in 2018.
- The number of births in twin deliveries declined an average of 2% per year from 2014 through 2018, dropping to 123,536 births in 2018.
- Twin birth rates declined among mothers aged 30 and over, with the largest declines among older mothers aged 40 and over.
- The twinning rate dropped 7% among non-Hispanic white mothers from 2014 to 2018 (34.3 in 2018), but was essentially unchanged among non-Hispanic black (40.5) and Hispanic (24.4) mothers.
- Twin birth rates declined in 17 states and rose in three states.
Following years of relative stability, twin births began to climb in the United States in the early 1980s, rising 79% from 1980 to 2014 (1,2). In 1980, one in every 53 births was a twin, compared with one in every 29 births in 2014 (1,2). The increase in twinning over the more than three decades was widespread, occurring across age and race and Hispanic-origin groups, and in all U.S. states (1,2). It is important to track twin birth rates as twins are at greater risk than singletons for poor outcomes, including preterm birth and neonatal morbidity and mortality (1,3,4). This report presents trends in twin childbearing overall for 1980–2018, and by maternal age, race and Hispanic origin, and state of residence for 2014–2018.
Keywords: maternal age, race and Hispanic origin, state, National Vital Statistics System
The U.S. twin birth rate declined 4% from 2014 to 2018.
- The twin birth rate rose by an average of 2% annually from 1980 (18.9 twins per 1,000 total births) through 2003 (31.5), for a total increase of 67%. The pace of increase then slowed to less than 1% annually from 2003 through 2014 (33.9) (Figure 1).
- The twin birth rate declined by an average of 1% a year from 2014 (33.9) through 2018 (32.6) for a total decrease of 4%.
- The number of twin births more than doubled from 1980 (68,339) to the peak in 2007 (138,961), then fluctuated from 2007 to 2014 (135,336).
- The number of twins declined by an average of 2% a year from 2014 through 2018, to 123,536 twins in 2018, the lowest number reported since 2002.
Figure 1. Number and rate of twin births: United States, 1980–2018
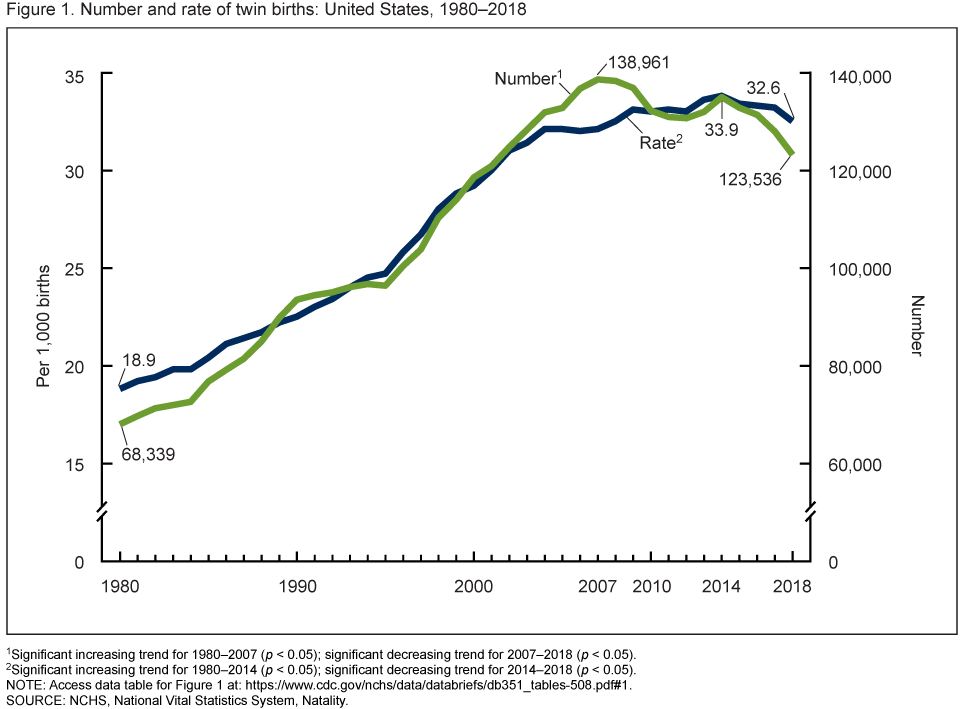
1Significant increasing trend for 1980–2007 (p < 0.05); significant decreasing trend for 2007–2018 (p < 0.05).
2Significant increasing trend for 1980–2014 (p < 0.05); significant decreasing trend for 2014–2018 (p < 0.05).
NOTE: Access data table for Figure 1.
SOURCE: National Vital Statistics System, Natality.
Twin birth rates declined by 10% or more for mothers in all age groups 30 and over.
- Twin birth rates declined for mothers in all age groups 30 and over; the rate fell by 10% for women aged 30–34 (from 40.3 per 1,000 total births to 36.2), 12% for women aged 35–39 (from 48.6 to 42.8) and 23% for women aged 40 and over (from 66.0 to 51.1) (Figure 2).
- Twin birth rates were essentially the same between 2014 and 2018 among women in their twenties (from 23.0 to 23.2 for women aged 20–24, and from 30.5 to 30.4 for women aged 25–29), but increased for mothers under age 20, from 16.0 to 17.1.
- In 2018 as in 2014, twinning rates increased with advancing maternal age. For both years, mothers aged 30–39 were more than twice as likely, and mothers aged 40 and over were three times as likely to have a twin birth, compared with their counterparts under age 20.
Figure 2. Twin birth rates, by age of mother: United States, 2014 and 2018
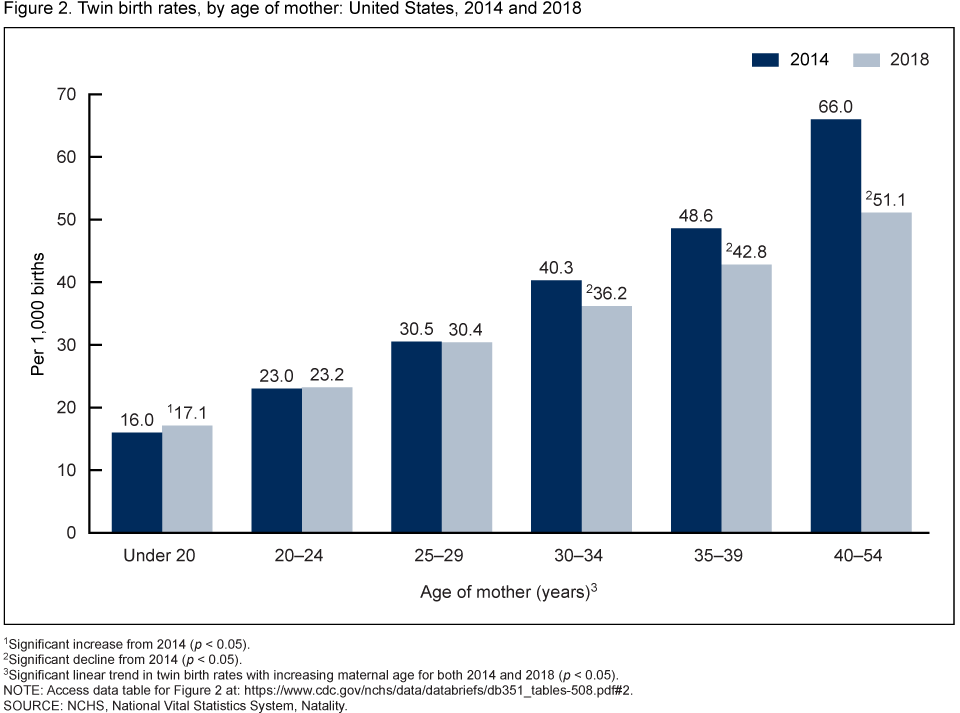
1Significant increase from 2014 (p < 0.05).
2Significant decline from 2014 (p < 0.05).
3Significant linear trend in twin birth rates with increasing maternal age for both 2014 and 2018 (p < 0.005).
NOTE: Access data table for Figure 2.
SOURCE: NCHS, National Vital Statistics System, Natality.
Twinning declined among non-Hispanic white mothers, but was essentially stable for non-Hispanic black and Hispanic mothers.
- The twin birth rate fell 7% among births to non-Hispanic white women, from 36.7 per 1,000 births, to 34.3 from 2014 to 2018 (Figure 3).
- Twinning among non-Hispanic black (40.0 in 2014 to 40.5 in 2018) and Hispanic mothers (24.1 to 24.4) was essentially the same between the two time periods.
- Non-Hispanic black mothers were most likely to have a twin birth in both 2014 and 2018, followed by non-Hispanic white and Hispanic mothers.
Figure 3. Twin birth rates, by race and Hispanic origin of mother: United States, 2014 and 2018
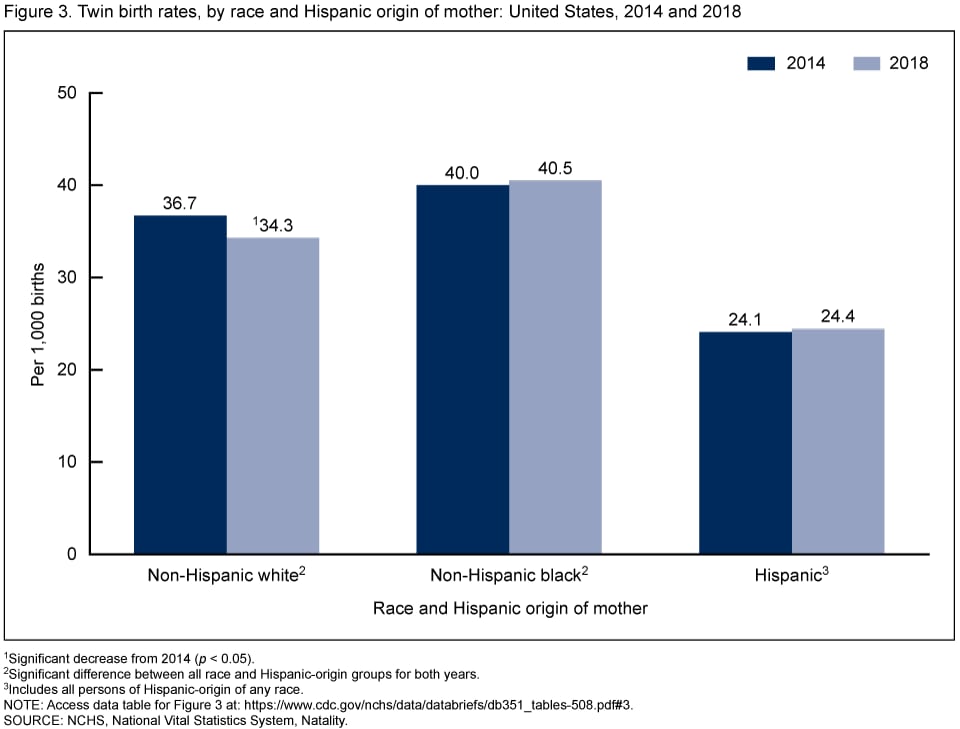
1Significant decrease from 2014 (p < 0.05).
2Significant difference between all race and Hispanic-origin groups for both years.
3Includes all persons of Hispanic-origin of any race.
NOTE: Access data table for Figure 3.
SOURCE: NCHS, National Vital Statistics System, Natality.
Twin birth rates declined in 17 states and rose in three states from 2014 to 2018
- Twin birth rates were lower in 2018 compared with 2014 in 17 states; nonsignificant declines were reported in an additional 10 states and the District of Columbia (Figure 4).
- Increases in twinning were reported for three states: Arizona, Idaho, and Oklahoma; nonsignificant increases were observed in 18 states. No change was reported for Alabama and Hawaii.
- In 2018, state-specific twin rates ranged from a low of 24.9 per 1,000 births in New Mexico, to highs of 35.9 and 36.4 in Michigan and Connecticut. Twin birth rates were above 30.0, or 3% or more of all births, in 45 states and the District of Columbia.
Figure 4. Twin birth rates, by state for 2018 and change in twin birth rates, by state from 2014 to 2018
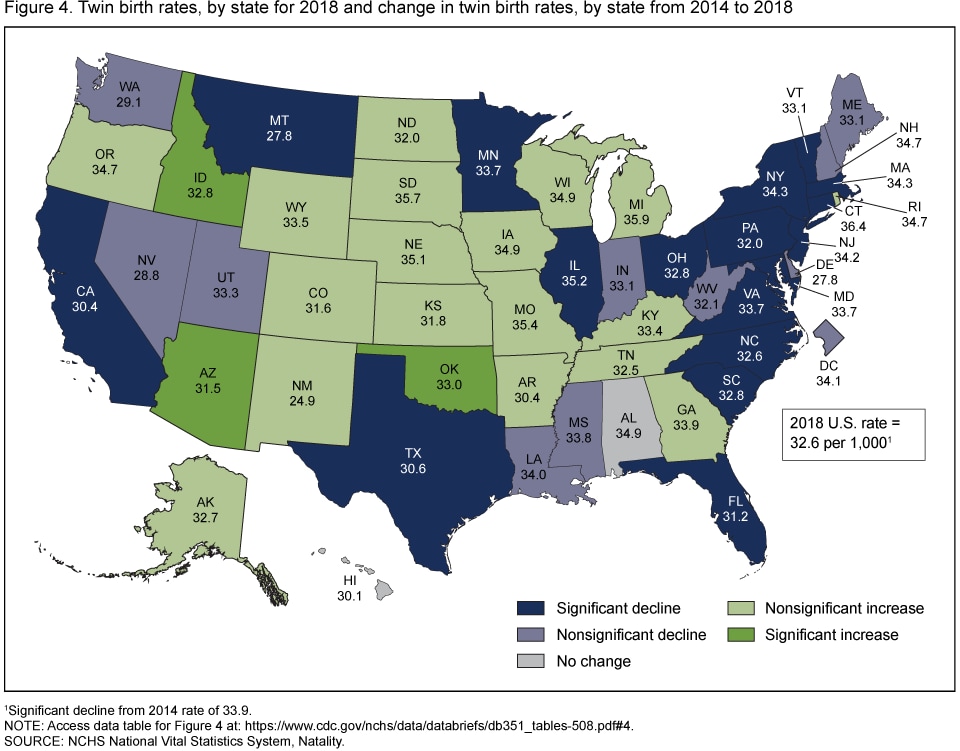
1Significant decline from 2014 rate of 33.9.
NOTE: Access data table for Figure 4.
SOURCE: NCHS National Vital Statistics System, Natality.
Summary
For the first time in more than three decades, from 2014 through 2018, the twin birth rate for the United States trended downward. Declines for this period were not universal across maternal age and race and Hispanic-origin groups or across U.S. states. By maternal age, declines in twinning were limited to women aged 30 and over and were especially pronounced among women aged 40 and over (down 23%). By race and Hispanic origin, twin birth rates dropped 7% for non-Hispanic white mothers from 2014 to 2018, but were essentially stable for non-Hispanic black and Hispanic mothers.
Significant declines were observed in 17 states or about one-third of all U.S. states; nonsignificant declines were observed in another 10 states and the District of Columbia. Although the 2018 twin birth rate of 32.6 per 1,000 births was the lowest rate in more than a decade, it remained higher than those for all years prior to 2008.
Definitions
Twin birth: Individual live birth in a twin pregnancy.
Twin birth rate: The number of twin births per 1,000 total births.
Data source and methods
This report is based on data from the Natality Data Files from the National Vital Statistics System (NVSS). The vital statistics’ natality file is derived from birth certificates and includes information for all births occurring in the United States. The natality files include information on a wide range of maternal and infant demographic and health characteristics for babies born in the United States.
Plurality (i.e., twin, triplet, etc.) is defined as the number of fetuses delivered live or dead at any given time in the pregnancy regardless of gestational age, or if the fetuses were delivered at different times during the pregnancy.
Race and Hispanic origin are reported separately on the birth certificate. Persons of Hispanic origin may be of any race. Persons of non-Hispanic ancestry are further classified by race because there are substantial differences in fertility between Hispanic and non-Hispanic persons. Multiple race data reported from 2014 through 2018 were bridged to single-race categories for trend analysis (5).
References to differences in twin birth rates indicate that the change is statistically significant at the 0.05 level based on a two-tailed z test. Trends in the number and rate of twin births for Figure 1 were evaluated using the Joinpoint Regression Program (6). The setting of four joinpoints was used to assess trends from 1989 through 2018. References to patterns by maternal age for Figure 2 were assessed using the Cochran-Armitage test for trends, a modified chi-squared test.
About the authors
Joyce A. Martin and Michelle J.K. Osterman are with the National Center for Health Statistics, Division of Vital Statistics, Reproductive Statistics Branch.
References
- Hamilton BE, Martin JA, Osterman MJK, Curtin SC, Mathews TJ. Births: Final data for 2014.National Vital Statistics Reports; vol 64 no 12. Hyattsville, MD: National Center for Health Statistics. 2015.
- Martin JA, Hamilton BE, Osterman MJK. Three decades of twin births in the United States, 1989–2009. NCHS Data Brief, no 80. Hyattsville, MD: National Center for Health Statistics. 2012.
- Ely DM, Driscoll AK. Infant mortality in the United States, 2017: Data from the period linked birth and infant death file. National Vital Statistics Reports; vol 68 no 10. Hyattsville, MD: National Center for Health Statistics. 2019.
- Ananth CV, Chauhan SP. The epidemiology of twinning in developed countries. Semin Perintol 36(3):156–61. 2012.
- Martin JA, Hamilton BE, Osterman MJK, Driscoll AK, Drake P. Births: Final data for 2016. National Vital Statistics Reports; vol 67 no 1. Hyattsville, MD: National Center for Health Statistics. 2018.
- National Cancer Institute. Joinpoint Regression Program (Version 4.4.4.0) [computer software]. 2017.
Suggested citation
Martin JA, Osterman MJK. Is twin childbearing on the decline? Twin births in the United States, 2014–2018. NCHS Data Brief, no 351. Hyattsville, MD: National Center for Health Statistics. 2019.
Copyright information
All material appearing in this report is in the public domain and may be reproduced or copied without permission; citation as to source, however, is appreciated.
National Center for Health Statistics
Jennifer H. Madans, Ph.D., Acting Director
Amy M. Branum, Ph.D., Acting Associate Director for Science
Division of Vital Statistics
Steven Schwartz, Ph.D., Director
Hanyu Ni, Ph.D., M.P.H., Associate Director for Science