Strategies Used by Adults With Diagnosed Diabetes to Reduce Their Prescription Drug Costs, 2017–2018
- Key findings
- Among adults with diagnosed diabetes, women were more likely than men to not take their medication as prescribed to reduce their prescription drug costs.
- Among adults with diagnosed diabetes, adults under age 65 were more likely than adults aged 65 and over to not take their medication as prescribed and to ask their doctor for a lower-cost medication to reduce their prescription drug costs.
- Among adults aged 18–64 with diagnosed diabetes, use of selected strategies to reduce prescription drug costs varied by health insurance coverage.
- Among adults aged 65 and over with diagnosed diabetes, asking a doctor for a lower-cost medication varied by health insurance coverage.
- Summary
- Definitions
- Data source and methods
- About the authors
- References
- Suggested citation
PDF Version (481 KB)
Robin A. Cohen, Ph.D., and Amy E. Cha, Ph.D., M.P.H.
Key findings
Data from the National Health Interview Survey
- Among adults with diagnosed diabetes, women (14.9%) were more likely than men (11.6%) to not take their medication as prescribed.
- Adults under age 65 with diagnosed diabetes were more likely than those aged 65 and over to not take their medication as prescribed (17.9% and 7.2%, respectively) and to ask their doctor for a lower-cost medication (26.3% and 21.9%, respectively).
- Among adults aged 18–64 with diagnosed diabetes, the percentage who did not take their medication as prescribed or asked their doctor for a lower-cost medication was highest among those who were uninsured.
- Among adults aged 65 and over with diagnosed diabetes, the percentage who asked their doctor for a lower-cost medication was lowest among those with Medicare and Medicaid coverage.
In 2018, 10.1% of adults aged 18 and over had diagnosed diabetes (1). The majority of those with diabetes take medication for this condition (2). Compared with those without diabetes, adults with diagnosed diabetes experience higher out-of-pocket costs for prescription medications (3) and cost-related, medication nonadherence behaviors (4). Adults have used several strategies to reduce the costs of prescription drugs, including not taking medication as prescribed and asking their doctor for a lower-cost medication (5). This report examines the percentage of adults aged 18 and over with diagnosed diabetes who used these selected strategies to reduce their prescription drug costs.
Keywords: diabetes, medication, nonadherence, National Health Interview Survey
Among adults with diagnosed diabetes, women were more likely than men to not take their medication as prescribed to reduce their prescription drug costs.
- Among adults with diagnosed diabetes who were prescribed medication in the past 12 months, 13.2% did not take their medication as prescribed, and 24.4% asked their doctor for a lower-cost medication (Figure 1).
- Among adults with diagnosed diabetes, women (14.9%) were more likely than men (11.6%) to not take their medication as prescribed to reduce their prescription drug costs.
- Among adults with diagnosed diabetes, women (25.5%) were as likely as men (23.4%) to ask their doctor for a lower-cost medication.
Figure 1. Percentage of adults with diagnosed diabetes who were prescribed medication in the past 12 months and used selected strategies to reduce their prescription drug costs, by sex: United States, 2017–2018
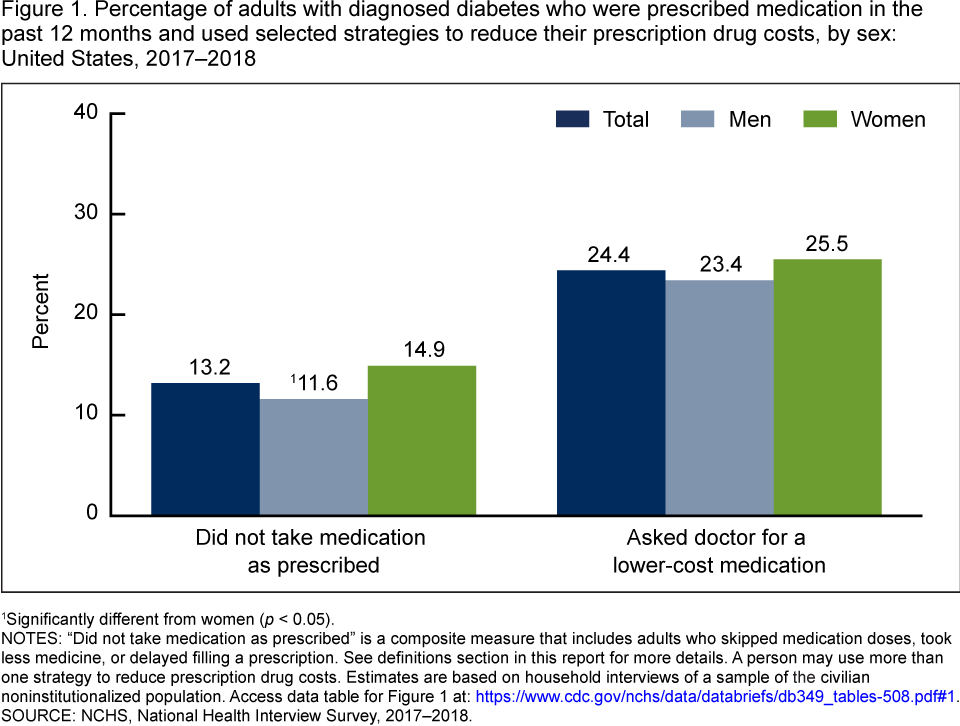
1Significantly different from women (p < 0.05).
NOTES: “Did not take medication as prescribed” is a composite measure that includes adults who skipped medication doses, took less medicine, or delayed filling a prescription. See definitions section in this report for more details. A person may use more than one strategy to reduce prescription drug costs. Estimates are based on household interviews of a sample of the civilian noninstitutionalized population. Access data table for Figure 1.
SOURCES: NCHS, National Health Interview Survey, 2017–2018.
Among adults with diagnosed diabetes, adults under age 65 were more likely than adults aged 65 and over to not take their medication as prescribed and to ask their doctor for a lower-cost medication to reduce their prescription drug costs.
- Among adults with diagnosed diabetes who were prescribed medication in the past 12 months, adults under age 65 (17.9%) were more likely than adults aged 65 and over (7.2%) to not take their medication as prescribed to reduce their prescription drug costs (Figure 2).
- Among adults with diagnosed diabetes, those under age 65 (26.3%) were more likely than those aged 65 and over (21.9%) to ask their doctor for a lower-cost medication.
Figure 2. Percentage of adults with diagnosed diabetes who were prescribed medication in the past 12 months and used selected strategies to reduce their prescription drug costs, by age group: United States, 2017–2018
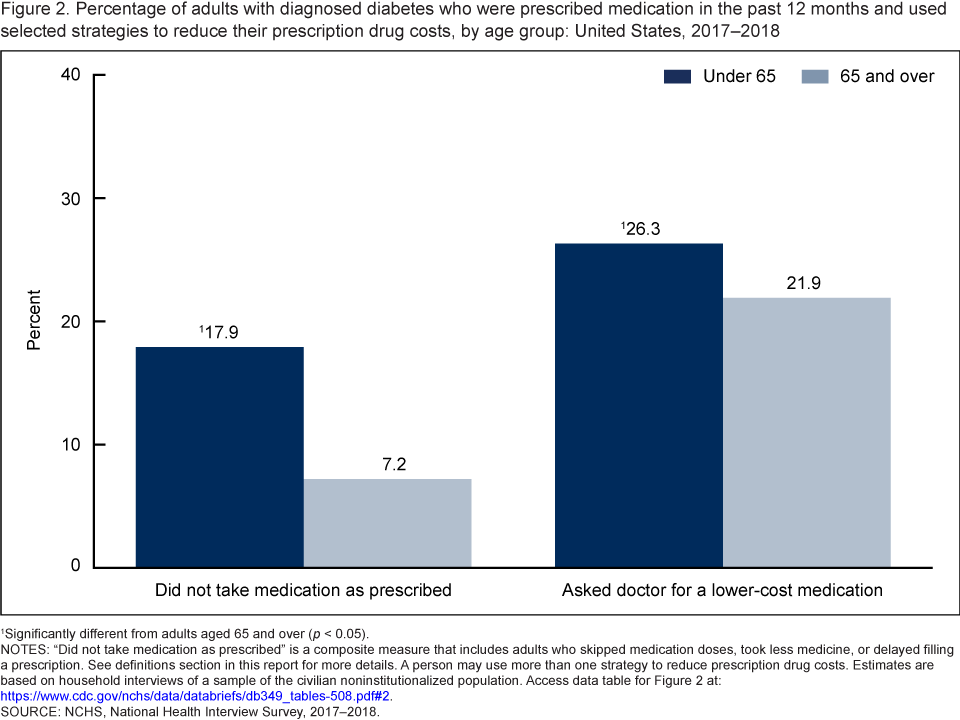
1Significantly different from adults aged 65 and over (p < 0.05).
NOTES: “Did not take medication as prescribed” is a composite measure that includes adults who skipped medication doses, took less medicine, or delayed filling a prescription. See definitions section in this report for more details. A person may use more than one strategy to reduce prescription drug costs. Estimates are based on household interviews of a sample of the civilian noninstitutionalized population. Access data table for Figure 2.
SOURCE: NCHS, National Health Interview Survey, 2017–2018.
Among adults aged 18–64 with diagnosed diabetes, use of selected strategies to reduce prescription drug costs varied by health insurance coverage.
- Among adults aged 18–64 with diagnosed diabetes who were prescribed medication in the past 12 months, the percentage who did not take their medication as prescribed or asked their doctor for a lower-cost medication was highest among those who were uninsured (Figure 3).
- Among adults aged 18–64 with diagnosed diabetes, uninsured adults (35.7%) were more likely than those with private health insurance (14.0%) or Medicaid coverage (17.8%) to not take their medication as prescribed to reduce their prescription drug costs.
- Among adults aged 18–64 with diagnosed diabetes, uninsured adults (42.6%) were more likely than those with private (25.7%) or Medicaid coverage (18.8%) to ask their doctor for a lower-cost medication, while adults with private insurance were more likely than those with Medicaid to use this strategy.
Figure 3. Percentage of adults aged 18–64 with diagnosed diabetes who were prescribed medication in the past 12 months and used selected strategies to reduce their prescription drug costs, by insurance coverage status: United States, 2017–2018
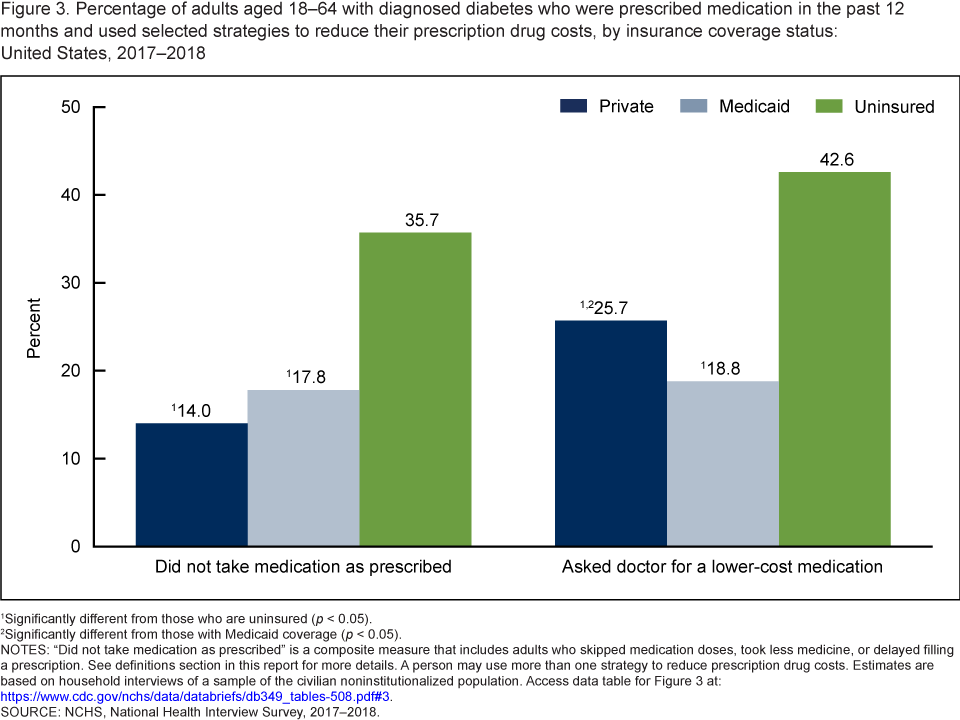
1Significantly different from those who are uninsured (p < 0.05).
2Significantly different from those with Medicaid (p < 0.05).
NOTES: “Did not take medication as prescribed” is a composite measure that includes adults who skipped medication doses, took less medicine, or delayed filling a prescription. See definitions section in this report for more details. A person may use more than one strategy to reduce prescription drug costs. Estimates are based on household interviews of a sample of the civilian noninstitutionalized population. Access data table for Figure 3.
SOURCE: NCHS, National Health Interview Survey, 2017–2018.
Among adults aged 65 and over with diagnosed diabetes, asking a doctor for a lower-cost medication varied by health insurance coverage.
- Among adults aged 65 and over with diagnosed diabetes who were prescribed medication in the past 12 months, the percentage who did not take medication as prescribed to reduce their prescription drug costs did not vary significantly by insurance coverage status (Figure 4).
- Among adults aged 65 and over with diagnosed diabetes, those with private insurance (26.1%), Medicare Advantage (25.8%), and Medicare only (22.7%) were more likley than those with Medicare and Medicaid (13.0%) to ask their doctor for a lower-cost medication.
Figure 4. Percentage of adults aged 65 and over with diagnosed diabetes who were prescribed medication in the past 12 months and used selected strategies to reduce their prescription drug costs, by insurance coverage status: United States, 2017–2018
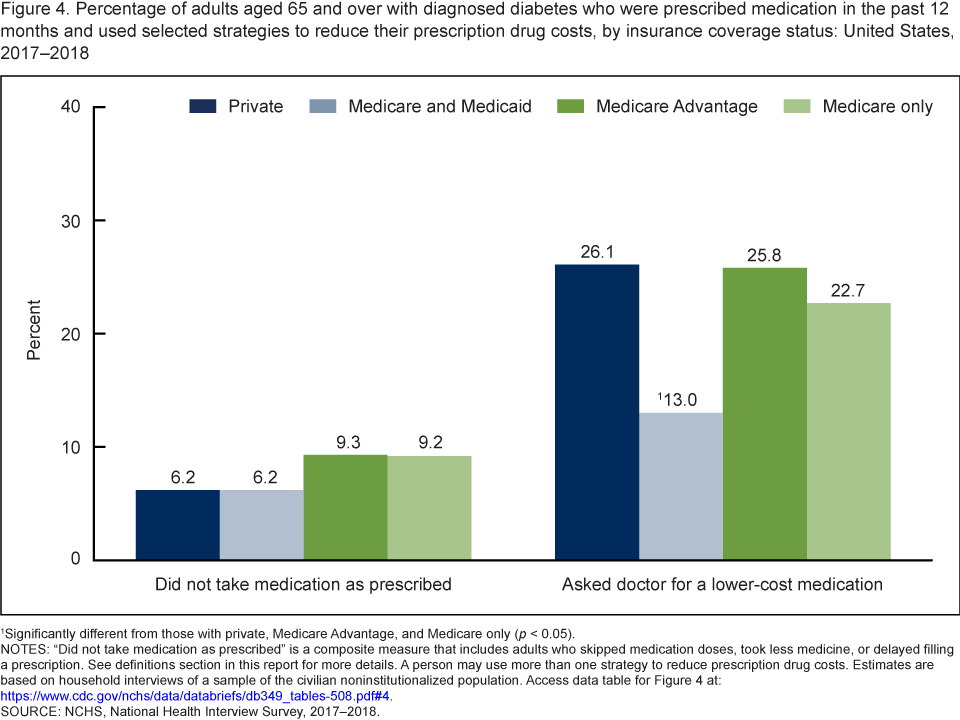
1Significantly different from those with private, Medicare Advantage, and Medicare only (p < 0.05).
NOTES: “Did not take medication as prescribed” is a composite measure that includes adults who skipped medication doses, took less medicine, or delayed filling a prescription. See definitions section in this report for more details. A person may use more than one strategy to reduce prescription drug costs. Estimates are based on household interviews of a sample of the civilian noninstitutionalized population. Access data table for Figure 4.
SOURCE: NCHS, National Health Interview Survey, 2017–2018.
Summary
Among U.S. adults with diagnosed diabetes who were prescribed medication in the past 12 months, the percentages of adults who did not take their medication as prescribed to reduce their prescription drug costs were highest among women and adults under age 65. Among adults aged 18–64, those who were uninsured were more likely than those with private insurance or Medicaid to not take their medication as prescribed and to ask their doctor for a lower-cost medication to reduce their prescription drug costs. Among adults aged 65 and over, the percentage who did not take their medication as prescribed did not vary significantly by health insurance coverage. However, adults aged 65 and over with Medicare and Medicaid coverage were less likely than those with private, Medicare Advantage, or Medicare only coverage to ask their doctor for a lower-cost medication.
In 2018, medications to treat diabetes ranked sixth out of the top 20 therapeutic classes of dispensed prescriptions, accounting for 214 million prescriptions (6). In 2017, the annual per capita expense for outpatient medication for those with diagnosed diabetes was almost $5,000 (7). Recently, there has been a shift towards lower-cost options as the first line of therapy for diabetes management (6). However, the burden associated with high prescription drug costs remains a public health concern for adults with diagnosed diabetes (3).
Definitions
Diagnosed diabetes: Based on a positive response to the survey question, “Have you ever been told by a doctor or other health professional that you have diabetes or sugar diabetes?” Women were asked to exclude diagnoses received only during pregnancy.
Strategies for reducing prescription drug costs: Based on the following questions, “The following questions concern the use of prescription medication: During the past 12 months, are any of the following true for you?…[1] You skipped medication doses to save money …[2] You took less medicine to save money …[3] You delayed filling a prescription to save money …[4] You asked your doctor for a lower-cost medication to save money.” Adults were asked questions 1 through 4 only if they reported having been prescribed medication by a doctor or other health care provider during the past 12 months.
Did not take medication as prescribed: Based on a positive response to any of the following three questions described previously: “…You skipped medication doses to save money …You took less medicine to save money … You delayed filling a prescription to save money.”
Health insurance coverage: At the time of interview, respondents reported their type(s) of coverage. This information was used to form two health insurance hierarchies: one for adults aged 18–64 and another for adults aged 65 and over. For adults aged 18–64, a hierarchy consisting of four mutually exclusive categories was developed (8). Adults with more than one type of health insurance were assigned to the first appropriate category in the following hierarchy: private coverage, Medicaid (includes state-sponsored health plans including the Children’s Health Insurance Program [CHIP]), other coverage (includes Medicare, other government, and military coverage), and uninsured. Adults with other coverage are included in the totals but are not shown separately.
For adults aged 65 and over, a health insurance hierarchy of six mutually exclusive categories was used (9,10). Adults with more than one type of health insurance were assigned to the first appropriate category in the following hierarchy: private coverage, Medicare and Medicaid, Medicare Advantage, Medicare only (no Advantage), other coverage, and uninsured. Due to small sample sizes, those with other coverage and those who are uninsured are included in the totals but are not shown separately.
Data source and methods
Data from the 2017–2018 National Health Interview Survey (NHIS) were used for this analysis. NHIS is a nationally representative household survey of the civilian noninstitutionalized U.S. population. It is conducted continuously throughout the year by the National Center for Health Statistics (NCHS). Interviews are conducted in the respondent’s home, but follow-ups to complete interviews may be conducted by telephone when necessary. For more information about NHIS, visit the survey website.
Point estimates and the corresponding variances were calculated using SAS-callable SUDAAN version 11.0 (RTI International, Research Triangle Park, N.C.) (11) to account for the complex sample design of NHIS. All estimates in this report meet NCHS standards of reliability as specified in “National Center for Health Statistics Data Presentation Standards for Proportions” (12). Differences between percentages were evaluated using two-sided significance tests at the 0.05 level.
About the authors
Robin A. Cohen and Amy E. Cha are with the National Center for Health Statistics, Division of Health Interview Statistics.
References
- Clarke TC, Norris T, Schiller JS. Early release of selected estimates based on data from the National Health Interview Survey, 2018. National Center for Health Statistics. May 2019.
- Villarroel MA, Vahratian A, Ward BW. Health care utilization among U.S. adults with diagnosed diabetes, 2013. NCHS Data Brief, no 183. Hyattsville, MD: National Center for Health Statistics. 2015.
- Rodbard HW, Green AJ, Fox KM, Grandy S. Impact of type 2 diabetes mellitus on prescription medication burden and out-of-pocket healthcare expenses. Diabetes Res Clin Pract 87:360–5. 2010.
- Kang H, Lobo JM, Kim S, Sohn M. Cost-related medication non-adherence among U.S. adults with diabetes. Diabetes Res Clin Pract 143:24–33. 2018.
- Cohen RA, Villarroel MA. Strategies used by adults to reduce their prescription drug costs: United States, 2013. NCHS Data Brief, no 184. Hyattsville, MD: National Center for Health Statistics. 2015.
- IQVIA Institute for Human Data Science. Medicine use and spending in the U.S.: A review of 2018 and outlook to 2023. 2019.
- American Diabetes Association. Economic costs of diabetes in the U.S. in 2017. Diabetes Care 41(5):917–28. 2018
- Bloom B, Simpson G, Cohen RA, Parsons PE. Access to health care part 2: Working-age adults. National Center for Health Statistics. Vital Health Stat 10(197). 1997.
- National Center for Health Statistics. < ahref=”ftp://ftp.cdc.gov/pub/Health_Statistics/NCHS/Dataset_Documentation/NHIS/2015/srvydesc.pdf”>2015 National Health Interview Survey (NHIS) public use data release: Survey description. 2016.
- National Center for Health Statistics. Technical notes for summary health statistics tables: National Health Interview Survey.
- RTI International. SUDAAN (Release 11.0.01) [computer software]. 2013.
- Parker JD, Talih M, Malec DJ, Beresovsky B, Carroll M, Gonzalez Jr. JF, et al. National Center for Health Statistics data presentation standards for proportions. National Center for Health Statistics. Vital Health Stat 2(175). 2017.
Suggested citation
Cohen RA, Cha AE. Strategies used by adults with diagnosed diabetes to reduce their prescription drug costs, 2017–2018. NCHS Data Brief, no 349. Hyattsville, MD: National Center for Health Statistics. 2019.
Copyright information
All material appearing in this report is in the public domain and may be reproduced or copied without permission; citation as to source, however, is appreciated.
National Center for Health Statistics
Jennifer H. Madans, Ph.D., Acting Director
Amy M. Branum, Ph.D., Acting Associate Director for Science
Division of Health Interview Statistics
Stephen J. Blumberg, Ph.D., Director
Anjel Vahratian, Ph.D., M.P.H., Associate Director for Science