Secondhand Smoke Exposure Among Nonsmoking Youth: United States, 2013–2016
- Key findings
- What percentage of U.S. youth were exposed to SHS, and were there differences by age and sex in 2013–2016?
- Were there differences in SHS exposure by age and race and Hispanic origin in 2013–2016?
- Were there differences in the percentage of SHS-exposed youth by level of family income from 2013 through 2016?
- Did youth living in homes with tobacco smokers have a higher percentage of SHS exposure compared with youth not living with smokers?
- Summary
- Definitions
- Data source and methods
- About the authors
- References
- Suggested citation
PDF Version (481 KB) | Visual Abstract
Debra J. Brody, M.P.H., Zhaohui Lu, M.S., and James Tsai, M.D.
Key findings
Data from the National Health and Nutrition Examination Survey
- In 2013–2016, more than one-third (35.4%) of U.S. nonsmoking youth aged 3–17 years were exposed to secondhand smoke (SHS) from tobacco, as measured by cotinine in the blood.
- The percentage of SHS exposure was higher for youth aged 3–11 than for youth aged 12–17, and similar for boys and girls.
- A higher percentage of non-Hispanic black (61.8%) youth was exposed to SHS compared with non-Hispanic white (34.3%), non-Hispanic Asian (18.3%), and Hispanic (24.9%) youth.
- The percentage of SHS-exposed youth increased with decreasing family income.
- The percentage of SHS-exposed youth living with two or more tobacco smokers was more than three times as high as youth not living with a smoker.
Secondhand smoke (SHS) exposure comes from the inhalation of smoke from burning cigarettes, cigars, and pipes (1). SHS can cause sudden infant death syndrome, respiratory and ear infections, and asthma attacks in youth (1,2). Decreases in tobacco smoking, awareness of SHS health risks, and smoke-free policies may have contributed to a reduction in SHS exposure since the late 1980s (3,4). However, in recent years, the percentage of youth with SHS exposure has remained steady (5). This report describes the prevalence of SHS exposure among nonsmoking youth in 2013–2016, as defined by serum cotinine, a metabolite of nicotine.
Keywords: tobacco, nicotine, nonsmokers, NHANES
What percentage of U.S. youth were exposed to SHS, and were there differences by age and sex in 2013–2016?
In 2013–2016, 35.4% of U.S. youth aged 3–17 years were exposed to SHS, and overall, exposure differed by age group (Figure 1).
Among youth aged 3–11 years, the percentage with SHS exposure was higher (38.1%) than among youth aged 12–17 (32.1%).
The percentage of SHS exposure was similar for boys in both age groups (38.0% compared with 34.8%) but was higher among younger girls compared with older girls (38.2% compared with 29.2%).
Figure 1. Percentage of youth with secondhand smoke exposure, by age and sex: United States, 2013–2016
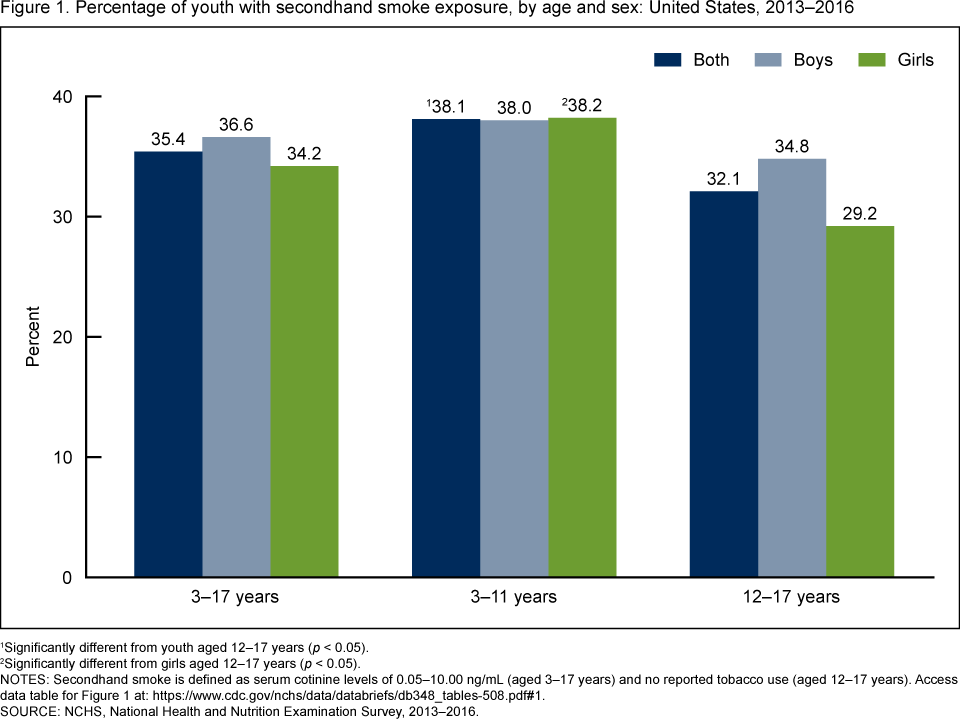
1Significantly different from youth aged 12–17 years (p < 0.05).
2Significantly different from girls aged 12–17 years (p < 0.05).
NOTES: Secondhand smoke is defined as serum cotinine levels of 0.05–10.00 ng/mL (aged 3–17 years) and no reported tobacco use (aged 12–17 years). Access data table for Figure 1.
SOURCES: NCHS, National Health and Nutrition Examination Survey, 2013–2016.
Were there differences in SHS exposure by age and race and Hispanic origin in 2013–2016?
Overall, the percentage of SHS-exposed youth was higher among non-Hispanic black (61.8%) youth compared with non-Hispanic white (34.3%), non-Hispanic Asian (18.3%), and Hispanic (24.9%) youth (Figure 2). SHS exposure also was higher among non-Hispanic white youth compared with non-Hispanic Asian and Hispanic youth.
The percentage of youth with SHS exposure was higher for youth aged 3–11 years compared with those aged 12–17 years among both non-Hispanic white (38.1% compared with 30.1%) and non-Hispanic black (66.2% compared with 51.6%) youth.
Figure 2. Percentage of youth with secondhand smoke exposure, by age and race and Hispanic origin: United States, 2013–2016
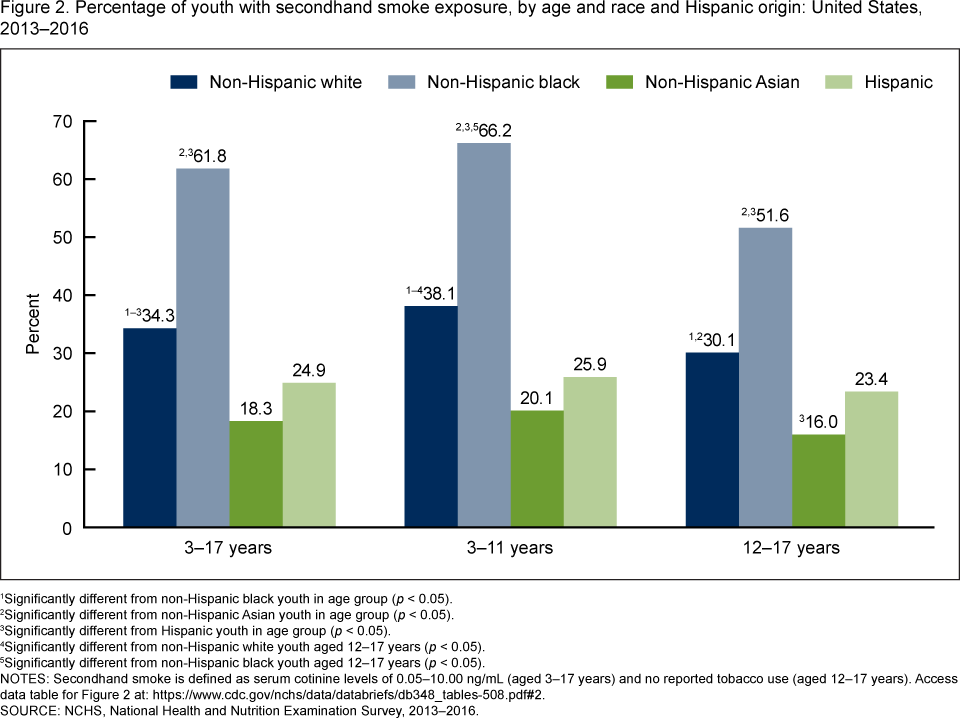
1Significantly different from non-Hispanic black youth in age group (p < 0.05).
2Significantly different from non-Hispanic Asian youth in age group (p < 0.05).
3Significantly different from Hispanic youth in age group (p < 0.05).
4Significantly different from non-Hispanic white youth aged 12–17 years (p < 0.05).
5Significantly different from non-Hispanic black youth aged 12–17 years (p < 0.05).
NOTES: Secondhand smoke is defined as serum cotinine levels of 0.05–10.00 ng/mL (aged 3–17 years) and no reported tobacco use (aged 12–17 years). Access data table for Figure 2.
SOURCE: NCHS, National Health and Nutrition Examination Survey, 2013–2016.
Were there differences in the percentage of SHS-exposed youth by level of family income from 2013 through 2016?
The percentage of SHS-exposed youth decreased with increasing family income (Figure 3). Overall, more than one-half of youth from families living below the federal poverty level (FPL) were exposed to SHS (54.8%) compared with 16.0% of youth from families with income levels at or above 400% the FPL. The same pattern of SHS exposure was observed among youth aged 3–11 and 12–17 years.
Figure 3. Percentage of youth with secondhand smoke exposure, by age and family income level: United States, 2013–2016
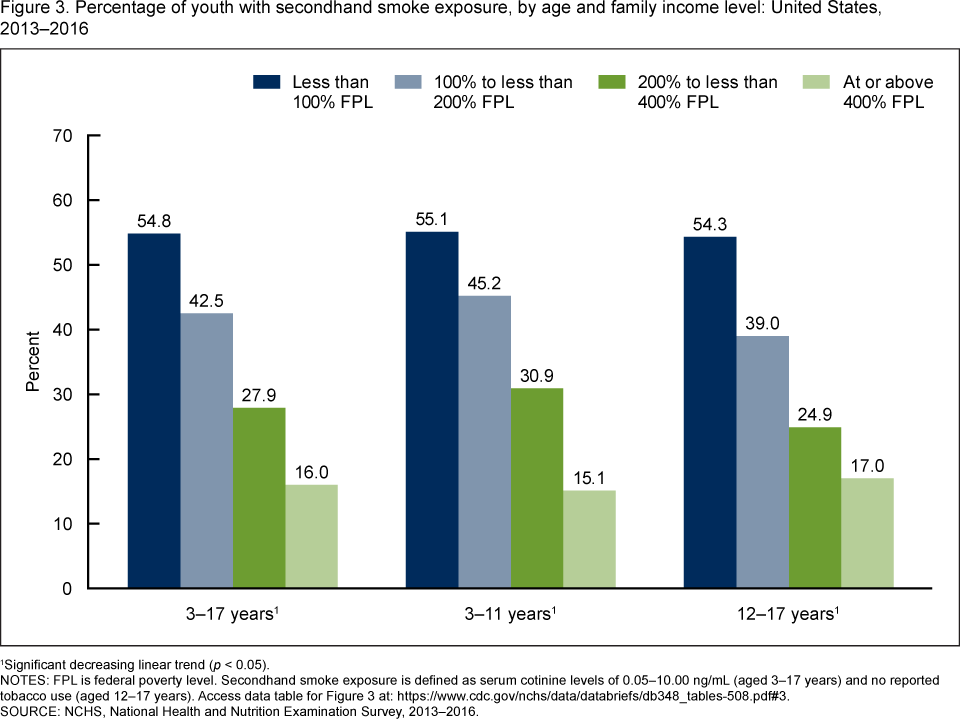
1Significant decreasing linear trend (p < 0.05).
NOTES: FPL is federal poverty level. Secondhand smoke exposure is defined as serum cotinine levels of 0.05–10.00 ng/mL (aged 3–17 years) and no reported tobacco use (aged 12–17 years). Access data table for Figure 3.
SOURCE: NCHS, National Health and Nutrition Examination Survey, 2013–2016.
Did youth living in homes with tobacco smokers have a higher percentage of SHS exposure compared with youth not living with smokers?
The percentage of youth with SHS exposure increased with the number of smokers living in their homes (Figure 4). Almost one-quarter of youth living in a home without a smoker (23.9%) were SHS-exposed compared with 67.2 % of youth living with one smoker, and 80.9% of youth living with two smokers or more. This pattern of SHS exposure was similar for youth aged 3–11 years and 12–17 years.
Figure 4. Percentage of youth with secondhand smoke exposure, by age and number of tobacco smokers living in their home: United States, 2013–2016
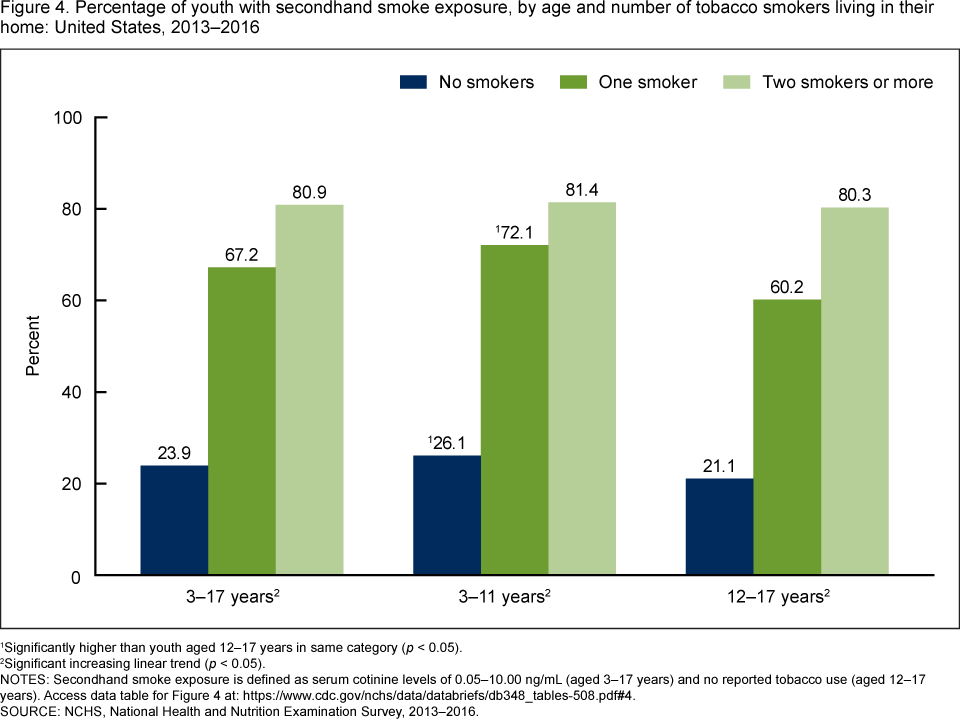
1Significantly higher than youth aged 12–17 years in same category (p < 0.05).
2Significant increasing linear trend (p < 0.05).
NOTES: Secondhand smoke exposure is defined as serum cotinine levels of 0.05–10.00 ng/mL (aged 3–17 years) and no reported tobacco use (aged 12–17 years). Access data table for Figure 4.
SOURCE: NCHS, National Health and Nutrition Examination Survey, 2013–2016.
Summary
In 2013–2016, more than one-third (35.4%) of nonsmoking youth aged 3–17 years were exposed to secondhand tobacco smoke. The percentage of SHS exposure was similar for boys and girls, and was higher for youth aged 3–11 years compared with youth aged 12–17 years. SHS exposure was highest among non-Hispanic black youth and lowest among non-Hispanic Asian and Hispanic youth. The percentage of SHS-exposed youth decreased with increasing family income levels, and increased with the number of tobacco smokers living in their homes. SHS exposure was about three times as high among youth living in a home with two smokers or more compared with those not living with a smoker.
SHS exposure may occur in many places, including at home or at a friend’s or relative’s home, or in vehicles, restaurants, parks, or playgrounds (6). This report showed that SHS exposure was detected in almost one-quarter of youth who did not live in a home with a smoker. Programs and practices that restrict smoking in public and private spaces and declines in tobacco use help to limit youth exposure to SHS (3,4).
Definitions
Secondhand smoke (SHS) exposure: Serum cotinine values were determined from blood samples collected by venipuncture during the examination. Laboratory analyses were performed using an isotope-dilution liquid chromatography-tandem mass spectrometry method (7). Serum cotinine values from 0.05 through 10 ng/mL were considered exposed to SHS. Youth with values above 10 ng/mL, a level associated with active tobacco usage, were excluded.
Youth aged 12–17 who, during the mobile examination center (MEC) interview, reported smoking cigarettes in the previous 30 days or who answered affirmatively to questions about tobacco use in the past 5 days (including pipes, cigars, little cigars or cigarillos, water pipes, hookahs, e-cigarettes, chewing tobacco, snuff, snus, dissolvables, or nicotine replacement therapy products) also were excluded from this analysis.
Number of smokers living in home: During the family interview in the home, a family reference person answered the question, “How many people who live here smoke cigarettes, cigars, little cigars, pipes, water pipes, hookah, or any other tobacco product?” Because of limited sample sizes, responses of more than two smokers were recoded with the category “two or more smokers.”
Federal poverty level (FPL): Levels are based on the income to poverty ratio, a measure of the annual total family income divided by the U.S. Department of Health and Human Services poverty guidelines, after accounting for inflation and family size (8).
Data source and methods
The National Health and Nutrition Examination Survey (NHANES), a cross-sectional survey conducted by the National Center for Health Statistics (NCHS), is designed to monitor the health and nutritional status of the civilian noninstitutionalized U.S. population. The survey consists of household interviews followed by standardized physical examinations in MECs (8).
The NHANES sample is selected through a complex, multistage probability design. In 2013–2016, non-Hispanic black, non-Hispanic Asian, and Hispanic persons were oversampled (8). Non-Hispanic race categories reflect participants reporting only one race; non-Hispanic persons reporting more than one race are included in the total but are not reported separately.
Examination sample weights were used to account for the differential probabilities of selection, nonresponse, and noncoverage. NHANES data from two combined cycles (2013–2016) were used to test differences between subgroups. Taylor series linearization (9) was used to compute variance estimates. Pairwise differences between groups were tested using a univariate t statistic. Tests for linear trends were evaluated using orthogonal polynomials. The significance level for statistical testing was set at p < 0.05. All differences reported are statistically significant unless otherwise indicated. All reported estimates met NCHS presentation standards (10). Data management and statistical analyses were conducted using SAS System for Windows version 9.4 (SAS Institute, Inc., Cary, N.C.), and SUDAAN version 11.0 (RTI International, Research Triangle Park, N.C.).
About the authors
Debra J. Brody is with the National Center for Health Statistics, Division of Health and Nutrition Examination Surveys. Zhaohui Lu is with Peraton Corp. James Tsai is with the National Center for Chronic Disease Prevention and Health Promotion, Office on Smoking and Health.
References
- U.S. Department of Health and Human Services. The health consequences of smoking: 50 years of progress. A report of the Surgeon General. Atlanta, GA. 2014.
- U.S. Department of Health and Human Services. The health consequences of involuntary exposure to tobacco smoke: A report of the Surgeon General. Atlanta, GA. 2006.
- Zhang X, Martinez-Donate A, Rhoads N. Parental practices and attitudes related to smoke-free rules in homes, cars, and outdoor playgrounds in US households with underage children and smokers, 2010–2011. Prev Chronic Dis 12:E96. 2015.
- Kruger J, Jama A, Homa DM, Babb SD, King BA. Smoke-free home and vehicle rules by tobacco use status among US adults. Prev Med 78:9–13. 2015.
- Tsai J, Homa DM, Gentzke AS, Mahoney M, Sharapova SR, Sosnoff CS, et al. Exposure to secondhand smoke among nonsmokers—United States, 1988–2014. MMWR Morb Mortal Wkly Rep 67(48):1342–6. 2018.
- Agaku IT, Singh T, Rolle I, Olalekan AY, King BA. Prevalence and determinants of secondhand smoke exposure among middle and high school students. Pediatrics 137(2):e20151985. 2016.
- National Center for Environmental Health Statistics, Division of Laboratory Sciences. Laboratory procedure manual: Cotinine and hydroxycotinine. 2018.
- Johnson CL, Paulose-Ram R, Ogden CL, Carroll MD, Kruszon-Moran D, Dohrmann SM, Curtin LR. National Health and Nutrition Examination Survey: Analytic guidelines, 1999–2010. National Center for Health Statistics. Vital Health Stat 2(161). 2013.
- Wolter KM. Chapter 6: Taylor series methods. In: Introduction to variance estimation. 2nd ed. New York, NY: Springer. 2007.
- Parker JD, Talih M, Malec DJ, Beresovsky V, Carroll M, Gonzales Jr JF, et al. National Center for Health Statistics Data Presentation Standards for Proportions. National Center for Health Statistics. Vital Health Stat 2(175). 2017.
Suggested citation
Brody DJ, Lu Z, Tsai J. Secondhand smoke exposure among nonsmoking youth: United States, 2013–2016. NCHS Data Brief, no 348. Hyattsville, MD: National Center for Health Statistics. 2019.
Copyright information
All material appearing in this report is in the public domain and may be reproduced or copied without permission; citation as to source, however, is appreciated.
National Center for Health Statistics
Jennifer H. Madans, Ph.D., Acting Director
Amy M. Branum, Ph.D., Acting Associate Director for Science
Division of Health and Nutrition Examination Surveys
Kathryn S. Porter, M.D., M.S., Director
Ryne Paulose-Ram, M.A., Ph.D., Associate Director for Science