Prescription Drug Use Among Adults Aged 40–79 in the United States and Canada
- Key findings
- What percentage of adults aged 40–79 in the United States and Canada used one or more and five or more prescription drugs in the past 30 days?
- Did use of prescription drugs in the past 30 days differ by sex among adults in the United States and Canada?
- Did use of prescription drugs in the past 30 days differ by age among adults in the United States and Canada?
- What were the most commonly used types of prescription drugs among adults in the United States and Canada by age?
- Summary
- Definitions
- Data sources and methods
- About the authors
- References
- Suggested citation
PDF Version (481 KB)
Craig M. Hales, M.D., M.P.H., Jennifer Servais, B.Sc., Crescent B. Martin, M.P.H., M.A., and Dafna Kohen, Ph.D., M.Sc.
Key findings
Data from the National Health and Nutrition Examination Survey and the Canadian Health Measures Survey
- Nearly 7 in 10 adults aged 40–79 used at least 1 prescription drug in the past 30 days in the United States (69.0%) and Canada (65.5%), and around 1 in 5 used at least 5 prescription drugs (22.4% in the United States and 18.8% in Canada).
- Among adults aged 40–59, the most commonly used drug types in the United States were antidepressants, lipid-lowering drugs, and ACE inhibitors; in Canada, they were analgesics, antidepressants, and lipid-lowering drugs.
- Among adults aged 60–79, the most commonly used drug types in the United States were lipid-lowering drugs, antidiabetic agents, and beta blockers; in Canada, they were lipid-lowering drugs, analgesics, and proton pump inhibitors.
Patterns of prescription drug use may reflect underlying patterns of health conditions and health care access in the population. Polypharmacy, often defined as the simultaneous use of five or more prescription drugs, is more common in an aging population where multiple coexisting chronic conditions often occur; however, safety concerns may arise (1). The United States and Canada share many cultural and historical ties, but with different models for health care delivery (2). This report describes the use of one or more and five or more prescription drugs among adults aged 40–79 in the United States and Canada.
Keywords: medication, polypharmacy , National Health and Nutrition Examination Survey (NHANES), Canadian Health Measures Survey (CHMS)
What percentage of adults aged 40–79 in the United States and Canada used one or more and five or more prescription drugs in the past 30 days?
- Among U.S. adults aged 40–79, 69.0% used one or more prescription drugs in the past 30 days and 22.4% used five or more (Figure 1).
- Among Canadian adults aged 40–79, 65.5% used one or more prescription drugs in the past 30 days and 18.8% used five or more. Use of one or more and five or more prescription drugs was similar between the United States and Canada.
Figure 1. Use of one or more and five or more prescription drugs in the past 30 days among adults aged 40–79: United States, 2015–2016, and Canada, 2016–2017
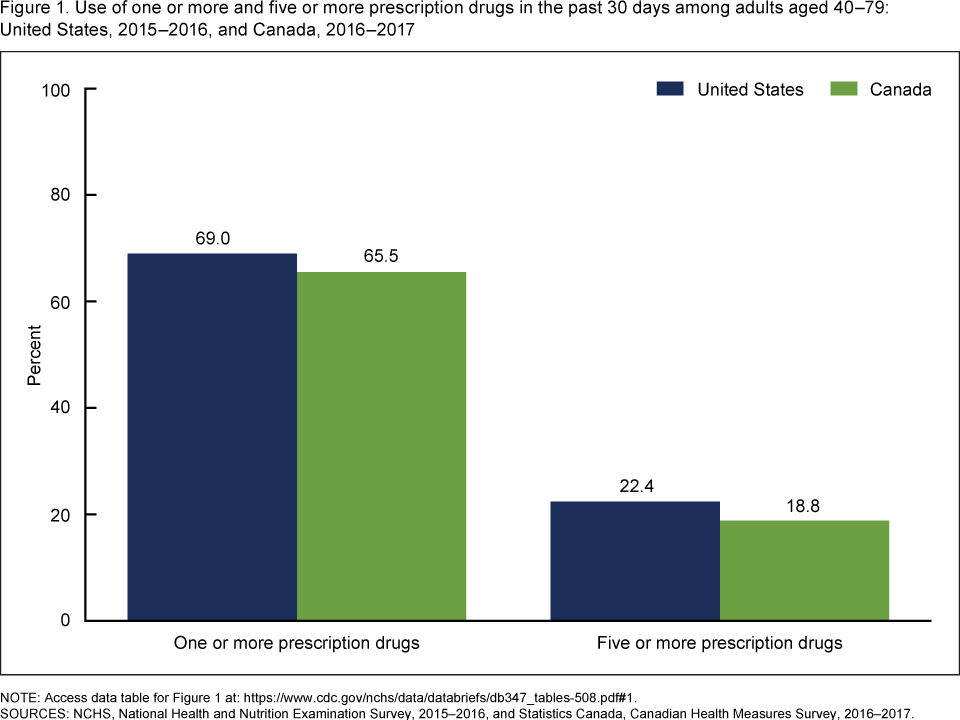
NOTE: Access data table for Figure 1.
SOURCES: NCHS, National Health and Nutrition Examination Survey, 2015–2016, and Statistics Canada, Canadian Health Measures Survey, 2016–2017.
Did use of prescription drugs in the past 30 days differ by sex among adults in the United States and Canada?
- Use of one or more prescription drugs in the past 30 days was greater among women compared with men in both the United States (72.4% compared with 65.2%) and Canada (69.3% compared with 61.7%). Use of five or more prescription drugs was similar between women and men in both the United States (23.5% and 21.1%, respectively) and Canada (19.5% and 18.1%, respectively) (Figure 2). Use of one or more and five or more prescription drugs was similar between the United States and Canada among both men and women.
Figure 2. Use of one or more and five or more prescription drugs in the past 30 days among adults aged 40–79, by sex: United States, 2015–2016, and Canada, 2016–2017
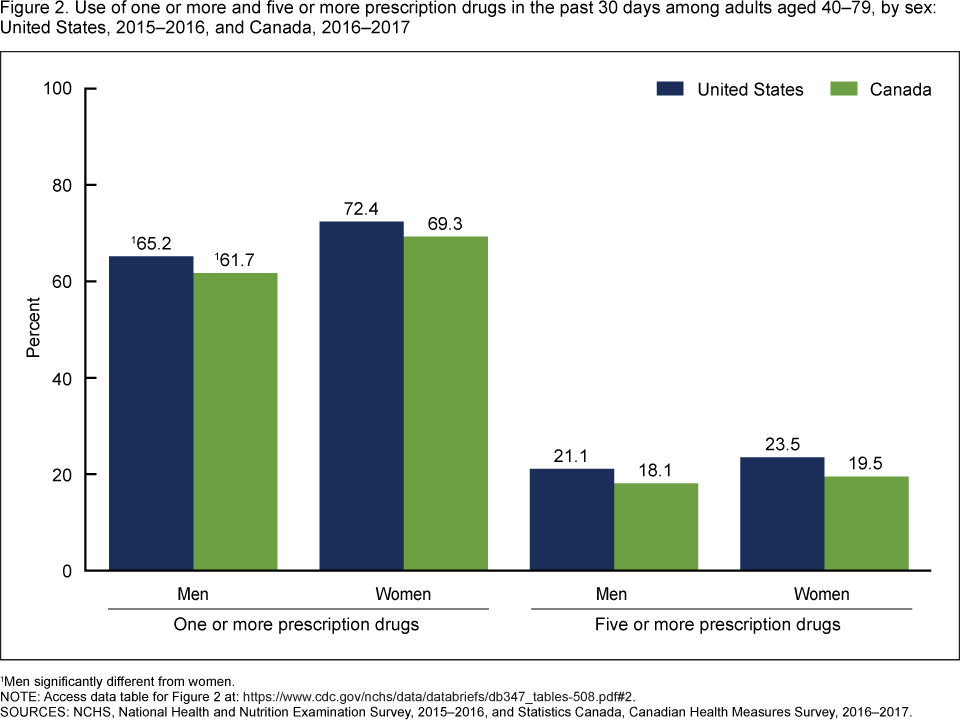
1Men significantly different from women.
NOTES: Access data table for Figure 2.
SOURCES: NCHS, National Health and Nutrition Examination Survey, 2015–2016, and Statistics Canada, Canadian Health Measures Survey, 2016–2017.
Did use of prescription drugs in the past 30 days differ by age among adults in the United States and Canada?
- Use of one or more prescription drugs was more common among adults aged 60–79 compared with those aged 40–59 in both the United States (83.6% compared with 59.5%) and Canada (83.3% compared with 53.3%) (Figure 3). Use of five or more prescription drugs was also more common among adults aged 60–79 compared with those aged 40–59 in both the United States (34.5% versus 14.5%) and Canada (30.9% versus 10.4%). Use of one or more and five or more prescription drugs was similar between the United States and Canada among adults aged 40–59 and 60–79.
Figure 3. Use of one or more and five or more prescription drugs in the past 30 days among adults aged 40–79, by age group: United States, 2015–2016, and Canada, 2016–2017
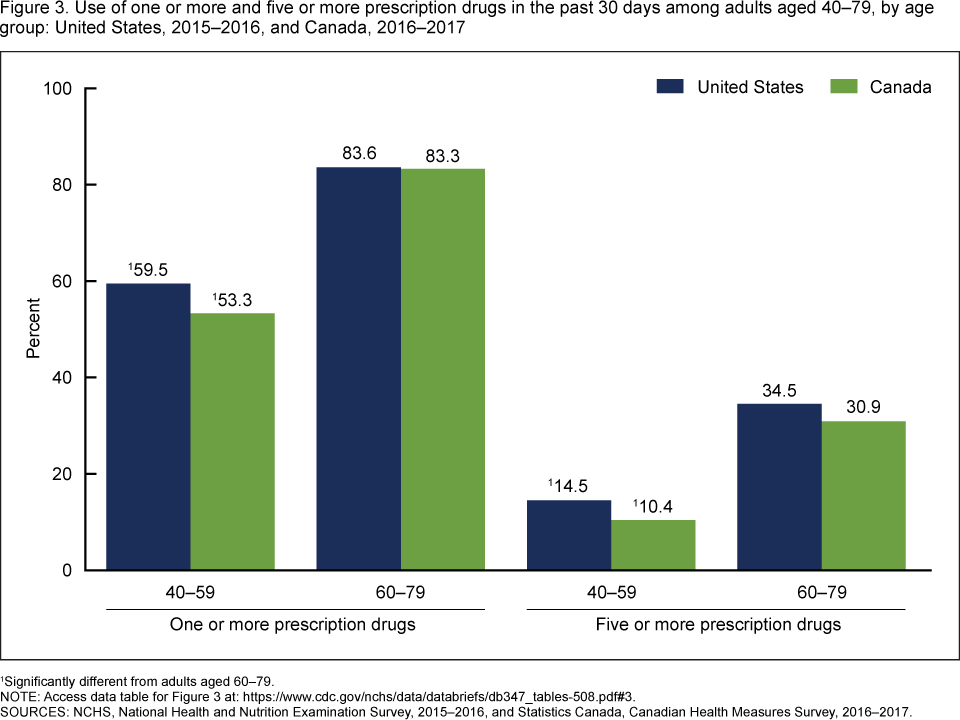
1Significantly different from adults aged 60–79.
NOTES: Access data table for Figure 3.
SOURCES: NCHS, National Health and Nutrition Examination Survey, 2015–2016, and Statistics Canada, Canadian Health Measures Survey, 2016–2017.
What were the most commonly used types of prescription drugs among adults in the United States and Canada by age?
- The top five most common types of prescription drugs used by U.S. and Canadian adults aged 40–79 varied by age and country (Figure 4). Among U.S. adults aged 40–59, the most commonly used types of prescription drugs in the past 30 days were antidepressants (15.4%), lipid-lowering drugs (for high cholesterol, 13.9%), angiotensin converting enzyme (ACE) inhibitors (for high blood pressure, 11.4%), analgesics (for pain relief, 11.1%), and antidiabetic agents (8.8%). The most commonly used types of prescription drugs used by Canadian adults aged 40–59 were analgesics (10.4%), antidepressants (8.8%), lipid-lowering drugs (8.1%), proton pump inhibitors (for reducing stomach acid, 7.2%), and antidiabetic agents (6.6%).
- Among U.S. adults aged 60–79, the most commonly used types of prescription drugs were lipid-lowering drugs (45.0%), antidiabetic agents (23.6%), beta blockers (for high blood pressure or heart disease, 22.3%), ACE inhibitors (21.3%), and proton pump inhibitors (16.9%). The most commonly used types of prescription drugs among Canadian adults aged 60–79 were lipid-lowering drugs (34.3%), analgesics (19.0%), proton pump inhibitors (18.3%), ACE inhibitors (16.4%), and antidiabetic agents (14.8%).
Figure 4. Use in the past 30 days of the most common prescription drug types among adults aged 40–79, by age group: United States, 2015–2016, and Canada, 2016–2017
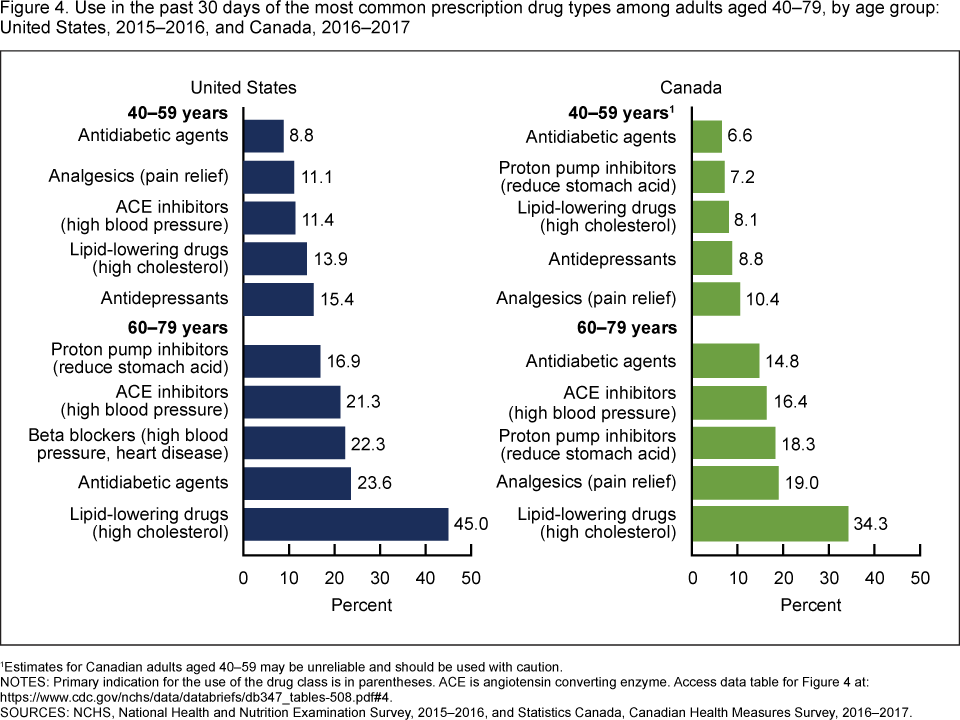
1Estimates for Canadian adults aged 40–59 may be unreliable and should be used with caution.
NOTES: Primary indication for the use of the drug class is in parentheses. ACE is angiotensin converting enzyme. Access data table for Figure 4.
SOURCES: NCHS, National Health and Nutrition Examination Survey, 2015–2016, and Statistics Canada, Canadian Health Measures Survey, 2016–2017.
Summary
Use of prescription drugs was similar in the United States and Canada. Nearly 7 in 10 adults aged 40–79 used at least 1 prescription drug in the past 30 days, and around 1 in 5 used at least 5 prescription drugs. In both the United States and Canada, use of one or more prescription drugs was higher among women compared with men, but use of five or more prescription drugs was similar among women and men. In both the United States and Canada, use of one or more and five or more prescription drugs was more common among adults aged 60–79 compared with adults aged 40–59.
The top five most common types of prescription drugs used by U.S. and Canadian adults varied by age and country. Among adults aged 40–59, antidepressants were the most commonly used drug type among U.S. adults, while analgesics were the most commonly used drug type by Canadian adults. Among both U.S. and Canadian adults aged 60–79, lipid-lowering drugs were the most common type of drug used. The second most common drug type among U.S. adults aged 60–79 was antidiabetic agents, whereas antidiabetic agents were the fifth-most common drug type used by Canadian adults aged 60–79. Analgesics (for pain relief) was the second most common drug type among Canadian adults aged 60–79, whereas analgesics did not rank in the top five most commonly used drug types among U.S. adults aged 60–79.
Monitoring the use of prescription drugs provides insights into the health and health care of U.S. and Canadian adults. The age distribution of the U.S. and Canadian populations is similar, with adults aged 40–79 making up 44% of the population in the United States and 48% in Canada in 2016 (3,4). The use of one or more and five or more medications among adults aged 40–79 is similar between the United States and Canada, despite substantial differences in their health care systems. However, patterns of the most commonly used drug types are different in the two countries.
Definitions
Prescription drug use: National Health and Nutrition Examination Survey (NHANES) participants were asked if they had taken a prescription drug in the past 30 days. In the Canadian Health Measures Survey (CHMS), participants were asked if they had taken or used any medications that have been prescribed or administered by a health professional in the past month. In both surveys, those who answered “yes” were asked to show the interviewer the medication containers of all prescription drugs. For each drug reported, the interviewer recorded the product’s complete name from the container, if available.
Drug type: In NHANES, prescription drugs were classified based on the second level of therapeutic classification scheme in the Multum Lexicon Plus drug database (5). In CHMS, prescription drugs were coded using the Anatomical Therapeutic Chemical (ATC) classification system developed by the World Health Organization (6). For this analysis, ATC codes were also categorized based on the second level of therapeutic classification scheme in the Multum Lexicon Plus drug database for comparability with NHANES.
A drug’s therapeutic class does not always align one-to-one with its primary indication. For example, drugs that are used to treat high blood pressure span multiple therapeutic classes (i.e., ACE inhibitors, beta blockers, diuretics, and calcium channel blockers) and drugs in a single therapeutic class may be used to treat multiple health conditions (e.g., beta blockers also can be used to treat certain heart diseases). Different approaches to drug classification schemes may result in differences in the most commonly used drugs for a given group.
Data sources and methods
Data for this report are from NHANES and CHMS. NHANES and CHMS are cross-sectional surveys designed to provide nationally representative estimates of the noninstitutionalized populations of the United States and Canada, respectively. NHANES is conducted by the National Center for Health Statistics and CHMS is conducted by Statistics Canada. The surveys consist of home interviews followed by standardized physical examinations in mobile examination centers.
The samples for both surveys are selected through a complex, multistage probability design, and sample weights—which account for the differential probabilities of selection, nonresponse, and noncoverage—are incorporated into the estimation process. Standard errors for CHMS were estimated using the bootstrap method; estimates with a high coefficient of variation between 16.6 and 33.3 may be unreliable and were flagged as “use with caution.” For NHANES, standard errors were estimated by Taylor series linearization. Both the bootstrap and Taylor series linearization methods account for the design features of the survey. Differences in the prevalence of prescription drug use between men and women, adults aged 40–59 and 60–79, and between Canada and the United States were tested using a univariate t statistic with an α level of 0.05. All differences reported are statistically significant unless otherwise indicated. Data management and statistical analyses were conducted using SAS System for Windows versions 9.3 and 9.4 (SAS Institute, Inc., Cary, N.C.), SUDAAN version 11.0 (RTI International, Research Triangle Park, N.C.), and R version 3.5.2 (R Foundation for Statistical Computing, Vienna, Austria), including the R survey package (7) to account for the complex sample design.
About the authors
Craig Hales and Crescent Martin are with the National Center for Health Statistics, Division of Health and Nutrition Examination Surveys. Jennifer Servais and Dafna Kohen are with Statistics Canada, Centre for Population Health Data and Health Analysis Division.
References
- Wastesson JW, Morin L, Tan ECK, Johnell K. An update on the clinical consequences of polypharmacy in older adults: A narrative review. Expert Opin Drug Saf 17(12):1185–96. 2018.
- Sanmartin C, Berthelot JM, Ng E, Murphy K, Blackwell DL, Gentleman JF, et al. Comparing health and health care use in Canada and the United States. Health Aff (Millwood) 25(4):1133–42. 2006.
- U.S. Census Bureau. American Fact Finder.
- Statistics Canada. Census Program
- National Center for Health Statistics. NHANES 1988–2016 data documentation, codebook, and frequencies: Prescription medications – drug information (RXQ_DRUG).
- WHO Collaborating Centre for Drug Statistics Methodology. International language for drug utilization research. 2019.
- Lumley T. Survey: Analysis of complex survey samples. R package version 3.35. 2018.
Suggested citation
Hales CM, Servais J, Martin CB, Kohen D. Prescription drug use among adults aged 40–79 in the United States and Canada. NCHS Data Brief, no 347. Hyattsville, MD: National Center for Health Statistics. 2019.
Copyright information
All material appearing in this report is in the public domain and may be reproduced or copied without permission; citation as to source, however, is appreciated.
National Center for Health Statistics
Jennifer H. Madans, Ph.D., Acting Director
Amy M. Branum, Ph.D., Acting Associate Director for Science
Division of Health and Nutrition Examination Surveys
Kathryn S. Porter, M.D., M.S., Director
Ryne Paulose-Ram, M.A., Ph.D., Associate Director for Science