Births in the United States, 2018
- Key findings
- The general fertility rate declined for all three race and Hispanic-origin groups in 2018.
- Teen birth rates declined for all three race and Hispanic-origin groups in 2018.
- The rate of vaginal births after previous cesarean delivery rose in 2018.
- The distribution of births by gestational age shifted to earlier deliveries from 2017 to 2018.
- Summary
- Definitions
- Data source and methods
- About the authors
- References
- Suggested citation
PDF Version (481 KB)
Joyce A. Martin, M.P.H., Brady E. Hamilton, Ph.D., and Michelle J.K. Osterman, M.H.S.
Key findings
Data from the National Vital Statistics System
- The U.S. general fertility rate (births per 1,000 women aged 15–44) declined 2% between 2017 and 2018; fertility rates declined for non-Hispanic white, non-Hispanic black, and Hispanic women.
- The teen birth rate declined 7% from 2017 to 2018 to 17.4 births per 1,000 females aged 15–19. Rates fell for each race and Hispanic-origin group.
- The percentage of vaginal births after previous cesarean (VBAC) rose to 13.3% in 2018 with increases in VBAC deliveries for the three race and Hispanic-origin groups.
- Percentages of births delivered preterm and early term increased from 2017 to 2018, whereas full-term and late- and post-term deliveries declined. These patterns were consistent across race and Hispanic-origin groups.
This report presents selected highlights from 2018 final birth data on key demographic, health care utilization, and infant health indicators. General fertility rates (the number of births per 1,000 women aged 15–44) and teen birth rates are presented. Also shown are the distribution of births with a previous cesarean delivery (vaginal births after previous cesarean [VBAC] and repeat cesarean delivery) and the distribution of births by gestational age. All indicators are compared between 2017 and 2018 and are presented for the three largest race and Hispanic-origin groups: non-Hispanic white, non-Hispanic black, and Hispanic.
Keywords: fertility rates, teen childbearing, previous cesarean delivery, gestational age, National Vital Statistics System
The general fertility rate declined for all three race and Hispanic-origin groups in 2018.
- The general fertility rate for the United States declined 2% in 2018 to 59.1 per 1,000 women aged 15–44 from 60.3 in 2017 (Figure 1).
- Fertility rates declined for the three largest race and Hispanic-origin groups from 2017 to 2018, down 2% for non-Hispanic white and non-Hispanic black women and 3% for Hispanic women.
- In 2018, the fertility rate was highest for Hispanic women (65.9), followed by non-Hispanic black (62.0) and non-Hispanic white (56.3) women.
Figure 1. General fertility rates, by race and Hispanic origin of mother: United States, 2017 and 2018
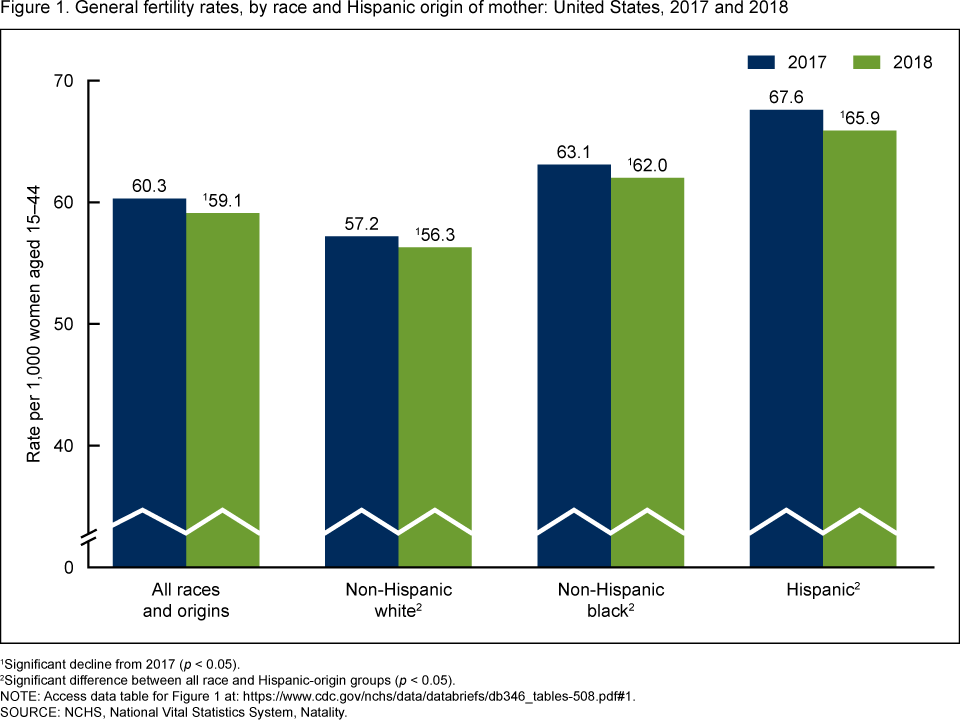
1Significant decline from 2017 (p < 0.05).
2Significant difference between all race and Hispanic-origin groups (p < 0.05).
NOTE: Access data table for Figure 1.
SOURCE: NCHS, National Vital Statistics System, Natality.
Teen birth rates declined for all three race and Hispanic-origin groups in 2018.
- The birth rate for females aged 15–19 declined 7% from 18.8 births per 1,000 females in 2017 to 17.4 in 2018 (Figure 2).
- Among race and Hispanic-origin groups, teen birth rates declined by 4% for non-Hispanic black teenagers and 8% for non-Hispanic white and Hispanic teenagers from 2017 to 2018.
- In 2018, rates for the three groups were lowest for non-Hispanic white teenagers (12.1), followed by non-Hispanic black teenagers (26.3) and Hispanic teenagers (26.7).
Figure 2. Birth rates for females aged 15–19, by race and Hispanic origin of mother: United States, 2017 and 2018
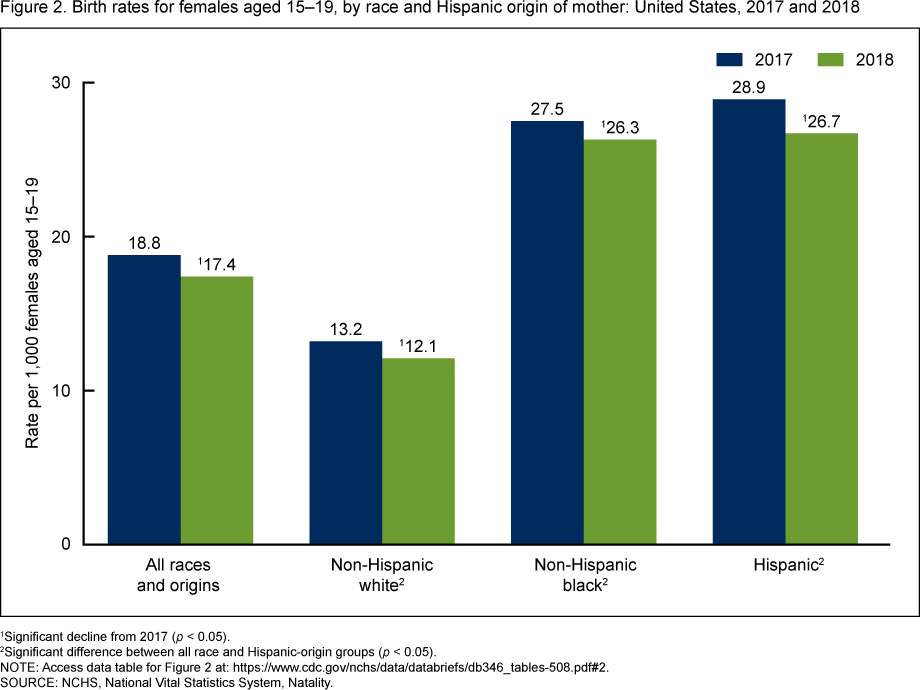
1Significant decline from 2017 (p < 0.05).
2Significant difference between all race and Hispanic-origin groups (p < 0.05).
NOTE: Access data table for Figure 2.
SOURCE: NCHS, National Vital Statistics System, Natality.
The rate of vaginal births after previous cesarean delivery rose in 2018.
- The percentage of VBAC deliveries increased in 2018 to 13.3% of women with a previous cesarean delivery from 12.8% in 2017, whereas the repeat cesarean rate declined to 86.7% of women with a previous cesarean in 2018 from 87.2% in 2017 (Figure 3).
- The percentage of VBAC deliveries increased in 2018 for both non-Hispanic white (13.0% in 2017 to 13.5% in 2018) and Hispanic (12.0% to 12.7%) women. Consequently, the percentages of repeat cesarean deliveries for both groups declined.
- For non-Hispanic black women, the increase in the VBAC percentage (12.8% in 2017 to 13.0% in 2018) was not significant.
- Among the three largest race and Hispanic-origin groups, non-Hispanic white women had the highest VBAC percentage in 2018 (13.5%), followed by non-Hispanic black (13.0%) and Hispanic (12.7%) women.
Figure 3. Percent distribution of births by method of delivery for births with a previous cesarean delivery, by race and Hispanic origin of mother: United States, 2017 and 2018
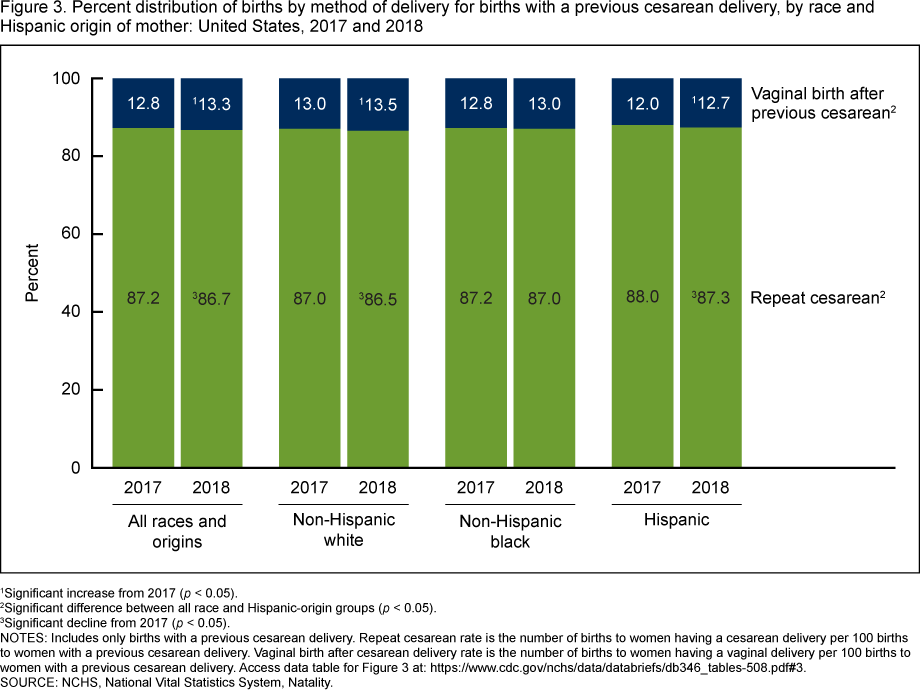
1Significant increase from 2017 (p < 0.05).
2Significant difference between all race and Hispanic-origin groups (p < 0.05).
3Significant decline from 2017 (p < 0.05).
NOTES: Includes only births with a previous cesarean delivery. Repeat cesarean rate is the number of births to women having a cesarean delivery per 100 births to women with a previous cesarean delivery. Vaginal birth after cesarean delivery rate is the number of births to women having a vaginal delivery per 100 births to women with a previous cesarean delivery. Access data table for Figure 3.
SOURCE: NCHS, National Vital Statistics System, Natality.
The distribution of births by gestational age shifted to earlier deliveries from 2017 to 2018.
- The percentage of all births delivered at less than full term (less than 39 weeks) increased from 2017 to 2018 with rises seen among both preterm (9.93% to 10.02%) and early-term (26.00% to 26.53%) births (Figure 4).
- Concurrently, the percentages of births delivered at full term and late and post term declined. Full-term births were down from 57.49% in 2017 to 57.24% in 2018; late- and post-term births declined from 6.58 % to 6.20%.
- Both preterm and early-term birth rates rose for each of the race and Hispanic-origin groups from 2017 to 2018, although the increase in preterm births to non-Hispanic white mothers was not significant.
- Infants delivered to non-Hispanic black mothers were more likely to be born preterm (14.13% compared with 9.09% for non-Hispanic white and 9.73% for Hispanic mothers in 2018) and early term (29.64% compared with 24.68% and 28.05%, respectively).
Figure 4. Percent distribution of births, by gestational age and race and Hispanic origin of mother: United States, 2017 and 2018
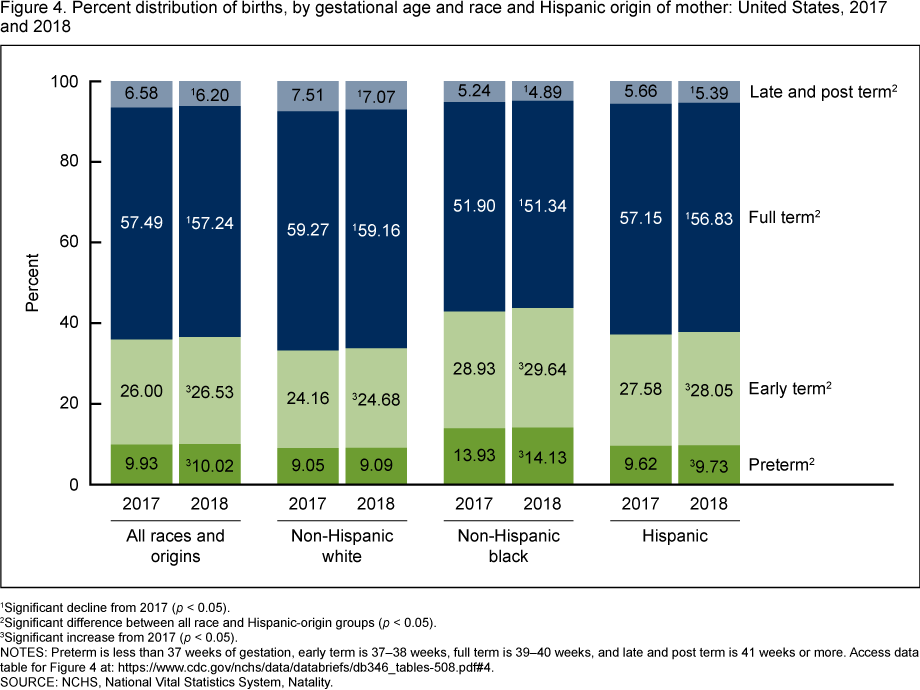
1Significant decline from 2017 (p < 0.05).
2Significant difference between all race and Hispanic-origin groups (p < 0.05).
3Significant increase from 2017 (p < 0.05).
NOTES: Preterm is less than 37 weeks of gestation, early term is 37–38 weeks, full term is 39–40 weeks, and late and post term is 41 weeks or more. Access data table for Figure 4.
SOURCE: NCHS, National Vital Statistics System, Natality.
Summary
Birth certificate data for 2018 show continued declines in childbearing in the United States overall and among the three largest race and Hispanic-origin groups. The 2018 general fertility rate fell to another all-time low for the United States and for each race and Hispanic-origin group shown in this report (1,2). Teen childbearing also declined to record lows overall and for the three race and Hispanic-origin groups (1–3). VBACs increased in 2018; VBACs have been on the rise since 2016, when national data for previous cesarean deliveries became available again in the national birth certificate data (2). Preterm and early-term deliveries continued to rise in 2018 and have been trending upward since 2014 (2).
These 2018 data mark the third year for which national data for most items that were new to, or changed with, the 2003 revision of the U.S. Standard Certificate of Live Birth, including VBAC and repeat cesarean, have been available.
Definitions
General fertility rate: Number of births per 1,000 women aged 15–44.
Teen birth rate: Number of births per 1,000 females aged 15–19.
Vaginal birth after cesarean delivery rate (VBAC): Number of births to women having a vaginal delivery per 100 births to women with a previous cesarean delivery.
Repeat cesarean rate: Number of births to women having a cesarean delivery per 100 births to women with a previous cesarean delivery.
Preterm birth rate: Births delivered prior to 37 completed weeks of gestation per 100 births. Gestational age is based on the obstetric estimate of gestation.
Early-term birth rate: Births delivered at 37–38 completed weeks of gestation per 100 births.
Full-term birth rate: Births delivered at 39–40 completed weeks of gestation per 100 births.
Late- and post-term birth rate: Births delivered at 41 or more completed weeks of gestation per 100 births.
Data source and methods
This report uses data from the Natality Data File from the National Vital Statistics System. The vital statistics natality file is based on information derived from birth certificates and includes information for all births occurring in the United States. This data brief accompanies the release of the 2018 natality public-use file (4). More detailed analysis of the topics presented in this report and many others such as births to unmarried women, prenatal care, tobacco use during pregnancy, pregnancy risk factors, receipt of WIC food, maternal morbidity, and breastfeeding is possible by using the annual natality files (4).
The race and Hispanic-origin groups shown in this report follow the 1997 Office of Management and Budget standards and differ from the bridged-race categories shown in reports prior to 2016 (1).
References to increases or declines in rates or percentages indicate that differences are statistically significant at the 0.05 level based on a two-tailed z test. Computations exclude records for which information is unknown.
About the authors
Joyce A. Martin, Brady E. Hamilton, and Michelle J.K. Osterman are with the National Center for Health Statistics, Division of Vital Statistics, Reproductive Statistics Branch.
References
- Martin JA, Hamilton BE, Osterman MJK, Driscoll AK, Mathews TJ. Births: Final data for 2015. National Vital Statistics Reports; vol 66 no 1. Hyattsville, MD: National Center for Health Statistics. 2017.
- Martin JA, Hamilton BE, Osterman MJK, Driscoll AK, Drake P. Births: Final data for 2017. National Vital Statistics Reports; vol 67 no 8. Hyattsville, MD: National Center for Health Statistics. 2018.
- Ventura SJ, Hamilton BE, Mathews TJ. National and state patterns of teen births in the United States, 1940–2013. National Vital Statistics Reports; vol 63 no 4. Hyattsville, MD: National Center for Health Statistics. 2014.
- National Center for Health Statistics. Vital statistics online data portal for natality public use file.
Suggested citation
Martin JA, Hamilton BE, Osterman MJK. Births in the United States, 2018. NCHS Data Brief, no 346. Hyattsville, MD: National Center for Health Statistics. 2019.
Copyright information
All material appearing in this report is in the public domain and may be reproduced or copied without permission; citation as to source, however, is appreciated.
National Center for Health Statistics
Jennifer H. Madans, Ph.D., Acting Director
Amy M. Branum, Ph.D., Acting Associate Director for Science
Division of Vital Statistics
Steven Schwartz, Ph.D., Director
Hanyu Ni, Ph.D., M.P.H., Associate Director for Science