Mortality Trends by Race and Ethnicity Among Adults Aged 25 and over: United States, 2000–2017
- Key findings
- From 2000 through 2017, age-adjusted death rates for non-Hispanic white and non-Hispanic black adults declined and then leveled off, whereas rates for Hispanic adults continued to decline.
- For adults aged 25–44, death rates for all race and ethnicity groups declined from 2000 through 2012 and then increased through 2017.
- For adults aged 45–64, death rates among non-Hispanic white and non-Hispanic black adults increased more recently, whereas the rate for Hispanic adults was stable from 2011 through 2017.
- For adults aged 65 and over, death rates generally declined from 2000 through 2017 for all race and ethnicity groups.
- Summary
- Data sources and methods
- About the authors
- References
- Suggested citation
PDF Version (481 KB)
Sally C. Curtin, M.A., and Elizabeth Arias, Ph.D.
Key findings
Data from the National Vital Statistics System
- The age-adjusted death rate for Hispanic adults aged 25 and over declined 21% from 2000 (995.1 per 100,000 standard population) through 2017 (784.4).
- Age-adjusted death rates for non-Hispanic white and non-Hispanic black adults aged 25 and over declined from 2000 to 2011–2012, but remained stable through 2017.
- Between 2000 and 2017, the difference in age-adjusted death rates between non-Hispanic white and Hispanic adults aged 25 and over widened, whereas the difference between non-Hispanic white and non-Hispanic black adults narrowed.
- Death rates for non-Hispanic white, non-Hispanic black, and Hispanic adults aged 25–44 increased between 2012 and 2017.
Hispanic adults in the United States have experienced lower overall mortality and consequently higher life expectancy than non-Hispanic white and non-Hispanic black adults (1,2). This report presents recent trends in age-adjusted death rates from 2000 through 2017 for adults aged 25 and over for Hispanic, non-Hispanic white, and non-Hispanic black adults, overall and by specific age groups (25–44, 45–64, and 65 and over).
Keywords: National Vital Statistics System (NVSS), death certificates, Hispanic origin
From 2000 through 2017, age-adjusted death rates for non-Hispanic white and non-Hispanic black adults declined and then leveled off, whereas rates for Hispanic adults continued to decline.
- The age-adjusted death rate for Hispanic adults aged 25 and over declined 21% from 2000 (995.1 per 100,000 standard population) through 2017 (784.4), with a greater rate of decline from 2000 through 2011 (2.0% annually on average) than from 2011 through 2017 (0.7% annually) (Figure 1).
- Age-adjusted death rates for non-Hispanic white and non-Hispanic black adults aged 25 and over declined from 2000 to 2011–2012 (from 1,288.1 in 2000 to 1,135.9 in 2011 and from 1,690.3 in 2000 to 1,319.6 in 2012, respectively), but remained stable through 2017.
- Between 2000 and 2017, age-adjusted death rates for Hispanic adults aged 25 and over ranged from 39% through 42% lower compared with non-Hispanic black adults, whereas the difference between rates for Hispanic and non-Hispanic white adults widened, from 23% lower for Hispanic adults in 2000 to 31% lower in 2017.
- The difference in age-adjusted death rates between non-Hispanic white and non-Hispanic black adults narrowed, from 24% lower for non-Hispanic white adults in 2000 (1,288.1 compared with 1,690.3) to 13% lower in 2017 (1,137.4 compared with 1,306.7).
Figure 1. Age-adjusted death rates for persons aged 25 and over, by Hispanic origin and race: United States, 2000–2017
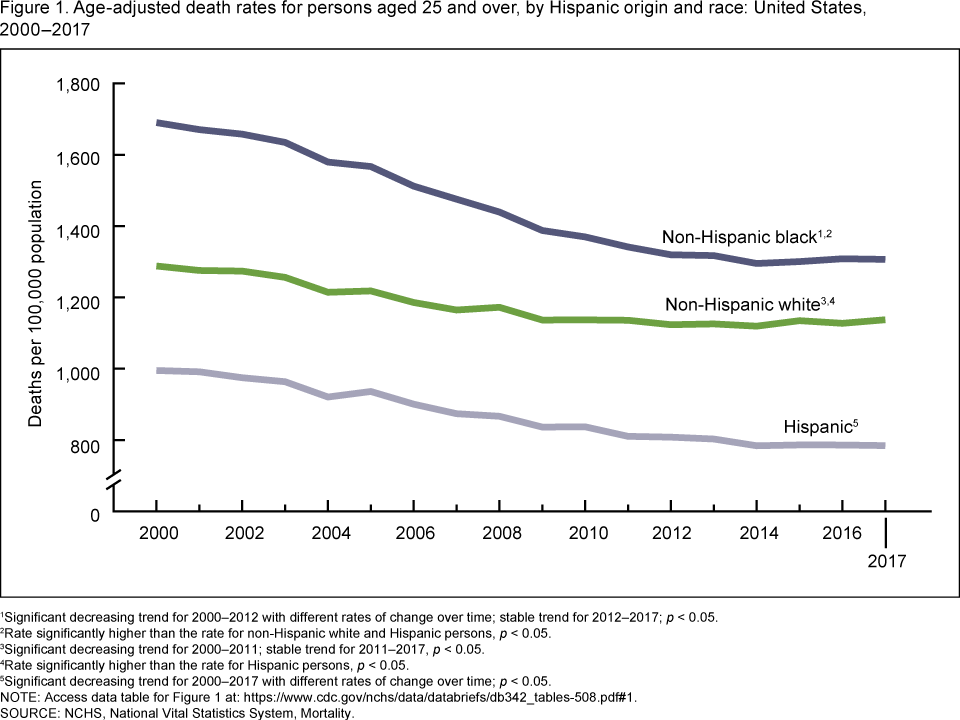
1Significant decreasing trend for 2000–2012 with different rates of change over time; stable trend for 2012–2017; p < 0.05.
2Rate significantly higher than the rate for non-Hispanic white and Hispanic persons, p < 0.05.
3Significant decreasing trend for 2000–2011; stable trend for 2011–2017, p < 0.05.
4Rate significantly higher than the rate for Hispanic persons, p < 0.05.
5Significant decreasing trend for 2000–2017 with different rates of change over time; p < 0.05.
NOTE: Access data table for Figure 1.
SOURCE: NCHS, National Vital Statistics System, Mortality.
For adults aged 25–44, death rates for all race and ethnicity groups declined from 2000 through 2012 and then increased through 2017.
- Death rates for Hispanic, non-Hispanic white, and non-Hispanic black adults aged 25–44 all generally declined from 2000 through 2012 and then increased through 2017 (Figure 2).
- Between 2012 and 2017, death rates increased 21% among non-Hispanic white adults aged 25–44 (from 144.5 to 175.1), 21% for non-Hispanic black adults (from 206.8 to 234.7) and 13% for Hispanic adults (from 89.2 to 108.1).
- Death rates for Hispanic adults aged 25–44 ranged between 54%–60% lower compared with non-Hispanic black adults, whereas the difference in death rates between Hispanic and non-Hispanic white adults aged 25–44 more than doubled, increasing from 17% to 38% lower for Hispanic adults between 2000 and 2017.
- Death rates for non-Hispanic white adults aged 25–44 in 2000 were 50% lower compared with non-Hispanic black adults (140.6 compared with 282.7), and narrowed to 25% lower in 2017 (175.1 compared with 234.7).
Figure 2. Age-specific death rates for persons aged 25–44, by Hispanic origin and race: United States, 2000–2017
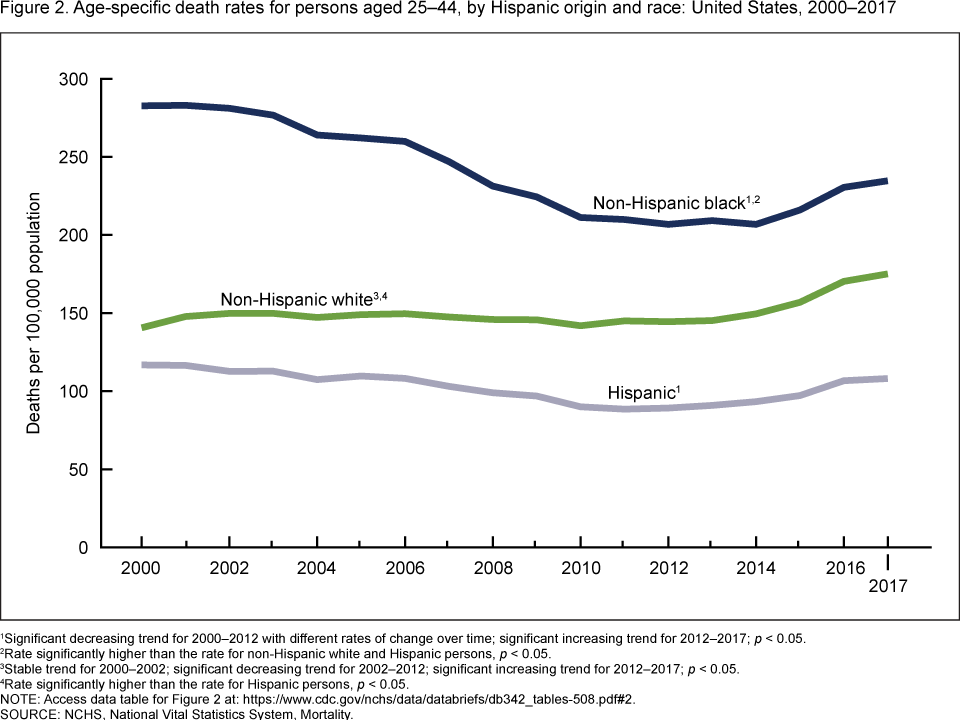
1Significant decreasing trend for 2000–2012 with different rates of change over time; significant increasing trend for 2012–2017; p < 0.05.
2Rate significantly higher than the rate for non-Hispanic white and Hispanic persons, p < 0.05.
3Stable trend for 2000–2002; significant decreasing trend for 2002–2012; significant increasing trend for 2012–2017; p < 0.05.
4Rate significantly higher than the rate for Hispanic persons, p < 0.05.
NOTE: Access data table for Figure 2.
SOURCE: NCHS, National Vital Statistics System, Mortality.
For adults aged 45–64, death rates among non-Hispanic white and non-Hispanic black adults increased more recently, whereas the rate for Hispanic adults was stable from 2011 through 2017.
- After remaining stable in the beginning of the period, death rates for adults aged 45–64 increased 9% among non-Hispanic white adults (from 606.3 in 2010 to 663.3 in 2017). After decreasing between 2000 and 2011, death rates among this age group increased 4% among non-Hispanic black adults (from 896.0 to 933.4) through 2017, whereas the rate for Hispanic adults was stable from 2011 through 2017 (Figure 3).
- Between 2000 and 2017, death rates among Hispanic adults aged 45–64 ranged from
55% through 57% lower compared with non-Hispanic black adults, whereas the difference in death rates between Hispanic and non-Hispanic white adults aged 45–64 increased from 23% lower for Hispanic adults in 2000 to 39% lower in 2017. - Death rates for non-Hispanic white adults in 2000 were 44% lower compared with non-Hispanic black adults (614.9 compared with 1,107.5) and narrowed to 29% lower in 2017 (663.3 compared with 933.4).
Figure 3. Age-specific death rates for persons aged 45–64, by Hispanic origin and race: United States, 2000–2017
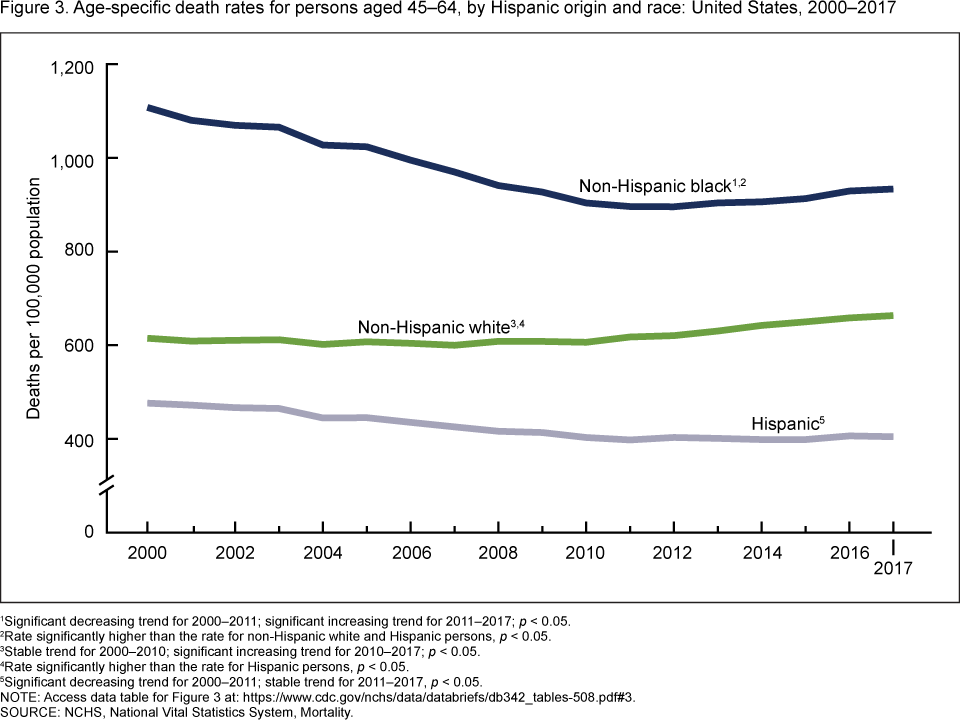
1Significant decreasing trend for 2000–2011; significant increasing trend for 2011–2017; p < 0.05.
2Rate significantly higher than the rate for non-Hispanic white and Hispanic persons, p < 0.05.
3Stable trend for 2000–2010; significant increasing trend for 2010–2017; p < 0.05.
4Rate significantly higher than the rate for Hispanic persons, p < 0.05.
5Significant decreasing trend for 2000–2011; stable trend for 2011–2017, p < 0.05.
NOTE: Access data table for Figure 3.
SOURCE: NCHS, National Vital Statistics System, Mortality.
For adults aged 65 and over, death rates generally declined from 2000 through 2017 for all race and ethnicity groups.
- Death rates for Hispanic, non-Hispanic white, and non-Hispanic black adults aged 65 and over all generally declined between 2000 and 2017 (Figure 4).
- The percentage decline in the death rate for adults aged 65 and over was 27% for non-Hispanic black adults (from 5,727.3 in 2000 to 4,203.6 in 2017) compared with 18% and 17%, respectively, for non-Hispanic white adults (from 5,250.5 to 4,285.5) and Hispanic adults (from 3,414.2 to 2,817.1).
- The difference in death rates between non-Hispanic black and Hispanic adults aged 65 and over narrowed over the period, from 40% lower for Hispanic adults in 2000 to 33% lower in 2017; the difference in rates between Hispanic and non-Hispanic white adults remained relatively constant (34%–37% lower for Hispanic adults).
- In 2000, the death rate for adults aged 65 and over was 8% lower for non-Hispanic white adults than non-Hispanic black adults; these rates converged in 2010, and by 2017 the rate was 2% higher for non-Hispanic white adults than non-Hispanic black adults.
Figure 4. Age-specific death rates for persons aged 65 and over, by Hispanic origin and race: United States, 2000–2017
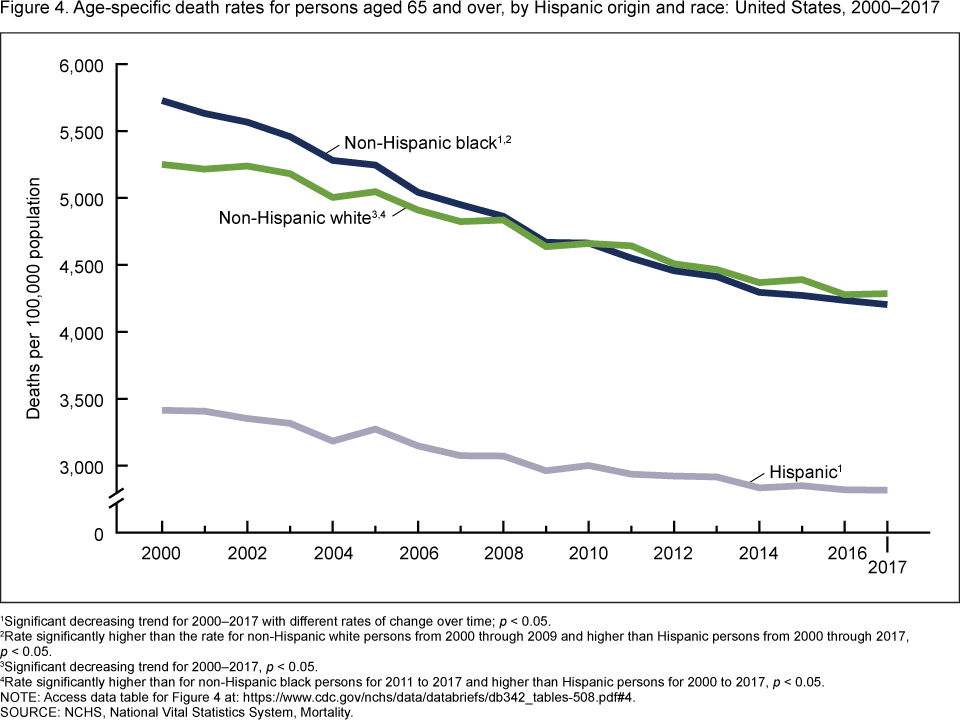
1Significant decreasing trend for 2000–2017 with different rates of change over time; p < 0.05.
2Rate significantly higher than the rate for non-Hispanic white persons from 2000 through 2009 and higher than Hispanic persons from 2000 through 2017, p < 0.05.
3Significant decreasing trend for 2000–2017, p < 0.05.
4Rate significantly higher than for non-Hispanic black persons for 2011 to 2017 and higher than Hispanic persons for 2000 to 2017, p < 0.05.
NOTE: Access data table for Figure 4.
SOURCE: NCHS, National Vital Statistics System, Mortality.
Summary
The age-adjusted death rate for Hispanic adults aged 25 and over generally declined from 2000 through 2017, whereas the rates for non-Hispanic white and non-Hispanic black adults declined through 2011 and 2012, respectively, and then were stable through 2017. Rates for Hispanic adults were always lower than for non-Hispanic white and non-Hispanic black adults. The difference in age-adjusted rates between Hispanic and non-Hispanic black adults remained relatively stable over the period, whereas the difference in rates between Hispanic and non-Hispanic white adults widened. The difference in age-adjusted death rates between non-Hispanic white and black adults was reduced by almost one-half over the period, from 24% lower for non-Hispanic white adults in 2000 to 13% lower in 2017.
Among those aged 25–44, all race and ethnicity groups experienced increases in death rates more recently, with greater percentage increases for non-Hispanic white and non-Hispanic black adults than for Hispanic adults. Trends for Hispanic adults aged 45–64 differed from trends for non-Hispanic white and black adults. After declining from 2000 through 2011, death rates for Hispanic adults aged 45–64 remained steady from 2011 through 2017. Rates for non-Hispanic white and non-Hispanic black adults increased recently, from 2010–2011 to 2017, with a greater percentage increase for non-Hispanic white adults than for non-Hispanic black and Hispanic adults. For adults aged 65 and over, all race and ethnicity groups showed general declines over the period, with non-Hispanic black adults experiencing the greatest percentage decline.
The findings in this report are consistent with previous research showing that Hispanic adults in the United States have traditionally had lower mortality and higher life expectancy thannon-Hispanic white and non-Hispanic black adults (1–6). This report also shows that the mortality advantage for Hispanic adults has endured through 2017 and has been increasing with respect to non-Hispanic white adults. The difference in death rates between non-Hispanic white and non-Hispanic black adults has generally narrowed.
Data sources and methods
Mortality and population data are from the National Center for Health Statistics’ 1999–2017 underlying cause-of-death mortality files (7) . Age-adjusted death rates were calculated using the direct method and the 2000 standard population (8). Population data for 2000 and 2010 are April 1 bridged-race census counts: for 2001–2009, they are July 1 intercensal estimates; and for 2011–2017, they are July 1 postcensal estimates based on the 2010 census. Trends in age-adjusted and age-specific death rates in Figures 1–4 were evaluated using the Joinpoint Regression Program (9). The Joinpoint software was used to fit weighted least-squares regression models to the estimated proportions on the logarithmic scale. The default settings allowed for as few as three observed time points in the beginning, ending, and middle line segments, including the joinpoints. Using these settings, a maximum of two joinpoints were searched for using the grid search algorithm and permutation test, and an overall alpha level of 0.05.
Pairwise comparisons between race and ethnicity groups were tested using the z test statistic at the 0.05 level of significance.
Information on race and ethnicity are from death certificates and are supplied by an informant, usually the next of kin. Race and Hispanic origin are two distinct attributes and are reported separately on death certificates. Therefore, the data shown in this report by Hispanic origin and race are based on a combination of the two attributes for the non-Hispanic population. Data shown for the Hispanic population include adults of any race. Death rates for Hispanic adults are impacted by inconsistencies in reporting Hispanic origin on the death certificate compared with censuses and surveys. A validity study has shown underreporting on death certificates of Hispanic decedents by 3% (10).
Past research has shown significant differences in death rates by specified Hispanic subgroups (Mexican, Cuban, Puerto Rican, Dominican, Central and South American, other Hispanic) and by nativity status for Hispanic adults (U.S. born, foreign born) (4,6). As the majority of Hispanic adults living in the United States are of Mexican descent (11), the trends in this report are mostly reflective of trends for that group.
About the authors
Sally C. Curtin and Elizabeth Arias are with the National Center for Health Statistics, Division of Vital Statistics.
References
- Arias E, Xu JQ. United States life tables, 2017. National Vital Statistics Reports; vol 68 no 7. Hyattsville, MD: National Center for Health Statistics. 2019.
- Arias E, Kochanek KD, Anderson RN. How does cause of death contribute to the Hispanic mortality advantage in the United States? NCHS Data Brief, no 221. Hyattsville, MD: National Center for Health Statistics. 2015.
- Markides KS, Coreil J. The health of Hispanics in the southwestern United States: An epidemiologic paradox. Public Health Rep 101(3):253–65. 1986.
- Palloni A, Arias E. Paradox lost: Explaining the Hispanic adult mortality advantage. Demography 41(3):385–415. 2004.
- Arias E. United States life tables by Hispanic origin. National Center for Health Statistics. Vital Health Stat 2(152). 2010.
- Fenelon A, Chinn JJ, Anderson RN. A comprehensive analysis of the mortality experience of Hispanic subgroups in the United States: Variation by age, country of origin, and nativity. SSM Popul Health 3:245–54. 2017.
- National Center for Health Statistics. About underlying cause of death, 1999–2017. CDC WONDER online database. 2016.
- Kochanek KD, Murphy SL, Xu JQ, Arias E. Deaths: Final data for 2017. National Vital Statistics Reports; vol 68 no 9. Hyattsville, MD: National Center for Health Statistics. 2019.
- National Cancer Institute. Joinpoint Regression Program (version 4.4.0.0) [computer software]. 2017.
- Arias E, Heron M, Hakes JK. The validity of race and Hispanic-origin reporting on death certificates in the United States: An update. National Center for Health Statistics. Vital Health Stat 2(172). 2016.
- Pew Research Center. Facts on U.S. Latinos, 2015. 2017.
Suggested citation
Curtin SC, Arias E. Mortality trends by race and ethnicity among adults aged 25 and over, 2000–2017. NCHS Data Brief, no 342. Hyattsville, MD: National Center for Health Statistics. 2019.
Copyright information
All material appearing in this report is in the public domain and may be reproduced or copied without permission; citation as to source, however, is appreciated.
National Center for Health Statistics
Jennifer H. Madans, Ph.D., Acting Director
Amy M. Branum, Ph.D., Acting Associate Director for Science
Division of Vital Statistics
Steven Schwartz, Ph.D., Director
Hanyu Ni, Ph.D., M.P.H., Associate Director for Science