Regional Variation in Private Dental Coverage and Care Among Dentate Adults Aged 18–64 in the United States, 2014–2017
- Key findings
- Dental coverage was highest in the North Central, Middle Atlantic, and New England regions.
- Adults in the East and West South Central regions were most likely to not see a dentist in the past 12 months.
- Unmet dental care needs due to cost were highest in the Mountain and West South Central regions.
- Summary
- Definitions
- Data source and methods
- About the authors
- References
- Suggested citation
PDF Version (481 KB)
Debra L. Blackwell, Ph.D., Maria A. Villarroel, Ph.D., and Tina Norris, Ph.D.
Key findings
Data from the National Health Interview Survey
- Nationally, 50.2% of dentate adults aged 18–64 with private health insurance had dental care coverage throughout the past 12 months.
- Regional percentages of dental coverage ranged from 45.6% in the East South Central and South Atlantic regions to 57.1% in New England.
- Nationally, 22.1% of dentate adults with dental coverage did not see a dentist in the past 12 months, with regional percentages ranging from 29.4% in the West South Central region to 14.3% in New England.
- Unmet dental care needs due to cost among dentate adults with dental coverage were lowest in the West North Central (2.8%) region and highest in the Mountain region (7.0%).
Routine dental care can promote oral health (1,2), and those with private dental insurance are more likely to visit a dentist than those with other types of dental coverage or no coverage (3,4). Geographical variation in dental coverage and care among adults under age 65 exists (5,6), as does the availability of dental health professionals (7). This report examines regional variation in dental coverage among dentate adults (i.e., adults who have not lost all permanent teeth) aged 18–64 who had private health insurance in the past year, their utilization of dental care, and unmet dental needs due to cost in the past year.
Keywords: dental visits, unmet dental need, dental care coverage, National Health Interview Survey.
Dental coverage was highest in the North Central, Middle Atlantic, and New England regions.
- Dental coverage among dentate adults was significantly higher than the national average (50.2%) in the New England (57.1%), Middle Atlantic (55.8%), West North Central (55.0%), and East North Central (53.5%) regions (Figure 1).
- Dental coverage was significantly lower than the national average in the South Atlantic (45.6%), East South Central (45.6%), West South Central (45.9%), and Pacific (48.0%) regions.
- Dental coverage in the Mountain region (48.6%) was comparable with the national average.
Figure 1. Percentage of dentate adults aged 18–64 who had dental care coverage, by region: United States, 2014–2017
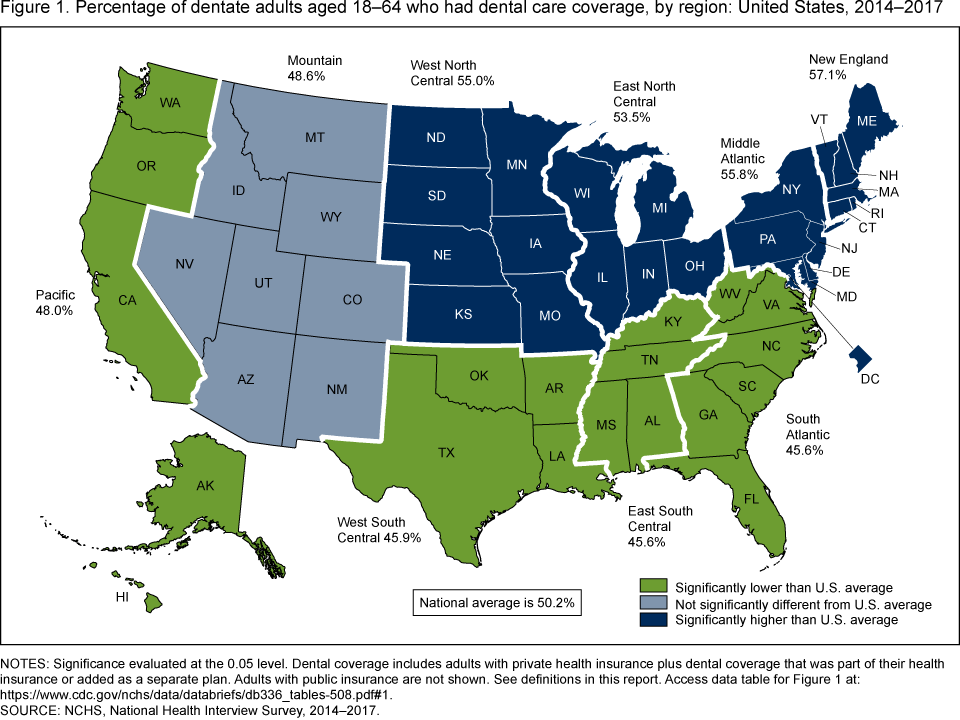
NOTES: Significance evaluated at the 0.05 level. Dental coverage includes adults with private health insurance plus dental coverage that was part of their health insurance or added as a separate plan. Adults with public insurance are not shown. See definitions in this report. Access data table for Figure 1.
SOURCE: NCHS, National Health Interview Survey, 2014–2017.
Adults in the East and West South Central regions were most likely to not see a dentist in the past 12 months.
- Compared with the national average (22.1%), dentate adults aged 18–64 with dental coverage were significantly more likely to go without seeing a dentist in the past 12 months in the East South Central (26.9%) and West South Central (29.4%) regions (Figure 2).
- Among dentate adults aged 18–64 with dental coverage, the percentages who did not see a dentist in the past 12 months were significantly lower than the national average in the New England (14.3%), Middle Atlantic (20.0%), and East North Central (20.6%) regions.
- Dentate adults aged 18–64 with dental coverage in the Pacific (21.1%), Mountain (22.5%), West North Central (22.5%), and South Atlantic (22.7%) regions were as likely as the nation as a whole to have not seen a dentist in the past 12 months.
Figure 2. Percentage of dentate adults aged 18–64 with dental care coverage who did not see a dentist in the past 12 months, by region: United States, 2014–2017
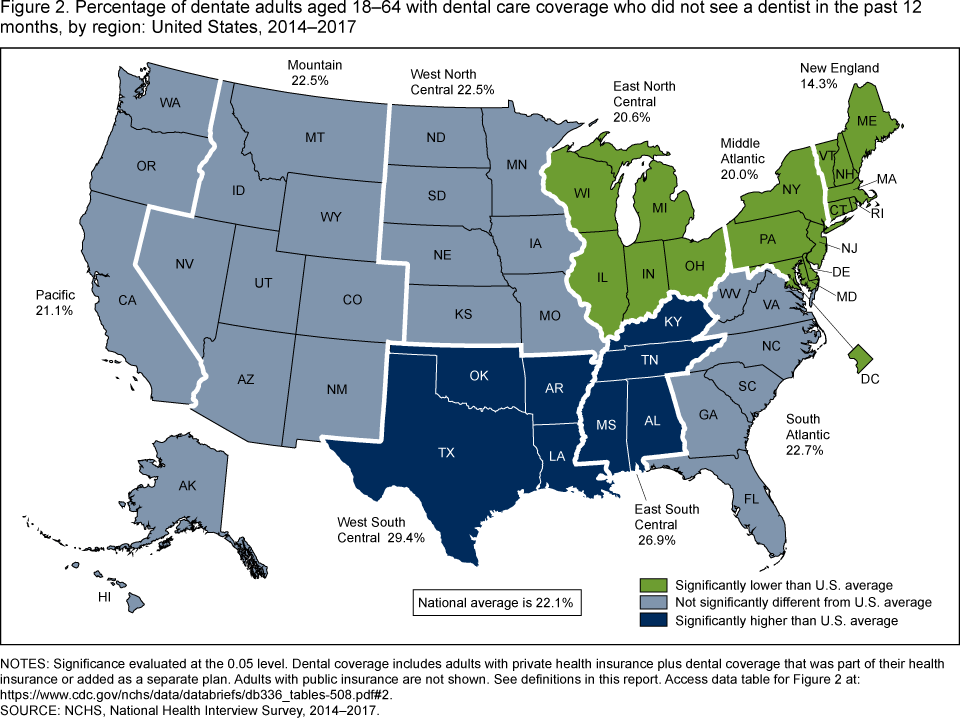
NOTES: Significance evaluated at the 0.05 level. Dental coverage includes adults with private health insurance plus dental coverage that was part of their health insurance or added as a separate plan. Adults with public insurance are not shown. See definitions in this report. Access data table for Figure 2.
SOURCE: NCHS, National Health Interview Survey, 2014–2017.
Unmet dental care needs due to cost were highest in the Mountain and West South Central regions.
- Among dentate adults aged 18–64 with dental coverage, the Mountain (7.0%) and West South Central (5.4%) regions had significantly higher percentages of unmet needs due to cost in the past 12 months compared with the national average (4.4%) (Figure 3).
- Dentate adults with dental coverage in the West North Central (2.8%) and Middle Atlantic (3.7%) regions had significantly lower percentages of unmet dental care needs due to cost in the past 12 months compared with the national average.
- Unmet dental care needs among dentate adults with dental care coverage were not significantly different from the national average in the New England (3.5%), East South Central (4.1%), East North Central (4.4%), Pacific (4.5%), and South Atlantic (4.7%) regions.
Figure 3. Percentage of dentate adults aged 18–64 with dental coverage who needed dental care but couldn’t afford it in the past 12 months, by region: United States, 2014–2017
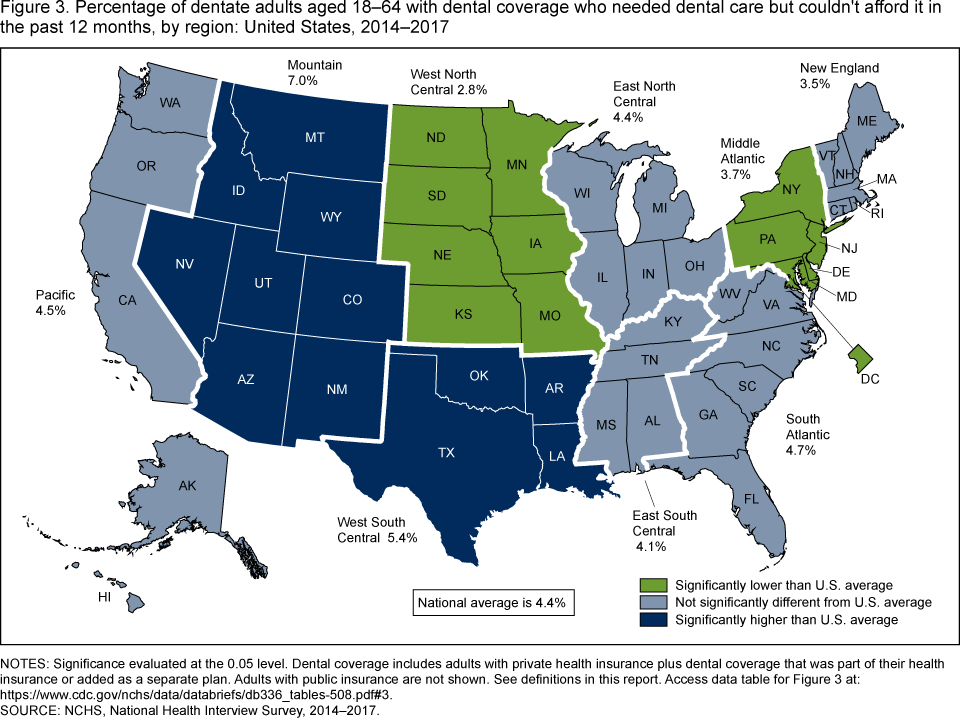
NOTES: Significance evaluated at the 0.05 level. Dental coverage includes adults with private health insurance plus dental coverage that was part of their health insurance or added as a separate plan. Adults with public insurance are not shown. See definitions in this report. Access data table for Figure 3.
SOURCE: NCHS, National Health Interview Survey, 2014–2017.
Summary
About one-half (50.2%) of dentate adults aged 18–64 in the United States had private health coverage with dental coverage during 2014–2017. Among those with private health insurance and dental coverage, less than one-fourth (22.1%) did not see a dentist in the past 12 months, and 4.4% had unmet dental needs due to cost in the past 12 months.
Compared with national averages, dentate adults in the U.S. Middle Atlantic region were more likely to have private dental coverage in the past year, less likely to go without seeing a dentist in the past year, and less likely to have unmet dental needs due to cost. Similarly, dentate adults in the New England, West North Central, and East North Central regions also had higher percentages of dental coverage than the national average, lower percentages than the national average of dentate adults who did not see a dentist in the past 12 months (New England and East North Central regions), and a lower percentage than the national average of having unmet dental needs due to cost (West North Central region only).
In contrast, dentate adults in the West South Central and East South Central regions had lower percentages of dental coverage, higher percentages of dentate adults who did not see a dentist in the past 12 months, and a higher percentage of unmet dental needs due to cost (West South Central region only) compared with national averages.
Dentate adults in the Pacific and South Atlantic regions had lower percentages of private dental coverage than the national average, but among those with coverage, the percentages who did not see a dentist or had unmet dental needs due to cost were comparable with the national average. Unmet dental care needs due to cost were higher than the national average in the Mountain region even though dentate adults in this region were comparable with the United States with respect to both percentages of dental coverage and not having seen a dentist in the past 12 months.
Definitions
Dental coverage status: Refers to adults aged 18–64 who had any private health insurance plan for the 12 months prior to their National Health Interview Survey (NHIS) interview plus dental coverage that was either part of that plan or added separately via the purchase of a single-service dental plan. A single-service dental plan refers to a private health insurance plan, usually purchased separately, that only pays for dental care. Respondents with such plans were identified based on a positive response to the following question, “You mentioned that {you have/person has} a single-service plan—that is, an insurance plan that provides one specific type of coverage. What type of service or care does {your/person’s} single service plan or plans pay for? … Dental care.”
Dental care coverage reflects coverage at the time of interview. Also, “adults with private dental coverage” does not include publicly insured adults who purchased a single-service dental plan, or privately insured adults with dental coverage who had a lapse in private health insurance during the past year.
Dental visit in the past 12 months: Based on the following question, “About how long has it been since you last saw a dentist? Include all types of dentists, such as orthodontists, oral surgeons, and all other dental specialists, as well as dental hygienists.” Sample adults who responded with “6 months or less” or “More than 6 months, but not more than 1 year ago” were considered to have seen a dentist in the past 12 months.
Dentate adults: Refers to persons who have not lost all of their permanent or natural teeth (both upper and lower), as identified by “no” responses to the question, “Have you lost all of your upper and lower natural (permanent) teeth?” During 2014–2017, 96.4% of U.S. adults aged 18–64 had some or all of their natural teeth.
Regions: Categories were slightly modified from the nine U.S. Census Bureau-designated divisions by moving Delaware, the District of Columbia, and Maryland into the Middle Atlantic region (8). Divisions include: New England—Connecticut, Maine, Massachusetts, New Hampshire, Rhode Island, Vermont; Middle Atlantic—Delaware, District of Columbia, Maryland, New Jersey, New York, Pennsylvania; East North Central—Illinois, Indiana, Michigan, Ohio, Wisconsin; West North Central—Iowa, Kansas, Minnesota, Missouri, Nebraska, North Dakota, South Dakota; South Atlantic—Florida, Georgia, North Carolina, South Carolina, Virginia, West Virginia; East South Central—Alabama, Kentucky, Mississippi, Tennessee; West South Central—Arkansas, Louisiana, Oklahoma, Texas; Mountain—Arizona, Colorado, Idaho, Montana, New Mexico, Nevada, Utah, Wyoming; and Pacific—Alaska, California, Hawaii, Oregon, Washington.
Unmet dental needs due to cost: Based on a positive response to the question, “During the past 12 months, was there any time when you needed any of the following but didn’t get it because you couldn’t afford it? … Dental care (including check-ups)?”
Data source and methods
Data from the 2014–2017 NHIS were used for this analysis. NHIS data are collected continuously throughout the year and include information about the health and health care of the civilian noninstitutionalized U.S. population. Interviews are conducted in respondents’ homes, but follow-ups to complete interviews may be conducted over the telephone.
Information from the Sample Adult component of the 2014–2017 NHIS was used to determine dental visits and unmet dental needs due to cost in the past 12 months for 91,946 adult respondents aged 18–64 who had not lost all of their upper and lower teeth. Information on private health insurance and dental care coverage was obtained from the 2014–2017 Person files. All analyses excluded adults with unknown private insurance status as well as those with private insurance and unknown dental coverage; adults with unknown information about dental visits in the past 12 months and unmet dental care needs due to cost in the past 12 months were also excluded from the analyses shown in Figures 2 and 3, respectively. For more information about NHIS, including the questionnaire, visit the NHIS website: https://www.cdc.gov/nchs/nhis.htm.
Sampling weights were used to produce national and regional estimates that were representative of the civilian noninstitutionalized U.S. population aged 18–64. Data weighting procedures are described in more detail elsewhere (9,10). Point estimates and estimates of their variances were calculated using SUDAAN software to account for the complex sampling design of NHIS (11). The Taylor series linearization method was chosen for estimation of standard errors. Differences between percentages were evaluated using two-sided significance tests at the 0.05 level. The estimated standard error of the difference between regional and national estimates accounted for nonindependence of regional and national estimates by incorporating their covariance.
About the authors
Debra L. Blackwell, Maria A. Villarroel, and Tina Norris are with the National Center for Health Statistics, Division of Health Interview Statistics.
References
- American Dental Association. Action for dental health: Bringing disease prevention into communities. A statement from the American Dental Association. 2013.
- U.S. Department of Health and Human Services. Oral health.
- Bloom B, Simile CM, Adams PF, Cohen RA. Oral health status and access to oral health care for U.S. adults aged 18–64: National Health Interview Survey, 2008. National Center for Health Statistics. Vital Health Stat 10(253). 2012.
- Hinton E, Paradise J. Access to dental care in Medicaid: Spotlight on nonelderly adults. The Kaiser Commission on Medicaid and the Uninsured. Issue Brief. March 2016.
- Cohen RA, Martinez ME, Zammitti EP. Health insurance coverage: Early release of estimates from the National Health Interview Survey, 2015. National Center for Health Statistics. May 2016.
- Khan A, Thapa JR, Zhang D. Preventive dental checkups and their association with access to usual source of care among rural and urban adult residents. J Rural Health 33(4):419–26. 2017.
- National Center for Health Statistics. Table 86. Active dentists, by state: United States, selected years 2001–2016. Health, United States, 2017: With special feature on mortality. Hyattsville, MD: National Center for Health Statistics. 2018.
- Holahan J, Buettgens M, Carroll C, Dorn S. The cost and coverage implications of the ACA Medicaid expansion: National and state-by-state analysis. Kaiser Commission on Medicaid and the Uninsured. 2012.
- Parsons VL, Moriarity C, Jonas K, Moore TF, Davis KE, Tompkins L. Design and estimation for the National Health Interview Survey, 2006–2015. National Center for Health Statistics. Vital Health Stat 2(165). 2014.
- National Center for Health Statistics. 2017 National Health Interview Survey (NHIS) public use data release. Survey description. 2018.
- RTI International. SUDAAN (Release 11.0.0) [computer software]. 2012.
Suggested citation
Blackwell DL, Villarroel MA, Norris T. Regional variation in private dental coverage and care among dentate adults aged 18–64 in the United States,
2014–2017. NCHS Data Brief, no 336. Hyattsville, MD: National Center for Health Statistics. 2019.
Copyright information
All material appearing in this report is in the public domain and may be reproduced or copied without permission; citation as to source, however, is appreciated.
National Center for Health Statistics
Jennifer H. Madans, Ph.D., Acting Director
Amy M. Branum, Ph.D., Acting Associate Director for Science
Division of Health Interview Statistics
Stephen J. Blumberg, Ph.D., Director
Anjel Vahratian, Ph.D., M.P.H., Associate Director for Science