Births in the United States, 2017
- Key findings
- The general fertility rate declined for nearly all race and Hispanic-origin groups in 2017.
- Teen birth rates declined for nearly all race and Hispanic-origin groups in 2017.
- Approximately two in five deliveries had Medicaid as the source of payment for the delivery in 2017.
- Preterm birth rates were up overall, and among births to women aged 25–34.
- Summary
- Definitions
- Data source and methods
- About the authors
- References
- Suggested citation
PDF Version (425 KB)
Joyce A. Martin, M.P.H., Brady E. Hamilton, Ph.D., and Michelle J.K. Osterman, M.H.S.
Key findings
Data from the National Vital Statistics System
- The U.S. general fertility rate (births per 1,000 females aged 15–44) declined 3% between 2016 and 2017; rates declined for nearly all race and Hispanic-origin groups.
- The teen birth rate declined 7% from 2016 to 2017, to 18.8 births per 1,000 females aged 15–19. Rates fell for nearly all race and Hispanic-origin groups.
- Medicaid was the source of payment for 43.0% of all births in 2017, an increase of 1% from 2016, and it increased for all maternal age groups.
- The preterm birth rate rose 1% in 2017, with increases among births to women aged 25–34.
This report presents selected highlights from 2017 final birth data on key demographic, health care utilization, and infant health indicators. General fertility rates (the number of births per 1,000 females aged 15–44 years) and teen birth rates are presented by race and Hispanic origin. The use of Medicaid as the source of payment for the delivery and preterm birth rates are presented by the age of the mother. Data for 2017 are compared with 2016 for each indicator.
Keywords: fertility rates, Medicaid, preterm births, National Vital Statistics System
The general fertility rate declined for nearly all race and Hispanic-origin groups in 2017.
- The United States general fertility rate was 60.3 in 2017, down 3% from 2016 (Figure 1).
- The largest declines between 2016 and 2017 were for non-Hispanic Asian and non-Hispanic American Indian or Alaska Native (AIAN) females, down 5% each, to 58.0 and 59.5, respectively.
- Fertility rates declined by less than 1% for non-Hispanic black (to 63.1%), 3% for non-Hispanic white (to 57.2), and 4% for Hispanic (to 67.6) females between 2016 and 2017.
Figure 1. General fertility rates, by race and Hispanic origin of mother: United States, 2016 and 2017
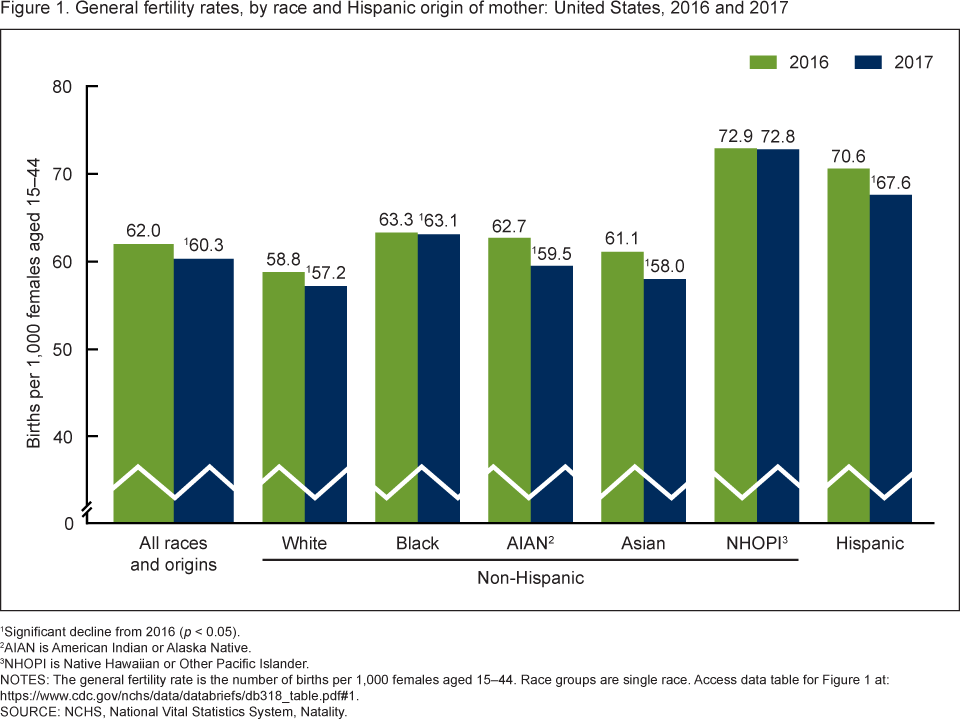
1Significant decline from 2016 (p < 0.05).
2AIAN is American Indian or Alaska Native.
3NHOPI is Native Hawaiian or Other Pacific Islander.
NOTES: The general fertility rate is the number of births per 1,000 females aged 15–44. Race groups are single race. Access data table for Figure 1.
SOURCE: NCHS, National Vital Statistics System, Natality.
Teen birth rates declined for nearly all race and Hispanic-origin groups in 2017.
- The teen birth rate declined 7% from 2016 to 2017, to 18.8 births per 1,000 females aged 15–19 (Figure 2).
- The largest decline in the teen birth rate from 2016 to 2017 was for non-Hispanic Asian females, down 15% to 3.3 births per 1,000.
- The teen birth rate declined 8% for non-Hispanic white (to 13.2), 6% for non-Hispanic black (to 27.5) and AIAN (to 32.9), and 9% for Hispanic (to 28.9) females.
- The observed decline in the teen birth rate for non-Hispanic Native Hawaiian or Other Pacific Islander females (28.6 to 25.5) was not statistically significant.
Figure 2. Birth rates for females aged 15–19, by race and Hispanic origin of mother: United States, 2016 and 2017
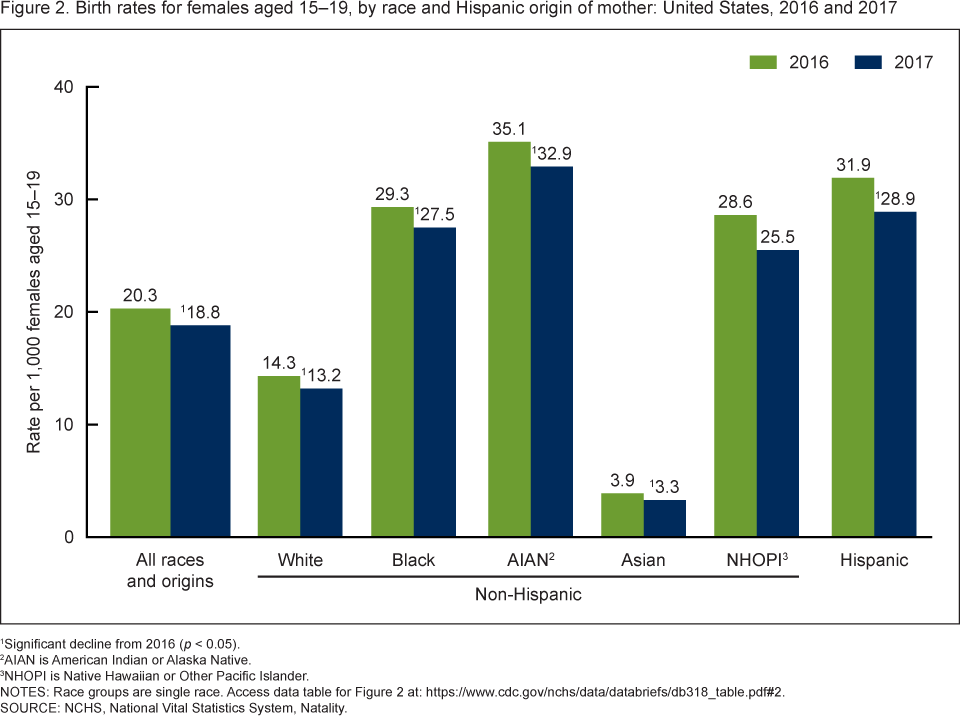
1Significant decline from 2016 (p < 0.05).
2AIAN is American Indian or Alaska Native.
3NHOPI is Native Hawaiian or Other Pacific Islander.
NOTES: Race groups are single race. Access data table for Figure 2.
SOURCE: NCHS, National Vital Statistics System, Natality.
Approximately two in five deliveries had Medicaid as the source of payment for the delivery in 2017.
- In 2017, white-space: nowrap;”>43.0% of all births had Medicaid as the source of payment for the delivery, up from 42.6% in 2016 (Figure 3).
- Medicaid coverage increased for all maternal age groups between 2016 and 2017. The largest increases were for women aged 30 and over, up 3%–4%.
- Medicaid coverage decreased with increasing maternal age, from a high of 77.5% (for 2017) among females under age 20, to 27.8% for women aged 35–39, and then increased slightly for women aged 40 and over (30.2%).
Figure 3. Medicaid as source of payment for the delivery, by age of mother: United States, 2016 and 2017
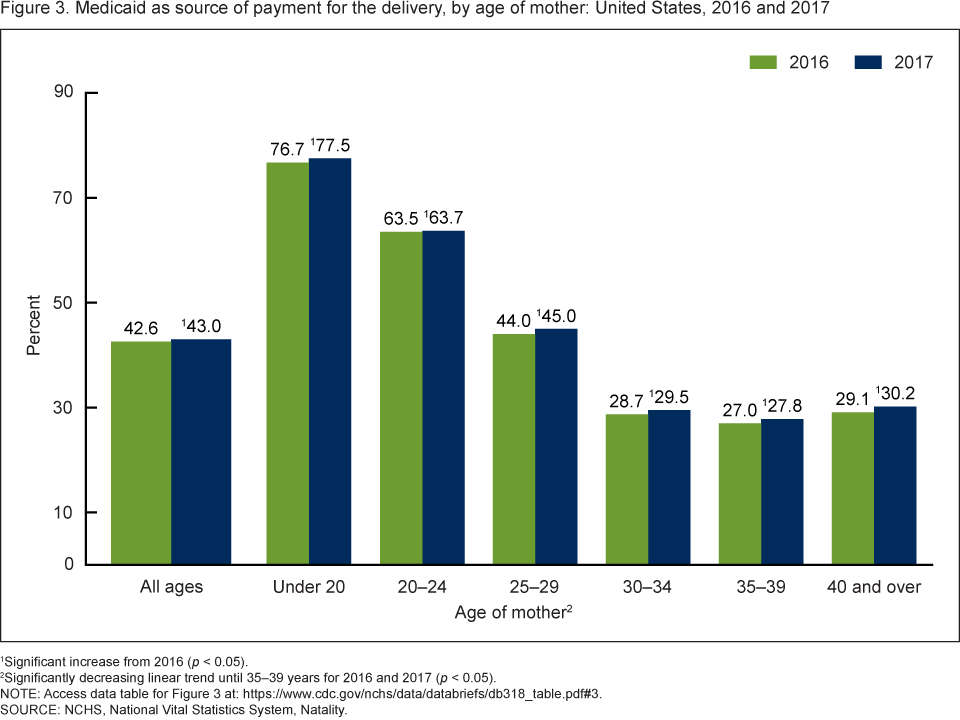
1Significant increase from 2016 (p < 0.05).
2Significantly decreasing linear trend until 35–39 years for 2016 and 2017 (p < 0.05).
NOTE: Access data table for Figure 3.
SOURCE: NCHS, National Vital Statistics System, Natality.
Preterm birth rates were up overall, and among births to women aged 25–34.
- The United States preterm birth rate rose 1% in 2017 to 9.93% of all births, from 9.85% in 2016 (Figure 4).
- The rate of late preterm births increased to 7.17% in 2017, from 7.09% in 2016; the early preterm birth rate was unchanged at 2.76%.
- Total preterm rates increased 1%–2% among births to women aged 25–29 and 30–34; late preterm rates rose for women aged 20–24, 25–29, and 30–34.
- The only increase in early preterm births by maternal age was for women aged 25–29.
- In both 2016 and 2017, preterm rates were lowest among births to women aged 25–29 (9.28% in 2017) and highest among births to women aged 40 and over (14.59%).
Figure 4. Preterm birth rates, by age of mother: United States, 2016 and 2017
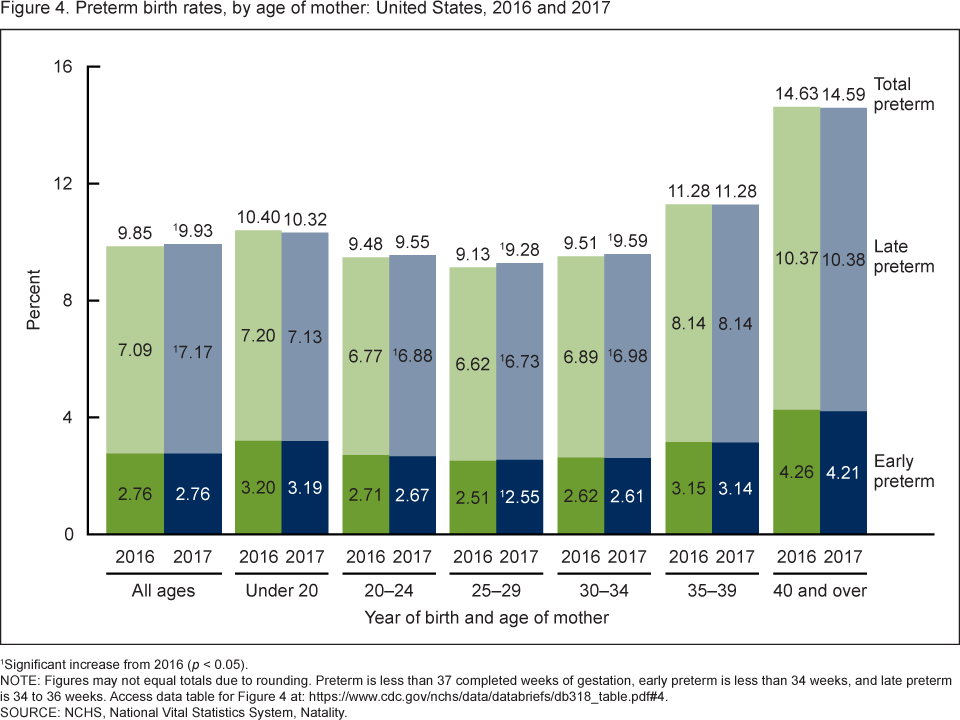
1Significant increase from 2016 (p < 0.05).
NOTE: Figures may not equal totals due to rounding. Preterm is less than 37 completed weeks of gestation, early preterm is less than 34 weeks, and late preterm is 34 to 36 weeks. Access data table for Figure 4.
SOURCE: NCHS, National Vital Statistics System, Natality.
Summary
Birth certificate data for 2017 show continued declines in childbearing in the United States overall, and among most race and Hispanic-origin groups. The 2017 general fertility rate fell to another all-time low and the number of births was the lowest reported in more than 30 years (1987) (1). Teen childbearing also declined to a record low in 2017, and is down 55% since 2007 (2). Overall and late preterm birth rates increased in 2017 with rises for women aged 25–34. Medicaid as the primary source of payment for delivery increased in 2017 overall and for each maternal age group.
This report presents general fertility and teen birth rates for final 2017 data by race and Hispanic origin, which were not previously available with provisional data (2). This report also presents preterm birth by maternal age. Rates of preterm birth by race and Hispanic origin are available in 2017 provisional data (2), and recent reports demonstrate increases in preterm and late preterm rates during 2014–2016 among most race and Hispanic-origin groups (3,4).
The 2017 data marks the second year for which national data for most items that were new to, or changed with, the 2003 revision of the U.S. Standard Certificate of Live Birth, including source of payment for delivery, have been available.
Definitions
General fertility rate: Number of births per 1,000 females aged 15–44.
Teen birth rate: Number of births per 1,000 females aged 15–19.
Medicaid (or comparable state program) payment: The primary source of payment for the delivery at the time of delivery.
Preterm birth rate: Births delivered prior to 37 completed weeks of gestation per 100 births. Gestational age is based on the obstetric estimate of gestation.
Early preterm birth rate: Births delivered prior to 34 completed weeks of gestation per 100 births.
Late preterm birth rate: Births delivered between 34–36 completed weeks of gestation per 100 births.
Data source and methods
This report uses data from the Natality Data File from the National Vital Statistics System (NVSS). The vital statistics natality file is based on information derived from birth certificates and includes information for all births occurring in the United States. This Data Brief accompanies the release of the 2017 natality public use file (5). More detailed analysis of the topics presented in this report plus many other topics, such as births to unmarried females, prenatal care, tobacco use during pregnancy, pregnancy risk factors, receipt of WIC food, maternal morbidity, and breastfeeding, is possible by using the annual natality files (5).
The race and Hispanic-origin groups shown in this report follow the 1997 standards and differ from the bridged-race categories shown in reports prior to 2016 (1).
References to increases or decreases in rates or percentages indicate that differences are statistically significant at the 0.05 level. Trends in rates for Figures 3 and 4 were evaluated using the Cochran-Armitage test for trends, a modified Chi-squared test. Computations exclude records for which information is unknown.
About the authors
Joyce A. Martin, Brady E. Hamilton, and Michelle J.K. Osterman are with the National Center for Health Statistics, Division of Vital Statistics, Reproductive Statistics Branch.
References
- Martin JA, Hamilton BE, Osterman MJK, Driscoll AK, Mathews TJ. Births: Final data for 2015. National Vital Statistics Reports; vol 66 no 1. Hyattsville, MD: National Center for Health Statistics. 2017.
- Hamilton BE, Martin JA, Osterman MJK, Driscoll AK, Rossen LM. Births: Provisional data for 2017. Vital Statistics Rapid Release; no 4. Hyattsville, MD: National Center for Health Statistics. May 2018.
- Martin JA, Osterman MJK. Describing the increase in preterm births in the United States, 2014–2016. NCHS Data Brief, no 312. Hyattsville, MD: National Center for Health Statistics. 2018.
- Martin JA, Hamilton BE, Osterman MJK. Births in the United States, 2016. NCHS Data Brief, no 287. Hyattsville, MD: National Center for Health Statistics. 2017.
- National Center for Health Statistics. Natality public-use file and CD-ROM. Hyattsville, MD: National Center for Health Statistics. Published annually.
Suggested citation
Martin JA, Hamilton BE, Osterman MJK. Births in the United States, 2017. NCHS Data Brief, no 318. Hyattsville, MD: National Center for Health Statistics. 2018.
Copyright information
All material appearing in this report is in the public domain and may be reproduced or copied without permission; citation as to source, however, is appreciated.
National Center for Health Statistics
Charles J. Rothwell, M.S., M.B.A., Director
Jennifer H. Madans, Ph.D., Associate Director for Science
Division of Vital Statistics
Delton Atkinson, M.P.H., M.P.H., P.M.P., Director
Hanyu Ni, Ph.D., M.P.H., Acting Associate Director for Science