Mental Health-related Physician Office Visits by Adults Aged 18 and Over: United States, 2012–2014
- Key findings
- Did mental health-related physician office visit rates vary by physician specialty and patient age?
- Did mental health-related physician office visit rates vary by physician specialty and patient sex?
- Did the percentage of mental health-related physician office visits vary by physician specialty and urban–rural status?
- Did the percentage of mental health-related physician office visits vary by physician specialty and primary expected source of payment?
- Summary
- Definitions
- Data source and methods
- About the authors
- References
- Suggested citation
PDF Version (739 KB)
Donald Cherry, M.S.; Michael Albert, M.D., M.P.H.; and Linda F. McCaig, M.P.H.
Key findings
Data from the National Ambulatory Medical Care Survey
- Among adults aged 18 and over, the rate of mental health-related physician office visits to psychiatrists (693 per 10,000 adults) was higher compared with the rate to primary care physicians overall (397 per 10,000 adults), and for all age groups except 65 and over.
- For both men and women, the rate of mental health-related office visits to psychiatrists was higher compared with visits to primary care physicians.
- The percentage of mental health-related office visits to psychiatrists compared with primary care physicians was lower in rural areas, but higher in large metropolitan areas.
- For all primary expected sources of payment except Medicare, a higher percentage of mental health-related office visits were to psychiatrists rather than to primary care physicians.
In 2016, mental illness affected about 45 million U.S. adults (1). Although mental health-related office visits are often made to psychiatrists (2), primary care physicians can serve as the main source of treatment for patients with mental health issues (3); however, availability of provider type may vary by geographic region (3,4). This report uses data from the 2012–2014 National Ambulatory Medical Care Survey (NAMCS) to examine adult mental health-related physician office visits by specialty and selected patient characteristics.
Keywords: mental illness, psychiatrist, primary care, NAMCS
Did mental health-related physician office visit rates vary by physician specialty and patient age?
- Mental health-related visit rates by physician specialty were 693 per 10,000 adults for psychiatrists, 397 per 10,000 adults for primary care physicians, and 162 per 10,000 adults for other specialties (Figure 1).
- Overall, the mental health-related office visit rate was 1,251 per 10,000 adults (Figure 1).
- The mental health-related office visit rate to psychiatrists was higher compared with the rate to primary care physicians among all adults, and among adults in age groups 18–34, 35–49, and 50–64. No significant difference was seen among adults aged 65 and over.
- The mental health-related office visit rates to other physician specialties were lower compared with primary care physician and psychiatrist rates overall, and for all age groups.
Figure 1. Mental health-related physician office visit rates for adults aged 18 and over, by physician specialty and age group: United States, 2012–2014
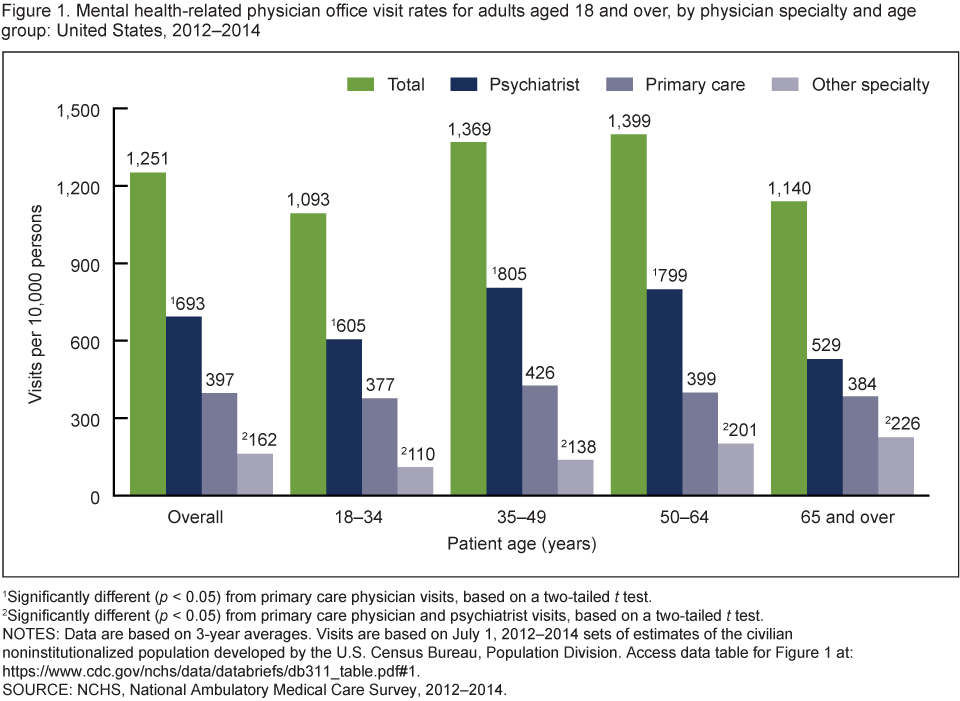
1Significantly different (p < 0.05) from primary care physician visits, based on a two-tailed t test.
2Significantly different (p < 0.05) from primary care physician and psychiatrist visits, based on a two-tailed t test.
NOTES: Data are based on 3-year averages. Visits are based on July 1, 2012–2014 sets of estimates of the civilian noninstitutionalized population developed by the U.S. Census Bureau, Population Division. Access data table for Figure 1.
SOURCE: NCHS, National Ambulatory Medical Care Survey, 2012–2014.
Did mental health-related physician office visit rates vary by physician specialty and patient sex?
- Mental health-related office visit rates to psychiatrists were higher compared with primary care physicians for both men (596 compared with 337 per 10,000 men) and women (782 compared with 452 per 10,000 women) (Figure 2).
- The mental health-related office visit rates to other physician specialties were lower compared with the psychiatrist and primary care physician visit rates for both men and women.
Figure 2. Mental health-related physician office visit rates for adults aged 18 and over, by physician specialty and patient sex: United States, 2012–2014
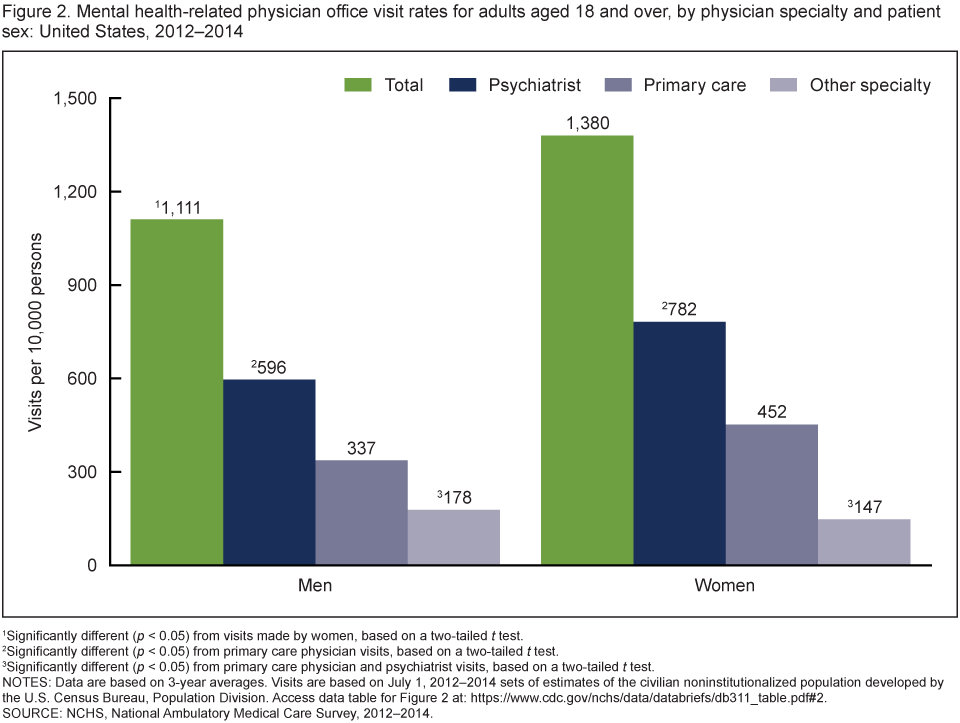
1Significantly different (p < 0.05) from visits made by women, based on a two-tailed t test.
2Significantly different (p < 0.05) from primary care physician visits, based on a two-tailed t test.
3Significantly different (p < 0.05) from primary care physician and psychiatrist visits, based on a two-tailed t test.
NOTES: Data are based on 3-year averages. Visits are based on July 1, 2012–2014 sets of estimates of the civilian noninstitutionalized population developed by the U.S. Census Bureau, Population Division. Access data table for Figure 2.
SOURCE: NCHS, National Ambulatory Medical Care Survey, 2012–2014.
Did the percentage of mental health-related physician office visits vary by physician specialty and urban–rural status?
- In large metropolitan areas, the percentage of mental health-related office visits to psychiatrists (63%) was higher compared with such visits to primary care physicians (26%) (Figure 3).
- In medium to small metropolitan areas, no significant difference was seen between the percentage of mental health-related office visits to psychiatrists (37%) and to primary care physicians (44%).
- In rural areas, the percentage of office visits related to mental health that were made to psychiatrists (29%) was lower compared with such visits to primary care physicians (54%).
- The percentage of mental health-related office visits to physicians of other specialties was lower compared with primary care physician and psychiatrist visits for all three urban–rural categories.
Figure 3. Percentage of mental health-related physician office visits by physician specialty, according to urban–rural status for adults aged 18 and over: United States, 2012–2014
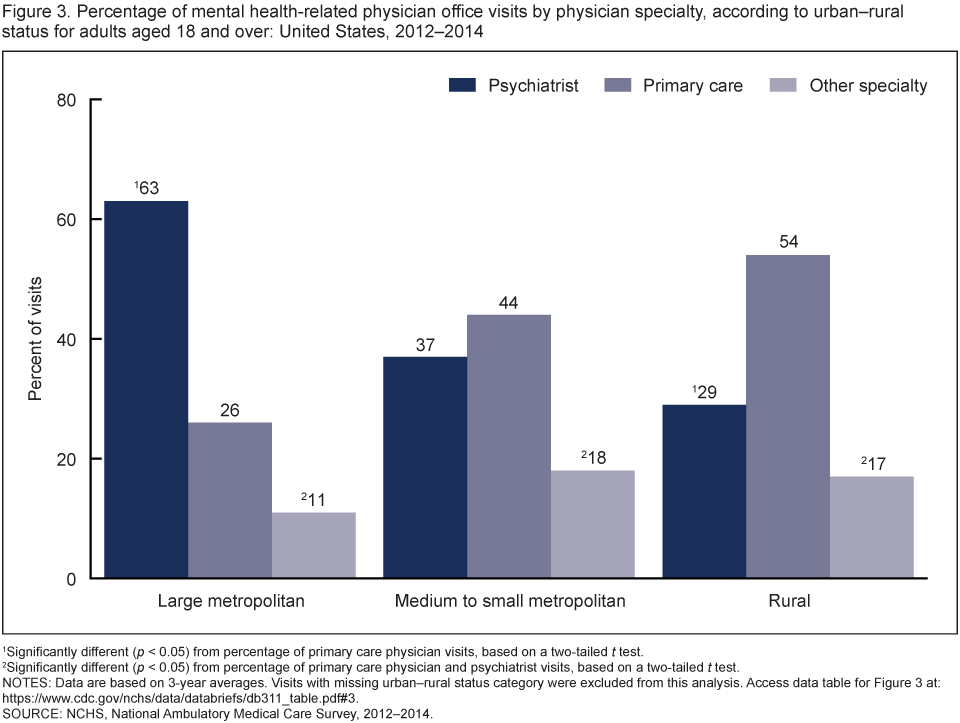
1Significantly different (p < 0.05) from percentage of primary care physician visits, based on a two-tailed t test.
2Significantly different (p < 0.05) from percentage of primary care physician and psychiatrist visits, based on a two-tailed t test.
NOTES: Data are based on 3-year averages. Visits with missing urban–rural status category were excluded from this analysis. Access data table for Figure 3.
SOURCE: NCHS, National Ambulatory Medical Care Survey, 2012–2014.
Did the percentage of mental health-related physician office visits vary by physician specialty and primary expected source of payment?
- A higher percentage of mental health-related office visits were made to psychiatrists compared with primary care physicians when the primary expected source of payment was private insurance (54% compared with 34%); Medicaid or Children’s Health Insurance Program (CHIP) (56% compared with 34%); or no insurance (78% compared with 14%), but no significant difference was seen for Medicare (Figure 4).
- Mental health-related office visits to physicians with other specialties were lowest compared with primary care and psychiatrist visits when private insurance; Medicare; or Medicaid or CHIP was the primary expected source of payment. However, among those with no insurance, the percentage of visits to other specialties (8%) was lower only when compared with psychiatrist visits (78%).
Figure 4. Percentage of mental health-related physician office visits by physician specialty, according to primary expected source of payment, for adults aged 18 and over: United States, 2012–2014

1Significantly different (p < 0.05) from percentage of primary care physician visits, based on a two-tailed t test.
2Significantly different (p < 0.05) from percentage of primary care physician and psychiatrist visits, based on a two-tailed t test.
3In data year 2014, the Medicaid or CHIP payment category was expanded to include one additional payment type: other state-based program.
4Significantly different (p < 0.05) from percentage of psychiatrist visits, based on a two-tailed t test.
NOTES: Data are based on 3-year averages. CHIP is Children’s Health Insurance Program. No insurance includes self-pay and no charge/charity. Visits with the following payment categories were excluded from this analysis: workers’ compensation, other, unknown, and blank. Access data table for Figure 4.
SOURCE: NCHS, National Ambulatory Medical Care Survey, 2012–2014.
Summary
Research indicates that during 2012–2014, an estimated annual average of 30 million mental health-related physician office visits were made by adults aged 18 and over (5). Psychiatrists provided care at 55% of these office visits, primary care physicians at 32%, and other specialists at 13% (5). Differences in mental health-related visits by physician specialty varied by age, urban–rural status, and primary expected source of payment. In large metropolitan areas, a higher percentage of mental health-related office visits were to psychiatrists compared with primary care physicians, while in rural areas, a lower percentage were to psychiatrists compared with primary care physicians. This is consistent with findings that indicate a greater supply of and access to primary care physicians compared with psychiatrists in rural regions (3,4). Mental health-related office visit rates to psychiatrists were higher compared with primary care physician rates in all age groups except for adults aged 65 and over, and as a percentage of visits among all primary expected payment types except Medicare. These results together may indicate that older adults, who are also more likely to use Medicare, are as likely to visit a primary care physician as they are a psychiatrist for mental health-related issues. Continued monitoring of utilization of mental health services is important in identifying future needs of the U.S. adult population.
Definitions
Mental health-related visits: Includes all visits with a primary reason for visit code of 1100–1199 or 2300–2349 based on “A Reason for Visit Classification for Ambulatory Care,” National Center for Health Statistics (NCHS) (6). Note that reason for visit classification was defined as the patient’s complaint(s), symptoms(s), or other reason(s) for the visit in the patient’s own words. Up to three reasons are recorded for each visit; however, only the primary reason for visit entry was used for this analysis.
Other specialty visits: Visits to American Medical Association (AMA) and American Osteopathic Association (AOA) physician specialists of the National Ambulatory Medical Care Survey (NAMCS) sample strata who are not primary care physicians or psychiatrists as defined below (6).
Primary care physician visits: Includes visits to AMA and AOA physician specialists of the NAMCS sample strata that are grouped into primary care, with the exception of obstetricians and gynecologists (6). Multiple individual AMA and AOA specialties were combined into broad categories used to define primary care, including: general/family practice–primary care, internal medicine–primary care, and pediatrics–primary care.
Primary expected source of payment: More than one source of expected payment may have been reported per office visit. When multiple payment categories were indicated, the primary expected source of payment (one payment type for each visit) was determined using the following hierarchy: Medicare; Medicaid or Children’s Health Insurance Program (CHIP) or other state-based program (added in 2014); private insurance; workers’ compensation; self-pay, no charge/charity; other; or unknown (6). The “no insurance” category for this analysis includes self-pay, and no charge/charity. Visits with a primary expected source of payment of workers’ compensation, other, unknown, and blank (7% of weighted mental health-related visits) were excluded from the analysis summarized in Figure 4.
Psychiatrist visits: Includes visits to AMA and AOA physician specialists of the NAMCS sample strata identified as psychiatrists (6). As with primary care, multiple individual AMA and AOA psychiatric specialties were combined into the broadly defined psychiatry specialty.
Urban–rural status: Derived from the 2013 NCHS Urban–Rural Classification Scheme for Counties (NCHS scheme), which is based on the February 2013 Office of Management and Budget’s delineation of metropolitan statistical areas (MSAs) and nonmetropolitan areas. For this report, patient’s county of residence was categorized by collapsing the NCHS scheme categories into the following two metro and one nonmetro categories: “large metropolitan” (counties in MSAs of 1 million or more population), “medium to small metropolitan” (counties in MSAs of less than 1 million population), and “rural” (nonmetropolitan counties). Visits with missing urban–rural status category (7% of weighted mental health-related visits) were excluded from the analysis summarized in Figure 3.
Visit rate: Calculated by dividing the combined weighted number of visits for 2012–2014 (numerator) by the combined postcensal estimates of the U.S. civilian noninstitutional population for 2012–2014 (denominator). Population estimates were developed by the U.S. Census Bureau, Population Division (6). Rates in this report are presented per 10,000 adults.
Data source and methods
Data for this analysis are from the 2012–2014 NAMCS, which is a nationally representative survey of visits made to nonfederal office-based physicians that is conducted annually by NCHS. NAMCS uses a stratified two-stage probability sampling design, with physicians selected at the first stage and visits selected at the second stage. The survey data are weighted to produce national estimates of office visits. Detailed information on the methodology of NAMCS, including changes to the survey that began in 2012, is available elsewhere (6).
Data were collected on 76,330 office visits in 2012, 54,873 office visits in 2013, and 45,710 office visits in 2014. The weighted visit response rate was 39.4% for the 2012 survey, 40.4% for the 2013 survey, and 39.0% for the 2014 survey (6). For 2012–2014, a sample of 6,040 mental health-related visits was drawn from all visits made by patients aged 18 and over. Unweighted adult mental health-related data for 2012–2014 were imputed for patient birth year (0.7%) and sex (2.2%). Data analyses were performed using statistical packages SAS version 9.4 (SAS Institute, Cary, N.C.) and SAS-callable SUDAAN version 11.0 (RTI International, Research Triangle Park, N.C.). Differences between groups were evaluated using a two-tailed t test (p < 0.05). No adjustments were made for multiple comparisons of estimates.
About the authors
Donald Cherry, Michael Albert, and Linda F. McCaig are with the National Center for Health Statistics, Division of Health Care Statistics, Ambulatory and Hospital Care Statistics Branch.
References
- National Institute of Mental Health. Health information: Statistics: Mental illness.
- Cherry D, McCaig L, Albert M. QuickStats: Percentage of mental illness-related physician office visits by persons aged ≥ 18 years, by physician specialty and region—United States, 2012. MMWR 64(38):1094. 2015.
- Olfson M. The rise of primary care physicians in the provision of US mental health care. J Health Polit Policy Law 41(4):559–83. 2016.
- Xierali IM, Tong ST, Petterson SM, Puffer JC, Phillips RL Jr, Bazemore AW. Family physicians are essential for mental health care delivery. J Am Board Fam Med 26(2):114–5. 2013.
- National Center for Health Statistics. 2012–2014 NAMCS micro-data file.
- National Center for Health Statistics. 2012–2014 NAMCS micro-data file documentation.
Suggested citation
Cherry D, Albert M, McCaig LF. Mental health-related physician office visits by adults aged 18 and over: United States, 2012–2014. NCHS Data Brief, no 311. Hyattsville, MD: National Center for Health Statistics. 2018.
Copyright information
All material appearing in this report is in the public domain and may be reproduced or copied without permission; citation as to source, however, is appreciated.
National Center for Health Statistics
Charles J. Rothwell, M.S., M.B.A., Director
Jennifer H. Madans, Ph.D., Associate Director for Science
Division of Health Care Statistics
Denys T. Lau, Ph.D., Director
Alexander Strashny, Ph.D., Associate Director for Science