Maternal Characteristics of Prenatal WIC Receipt in the United States, 2016
- Key findings
- Prenatal WIC receipt rates varied by state in 2016.
- In 2016, prenatal WIC receipt rates declined as maternal age increased for women under age 40.
- Prenatal WIC receipt rates varied by race and Hispanic origin in 2016.
- In 2016, prenatal WIC receipt rates were lower for mothers with higher educational attainment.
- Summary
- Definitions
- Data source and methods
- About the authors
- References
- Suggested citation
NCHS Data Brief No. 298, January 2018
PDF Version (389 KB)
Anne K. Driscoll, Ph.D., and Michelle J.K. Osterman, M.H.S.
Key findings
Data from the National Vital Statistics System
- Four in 10 women (39.6%) who gave birth in the United States in 2016 received prenatal benefits from the Special Supplemental Nutrition Program for Women, Infants, and Children (WIC).
- Rates of prenatal WIC receipt declined with increasing maternal age for women
under 40. - Among the six race and Hispanic-origin groups, receipt of prenatal WIC was highest for Hispanic mothers (61.4%) and lowest for non-Hispanic Asian mothers (23.2%).
- Receipt of prenatal WIC decreased as maternal education level increased.
The Special Supplemental Nutrition Program for Women, Infants, and Children (WIC) seeks to improve fetal development and reduce the incidence of low birth weight, preterm birth, and maternal anemia through intervention during pregnancy (1). Prenatal WIC receipt is associated with lower infant mortality and stronger cognitive development among toddlers and children (2,3). All states and the District of Columbia reported information on maternal receipt of WIC food during pregnancy on the birth certificate for the first time in 2016 based on the question, “Did you receive WIC food for yourself because you were pregnant with this child?” This report describes prenatal WIC receipt in the United States in 2016 by state and by maternal age, race and Hispanic origin, and education.
Keywords: maternal education, maternal age, National Vital Statistics System
Prenatal WIC receipt rates varied by state in 2016.
- Four in 10 women who gave birth in 2016 received prenatal WIC benefits (39.6%) (Figure 1).
- At least one in five mothers received prenatal WIC benefits in every state and the District of Columbia, ranging from 21.2% in Utah to 52.2% in Alabama.
- In four states, less than one-quarter of women received prenatal WIC benefits: Utah (21.2%), New Hampshire (22.2%), North Dakota (22.7%), and New Jersey (23.8%). In three states, more than one-half of women received prenatal WIC benefits: Alabama (52.2%), Arkansas (51.0%), and Mississippi (50.1%).
Figure 1. Prenatal WIC receipt, by state: United States, 2016
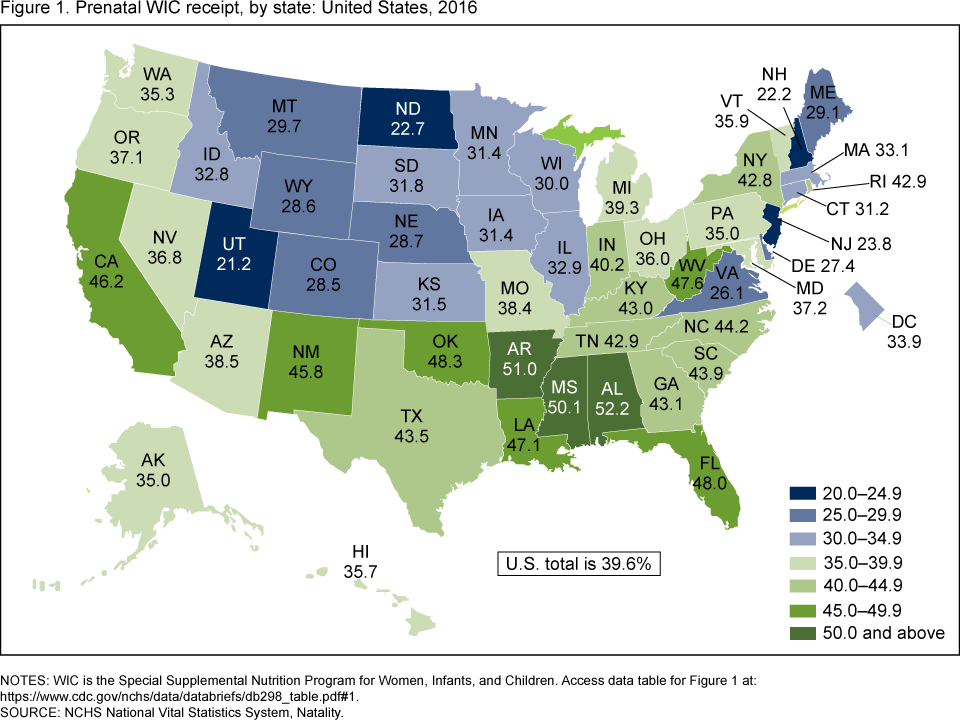
NOTES: WIC is the Special Supplemental Nutrition Program for Women, Infants, and Children. Access data table for Figure 1.
SOURCE: NCHS National Vital Statistics System, Natality.
In 2016, prenatal WIC receipt rates declined as maternal age increased for women under age 40.
- Prenatal WIC receipt rates declined with increasing age for mothers under age 40, from 74.4% of mothers under age 20 to 25.9% of mothers aged 35–39 (Figure 2).
- Prenatal WIC receipt rates were higher among women aged 40 and over (28.3%) than among women in their 30s (26.5% of women aged 30–34 and 25.9% of women aged 35–39), but they were lower than for women under age 30.
Figure 2. Prenatal WIC receipt, by maternal age group: United States, 2016
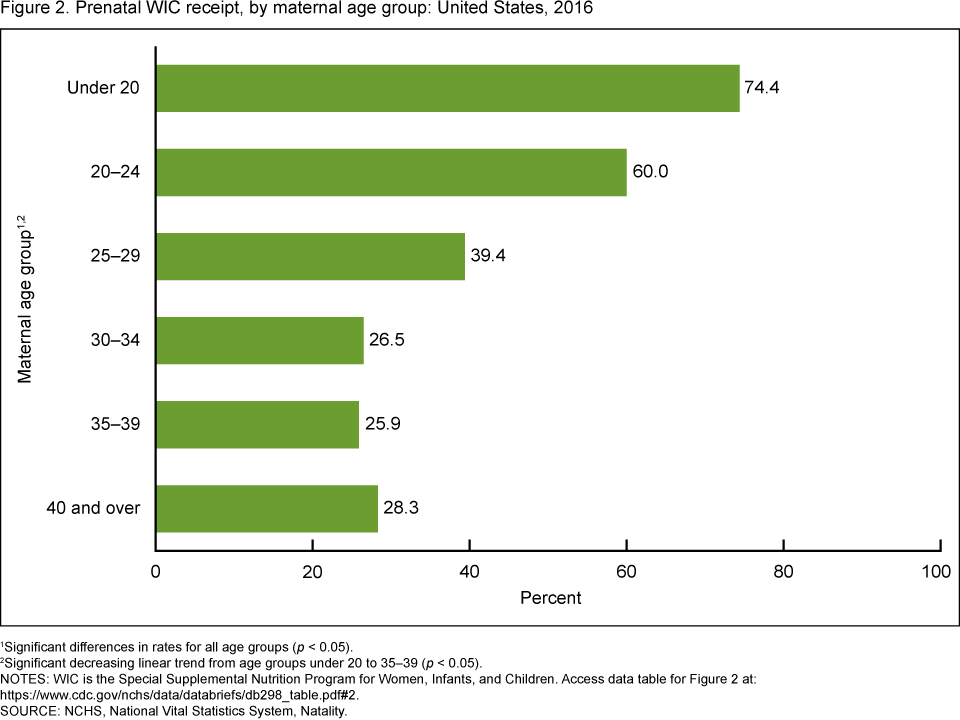
1Significant differences in rates for all age groups (p < 0.05).
2Significant decreasing linear trend from age groups under 20 to 35–39 (p < 0.05).
NOTES: WIC is the Special Supplemental Nutrition Program for Women, Infants, and Children. Access data table for Figure 2.
SOURCE: NCHS, National Vital Statistics System, Natality.
Prenatal WIC receipt rates varied by race and Hispanic origin in 2016.
- Rates of prenatal WIC receipt were highest among Hispanic (61.4%), non-Hispanic black (59.6%), and non-Hispanic American Indian or Alaska Native (AIAN) (58.3%) mothers (Figure 3).
- The prenatal WIC receipt rate was next highest among non-Hispanic Native Hawaiian or Other Pacific Islander mothers (48.2%).
- Non-Hispanic Asian women had the lowest rate of prenatal WIC receipt (23.2%), followed by non-Hispanic white women (26.2%).
Figure 3. Prenatal WIC receipt, by maternal race and Hispanic origin: United States, 2016
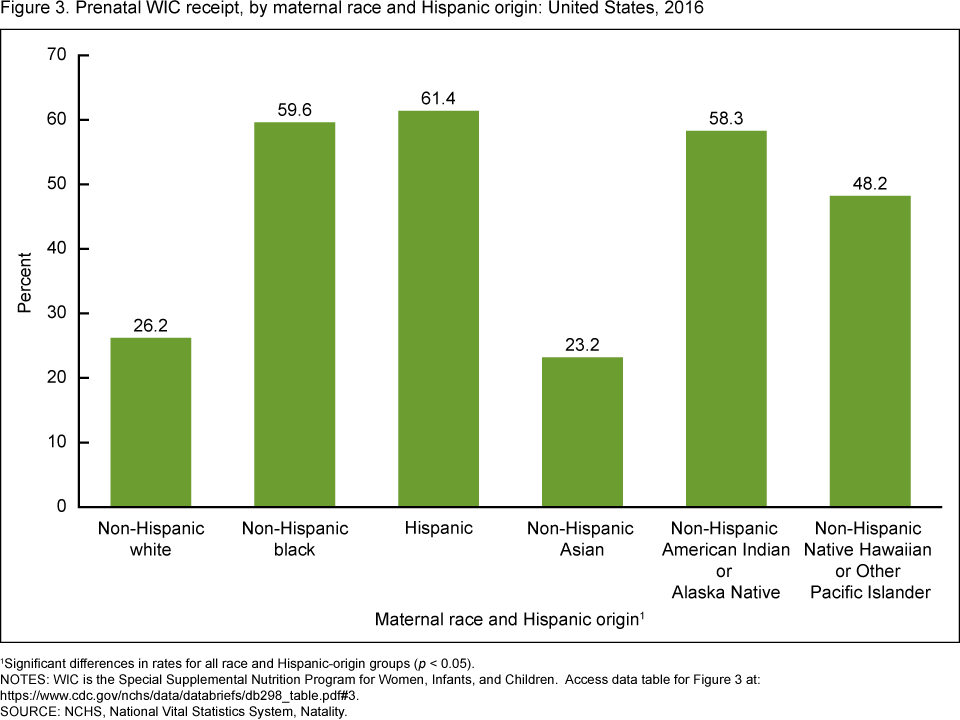
1Significant differences in rates for all race and Hispanic-origin groups (p < 0.05).
NOTES: WIC is the Special Supplemental Nutrition Program for Women, Infants, and Children. Access data table for Figure 3.
SOURCE: NCHS, National Vital Statistics System, Natality.
In 2016, prenatal WIC receipt rates were lower for mothers with higher educational attainment.
- Prenatal WIC receipt rates declined with increasing education.
- Prenatal WIC receipt rates declined from 69.9% among women with no high school diploma to 4.9% among those who had a master’s degree or higher (Figure 4).
Figure 4. Prenatal WIC receipt, by maternal education: United States, 2016
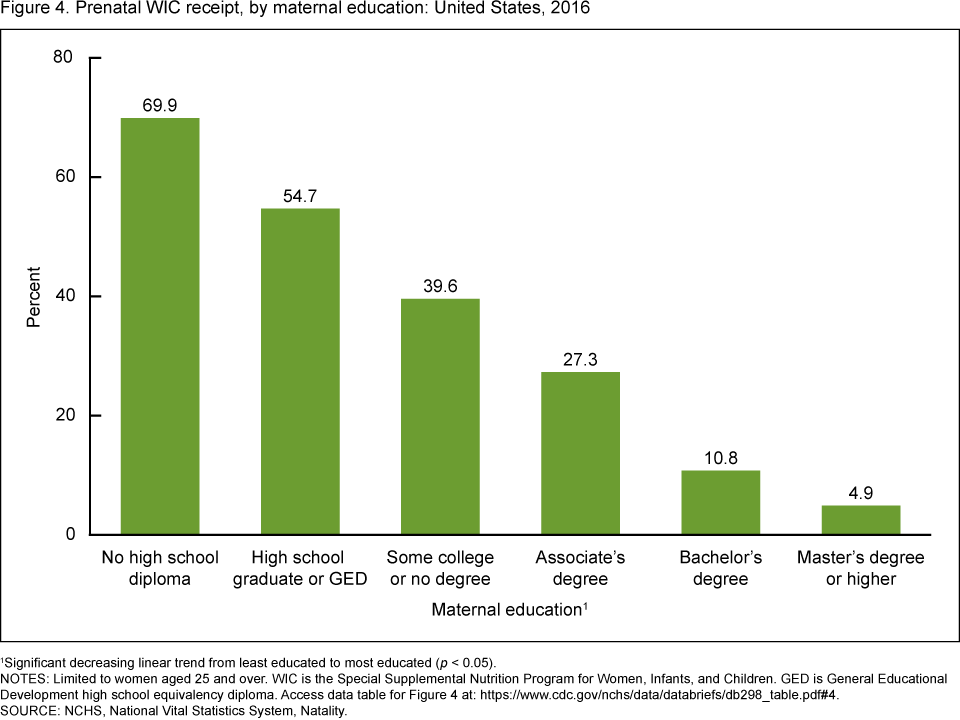
1Significant decreasing linear trend from least educated to most educated (p < 0.05).
NOTES: Limited to women aged 25 and over. WIC is the Special Supplemental Nutrition Program for Women, Infants, and Children. GED is General Educational Development high school equivalency diploma. Access data table for Figure 4.
SOURCE: NCHS, National Vital Statistics System, Natality.
Summary
Eligibility for participation by pregnant women in the WIC Program is determined by household poverty status; only those with household incomes below 185% of the federal poverty line are eligible (1). The 2016 birth file is the first to include national data on receipt of WIC food during pregnancy. Nationwide, 4 in 10 women received WIC benefits while pregnant (39.6%). At the state level, prenatal WIC receipt rates ranged from 21.2% in Utah to 52.2% in Alabama. Among the six maternal age groups, the prenatal WIC receipt rate in 2016 was highest for women under age 20. Women with less education had higher rates than those with more education. Hispanic, non-Hispanic black, and AIAN women had higher rates than those in other race and Hispanic-origin groups. A forthcoming report from the National Center for Health Statistics will present detailed information on this new birth certificate item.
Definitions
Maternal education: Analyses are restricted to women aged 25 and over to allow for completion of education.
Prenatal WIC: Measure from information on the 2003 U.S. Standard Certificate of Live Birth based on the question, “Did you receive WIC food for yourself because you were pregnant with this child? (Yes/No)” (4).
Prenatal WIC receipt rate: Number of women who received prenatal WIC divided by the total number of women who gave birth, multiplied by 100.
Race and Hispanic origin: Race and Hispanic origin are reported separately on birth certificates. Data shown by Hispanic origin include all persons of Hispanic origin of any race. Data for non-Hispanic persons are shown separately for each single-race group. The 2003 revision of the U.S. Standard Certificate of Live Birth allows the reporting of five race categories. The response of those who reported more than one race have been “bridged” to one single race.
Special Supplemental Nutrition Program for Women, Infants, and Children (WIC): Serves low-income persons who are at risk nutritionally. Eligibility is based on income and population category. The categories include pregnant women, breastfeeding women and nonbreastfeeding postpartum women, and infants and children up to their fifth birthday. Household income must be below 185% of the federal poverty line. WIC provides supplemental nutritious foods, nutrition education and counseling at WIC clinics, and screening and referrals to other health, welfare, and social services for participants (1).
Data source and methods
Data are from the 2016 natality data set, from the National Vital Statistics System. The vital statistics natality file is based on information derived from birth certificates and includes information for all births occurring in the United States. References to comparisons indicate differences that are statistically significant at the 0.05 level using a z test for difference of proportions and a Cochran-Armitage test for linear trend. Computations exclude records for which information is unknown. Prenatal WIC participation was unknown for 1.3% of records.
About the authors
Anne K. Driscoll and Michelle J.K. Osterman are with the National Center for Health Statistics, Division of Vital Statistics, Reproductive Statistics Branch.
References
- Thorn B, Tadler C, Huret N, Ayo E, Trippe C, Mendelson M, et al. WIC participant and program characteristics 2014: Final report. 2015.
- Khanani I, Elam J, Hearn R, Jones C, Maseru N. The impact of prenatal WIC participation on infant mortality and racial disparities. Am J Public Health 100 Suppl 1:S204–9. 2010.
- Jackson MI. Early childhood WIC participation, cognitive development and academic achievement. Soc Sci Med126:145–53. 2015.
- National Center for Health Statistics. 2003 revision of the U.S. Standard Certificate of Live Birth. 2003.
Suggested citation
Driscoll AK, Osterman MJK. Maternal characteristics of prenatal WIC participation in the United States, 2016. NCHS Data Brief, no 298. Hyattsville, MD: National Center for Health Statistics. 2018.
Copyright information
All material appearing in this report is in the public domain and may be reproduced or copied without permission; citation as to source, however, is appreciated.
National Center for Health Statistics
Charles J. Rothwell, M.S., M.B.A., Director
Jennifer H. Madans, Ph.D., Associate Director for Science
Division of Vital Statistics
Delton Atkinson, M.P.H., M.P.H., P.M.P., Director
Hanyu Ni, Ph.D., M.P.H., Associate Director for Science