Emergency Department Visits for Injury and Illness Among Adults Aged 65 and Over: United States, 2012–2013
- Key findings
- What were the ED visit rates for injury and illness among older adults, and did these rates vary by age?
- Did ED visit rates for injury and illness in older adults vary by sex?
- Among older adults, did arrival by ambulance and hospital admission differ for ED visits for injury compared with ED visits for illness?
- Among older adults, did the percentage of imaging tests differ for ED visits for injury compared with ED visits for illness?
- Summary
- Definitions
- Data source and methods
- About the authors
- References
- Suggested citation
NCHS Data Brief No. 272, February 2017
PDF Version (397 KB)
Michael Albert, M.D., M.P.H., Pinyao Rui, M.P.H., and Linda F. McCaig, M.P.H.
Key findings
Data from the National Hospital Ambulatory Medical Care Survey
- During 2012–2013, adults aged 65 and over had an emergency department (ED) visit rate of 12 per 100 persons for injury and 36 per 100 persons for illness.
- Among adults aged 65 and over, women had a higher ED visit rate for injury (14 per 100 women) compared with men (10 per 100 men).There was no difference between women and men in the visit rate for illness.
- The percentage of injury visits resulting in hospital admission (17%) was lower than for illness visits (32%) among adults aged 65 and over. The same pattern held for critical care admissions
(2% compared with 5%). - Imaging was ordered at 75% of injury visits among adults aged 65 and over, which was higher than for illness visits (63%).
The percentage of the U.S. population aged 65 and over has grown, and it is projected to continue rising, from 14% in 2012 to 20% in 2030 (1). The emergency department (ED) plays a critical role in treating acute medical problems in older adults, and injury visits make up an important subset of this care (2). This report utilizes nationally representative data from the National Hospital Ambulatory Medical Care Survey (NHAMCS) to describe and compare characteristics of ED visits resulting from injury and illness in older patients.
Keywords: older adults, National Hospital Ambulatory Medical Care Survey
What were the ED visit rates for injury and illness among older adults, and did these rates vary by age?
- The ED visit rate among adults aged 65 and over was 12 per 100 persons for injury and 36 per 100 persons for illness (Figure 1).
- Both injury and illness visit rates increased with age. Adults aged 85 and over had the highest visit rates (25 per 100 persons for injury and 57 per 100 persons for illness), and adults aged 65–74 had the lowest visit rates (9 per 100 persons for injury and 29 per 100 persons for illness).
Figure 1. Emergency department visit rates for injury and illness among adults aged 65 and over, by age: United States, 2012–2013
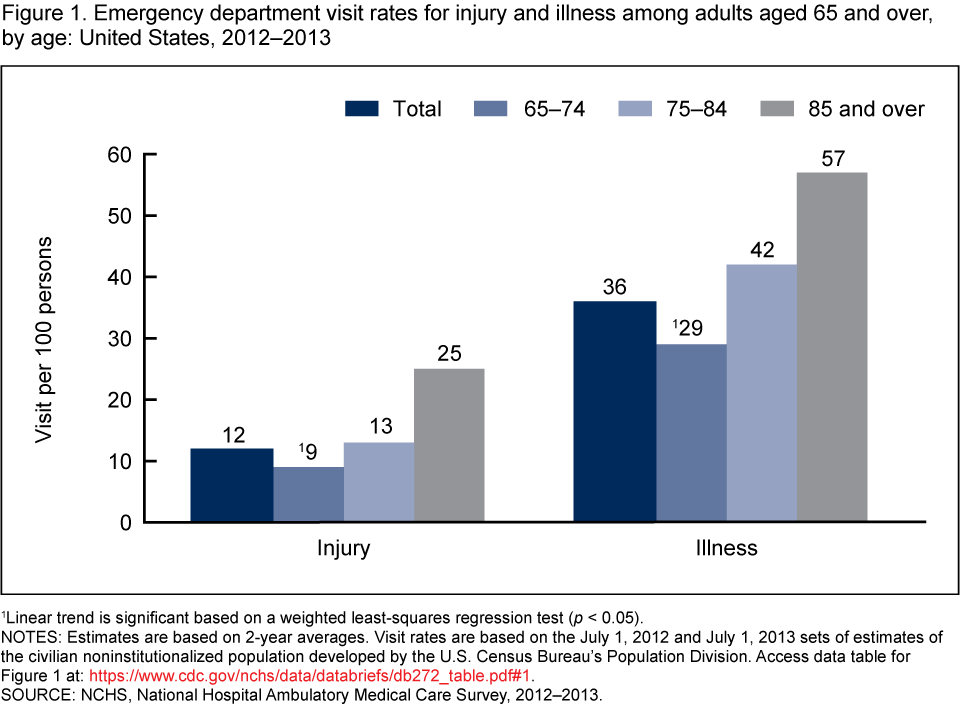
1Linear trend is significant based on a weighted least-squares regression test (p < 0.05).
NOTES: Estimates are based on 2-year averages. Visit rates are based on the July 1, 2012 and July 1, 2013 sets of estimates of the civilian noninstitutionalized population developed by the U.S. Census Bureau’s Population Division. Access data table for Figure 1.
SOURCE: NCHS, National Hospital Ambulatory Medical Care Survey, 2012–2013.
Did ED visit rates for injury and illness in older adults vary by sex?
- Women aged 65 and over had a higher ED visit rate for injury (14 per 100 women) compared with men (10 per 100 men) (Figure 2).
- The ED visit rate for illness did not differ between men (36 per 100 men) and women (37 per 100 women) aged 65 and over.
Figure 2. Emergency department visit rates for injury and illness among adults aged 65 and over, by sex: United States, 2012–2013
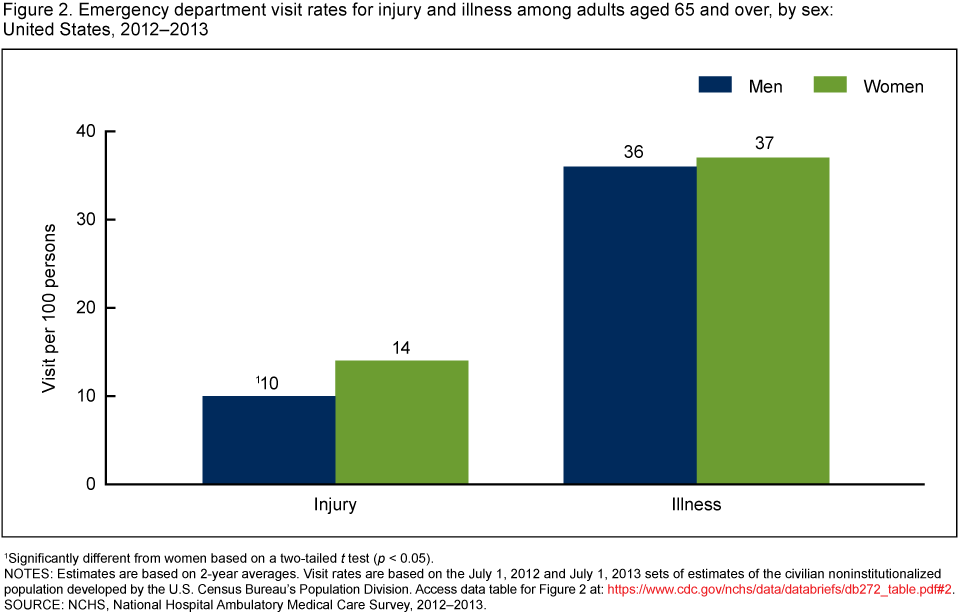
1Significantly different from women based on a two-tailed t test (p < 0.05).
NOTES: Estimates are based on 2-year averages. Visit rates are based on the July 1, 2012 and July 1, 2013 sets of estimates of the civilian noninstitutionalized population developed by the U.S. Census Bureau’s Population Division. Access data table for Figure 2.
SOURCE: NCHS, National Hospital Ambulatory Medical Care Survey, 2012–2013.
Among older adults, did arrival by ambulance and hospital admission differ for ED visits for injury compared with ED visits for illness?
- Among ED visits made by adults aged 65 and over, the percentage arriving by ambulance was higher for injury visits (39%) compared with illness visits (32%) (Figure 3).
- The percentage of injury visits resulting in hospital admission (17%) was lower compared with illness visits (32%).
- The percentage of injury visits resulting in admission to the critical care unit (2%) was lower compared with illness visits (5%).
Figure 3. Percentage of emergency department visits for injury and illness among adults aged 65 and over, by ambulance arrival and hospital admission: United States, 2012–2013
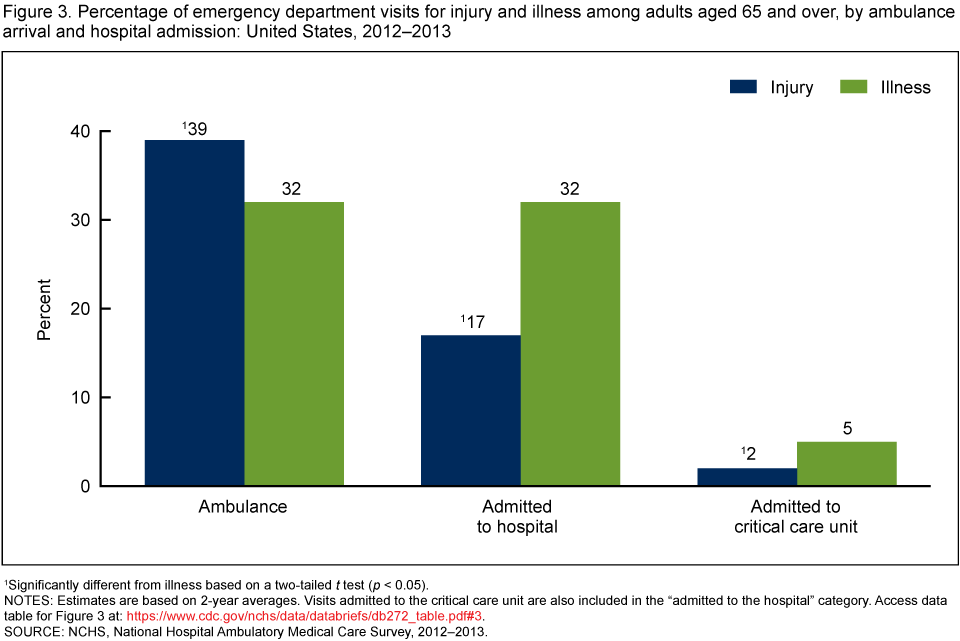
1Significantly different from illness based on a two-tailed t test (p < 0.05).
NOTES: Estimates are based on 2-year averages. Visits admitted to the critical care unit are also included in the “admitted to the hospital” category. Access data table for Figure 3.
SOURCE: NCHS, National Hospital Ambulatory Medical Care Survey, 2012–2013.
Among older adults, did the percentage of imaging tests differ for ED visits for injury compared with ED visits for illness?
- Imaging was ordered at 75% of injury visits made by adults aged 65 and over, which was higher than for illness visits (63%) (Figure 4).
- Compared with illness visits, a higher percentage of x-rays and computerized tomography (CT) scans were ordered for injury visits, whereas a lower percentage of other imaging tests (i.e., magnetic resonance imaging, ultrasound, or other) were ordered for injury visits.
Figure 4. Percentage of emergency department visits for injury and illness among adults aged 65 and over, by type of imaging test ordered or provided: United States, 2012–2013
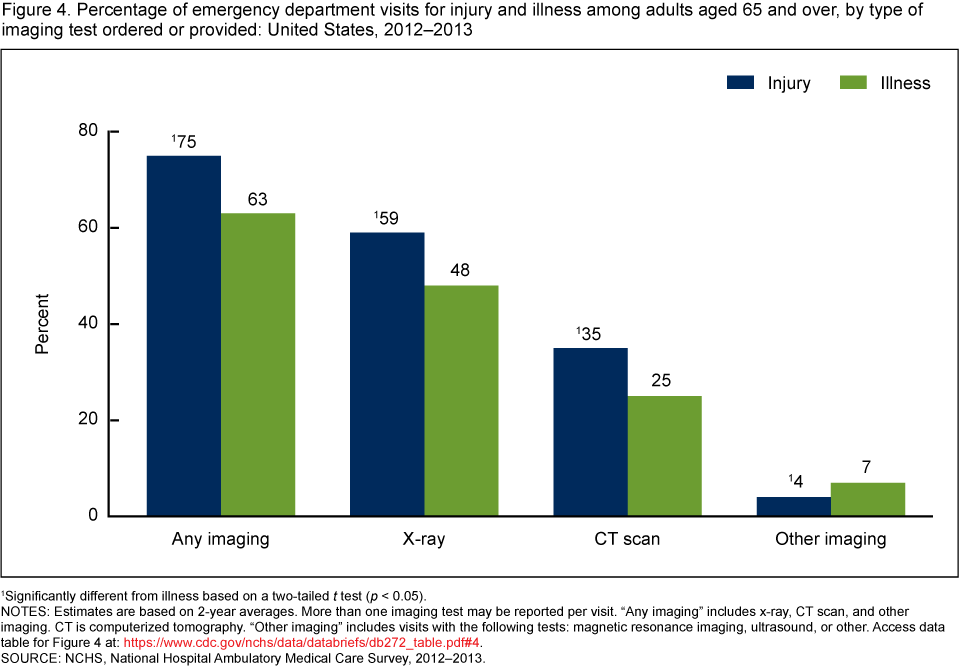
1Significantly different from illness based on a two-tailed t test (p < 0.05).
NOTES: Estimates are based on 2-year averages. More than one imaging test may be reported per visit. “Any imaging” includes x-ray, CT scan, and other imaging. CT is computerized tomography. “Other imaging” includes visits with the following tests: magnetic resonance imaging, ultrasound, or other. Access data table for Figure 4.
SOURCE: NCHS, National Hospital Ambulatory Medical Care Survey, 2012–2013.
Summary
Differences in the characteristics and resource utilization of ED visits made by older adults for injury compared with illness were identified in this analysis. During 2012–2013, there was an estimated annual average of 5.2 million ED visits for injury and 15.5 million ED visits for illness among adults aged 65 and over. Visits by adults aged 65 and over comprised 15.9% of total ED visits—14.0% of injury visits and 16.7% of illness visits. The visit rates for injury and illness increased with age. Women had a higher injury ED visit rate than men, although a difference was not observed for illness ED visit rates between these groups. Injury visits were associated with a higher percentage of imaging tests and patients who arrived by ambulance compared with illness visits. However, injury visits were less likely than illness visits to result in hospital admission, including admission to a critical care unit. Differences observed in ED utilization by older adults for injury and illness are informative for policymakers.
Definitions
Injury-related visit: A visit in which a first-, second-, or third-listed external cause of injury or first-, second-, or third-listed reason for visit or diagnosis code that is injury- or poison-related was recorded. Unintentional as well as intentional injuries were included. External cause-of-injury codes related to adverse effects and medical and surgical complications were all excluded; however, if these codes were present in combination with other valid definitional codes, the visit was considered injury related. Diagnosis and external cause of injury were coded using the International Classification of Diseases, Ninth Revision, Clinical Modification (3).
Illness visit: Any visit not meeting the definition of an injury-related visit.
Data source and methods
Data are from the Emergency Department component of the 2012–2013 NHAMCS, a nationally representative survey of nonfederal, general, and short-stay hospitals that is conducted annually by the National Center for Health Statistics. NHAMCS uses a multistage probability design with samples of geographic primary sampling units (PSUs), hospitals within PSUs, and patient visits within EDs. Data were collected on approximately 30,000 ED visits in 2012 and 25,000 visits in 2013. During 2012–2013, a sample of 8,538 visits were made by patients aged 65 and over. Data were imputed for patient birth year (0.3%) and sex (0.8%). Detailed information on the methodology of NHAMCS, including changes to the survey beginning in 2012, is available elsewhere (4,5).
Data analyses were performed using the statistical packages SAS version 9.4 (SAS Institute, Cary, N.C.) and SAS-callable SUDAAN version 11.0 (RTI International, Research Triangle Park, N.C.). Differences among subgroups were evaluated using a two-tailed t test (p < 0.05). A weighted least-squares regression analysis was used to test for linear trends by age group (p < 0.05).
About the authors
Michael Albert and Linda F. McCaig are with the National Center for Health Statistics, Division of Health Care Statistics, Ambulatory and Hospital Care Statistics Branch. Pinyao Rui is with Karna, LLC.
References
- Ortman JM, Velkoff VA, Hogan H. An aging nation: The older population in the United States. U.S. Census Bureau, Current Population Reports, P25–1140. Washington, DC. 2014.
- Hwang U, Morrison RS. The geriatric emergency department. J Am Geriatr Soc 55(11): 1873–6. 2007.
- Centers for Disease Control and Prevention, Centers for Medicare & Medicaid Services. International classification of diseases, ninth revision, clinical modification. 6th ed. DHHS Pub No. (PHS) 11–1260. 2011.
- National Center for Health Statistics. 2012 NHAMCS micro-data file documentation. 2015.
- National Center for Health Statistics. 2013 NHAMCS micro-data file documentation. 2016.
Suggested citation
Albert M, Rui P, McCaig LF. Emergency department visits for injury and illness among adults aged 65 and over: United States, 2012–2013. NCHS data brief, no 272. Hyattsville, MD: National Center for Health Statistics. 2017.
Copyright information
All material appearing in this report is in the public domain and may be reproduced or copied without permission; citation as to source, however, is appreciated.
National Center for Health Statistics
Charles J. Rothwell, M.S., M.B.A., Director
Jennifer H. Madans, Ph.D., Associate Director for Science
Division of Health Care Statistics
Denys T. Lau, Ph.D., Acting Director
Alexander Strashny, Ph.D., Associate Director for Science