Sugar-sweetened Beverage Consumption Among U.S. Youth, 2011–2014
- Key findings
- Almost two-thirds of U.S. youth consumed at least one sugar-sweetened beverage on a given day.
- For both boys and girls, calories consumed from sugar-sweetened beverages on a given day increased with age.
- Calories consumed from sugar-sweetened beverages differed by race and Hispanic origin for both boys and girls.
- The percentage of total daily calories consumed from sugar-sweetened beverages increased with age for both boys and girls.
- The percentage of total daily calories consumed from sugar-sweetened beverages differed by race and Hispanic origin for boys and girls.
- Summary
- Definitions
- Data source and methods
- About the authors
- References
- Suggested citation
NCHS Data Brief No. 271, January 2017
PDF Version (423 KB)
Asher Rosinger, Ph.D., M.P.H.; Kirsten Herrick, Ph.D., M.Sc.; Jaime Gahche, M.P.H.; and Sohyun Park, Ph.D.
Key findings
Data from the National Health and Nutrition Examination Survey
- Almost two-thirds of boys and girls consumed at least one sugar-sweetened beverage on a given day.
- Boys consumed an average 164 kilocalories (kcal) from sugar-sweetened beverages, which contributed 7.3% of total daily caloric intake. Girls consumed an average 121 kcal from sugar-sweetened beverages, which contributed 7.2% of total daily caloric intake.
- Among both boys and girls, older youth had the highest mean intake and percentage of daily calories from sugar-sweetened beverages relative to younger children.
- Non-Hispanic Asian boys and girls consumed the least calories and the lowest percentage of total calories from sugar-sweetened beverages compared with non-Hispanic white, non-Hispanic black, and Hispanic boys and girls.
Sugar-sweetened beverages contribute calories and added sugars to the diets of U.S. children (1). Studies have suggested a link between the consumption of sugar-sweetened beverages and dental caries, weight gain, type 2 diabetes, dyslipidemia, and nonalcoholic fatty liver disease in children (2–6). The 2015–2020 Dietary Guidelines for Americans recommend reducing added sugars consumption to less than 10% of calories per day and, specifically, to choose beverages with no added sugars (1). This report presents results for consumption of sugar-sweetened beverages among U.S. youth aged 2–19 years for 2011–2014 by sex, age, and race and Hispanic origin.
Keywords: National Health and Nutrition Examination Survey, NHANES, calories, kcal
Almost two-thirds of U.S. youth consumed at least one sugar-sweetened beverage on a given day.
- During 2011–2014, 62.9% of youth consumed at least one sugar-sweetened beverage on a given day (Figure 1).
- A higher percentage of boys (64.5%) than girls (61.3%) consumed at least one sugar-sweetened beverage. Differences between boys and girls in the consumption of one, two, or three beverages or more were not significant.
- For boys, 32.7% consumed one sugar-sweetened beverage, 20.2% consumed two sugar-sweetened beverages, while 11.5% consumed three or more on a given day.
- Among girls, 33.7% consumed one sugar-sweetened beverage, 18.1% consumed two sugar-sweetened beverages, and 9.5% consumed three or more on a given day.
Figure 1. Percentage of youth aged 2–19 years who consumed sugar-sweetened beverages on a given day, by number of beverages and sex: United States, 2011–2014
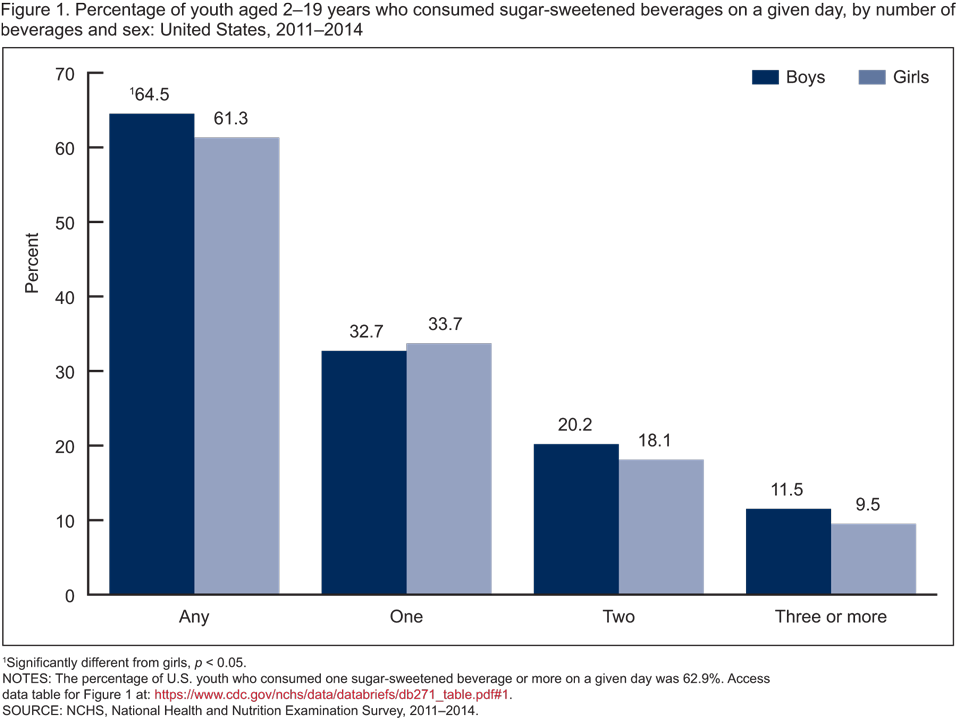
1Significantly different from girls, p < 0.05.
NOTES: The percentage of U.S. youth who consumed one sugar-sweetened beverage or more on a given day was 62.9%. Access data table for Figure 1.
SOURCE: NCHS, National Health and Nutrition Examination Survey, 2011–2014.
For both boys and girls, calories consumed from sugar-sweetened beverages on a given day increased with age.
- Overall, youth aged 2–19 consumed an average 143 kcal from sugar-sweetened beverages on a given day during 2011–2014. Boys consumed more calories from sugar-sweetened beverages (164 kcal) than girls (121 kcal) (Figure 2).
- Boys consumed more calories from sugar-sweetened beverages compared with girls across all age groups, with the exception of those aged 2–5 where the difference was not statistically significant.
- Mean total calories consumed from sugar-sweetened beverages on a given day increased with age among U.S. boys and girls.
- Boys aged 2–5 consumed 65 kcal, boys aged 6–11 consumed 133 kcal, and boys aged 12–19 consumed 232 kcal from sugar-sweetened beverages.
- Girls aged 2–5 consumed 59 kcal, girls aged 6–11 consumed 104 kcal, and girls aged 12–19 consumed 162 kcal from sugar-sweetened beverages.
Figure 2. Mean kilocalories from sugar-sweetened beverages on a given day for youth aged 2–19 years, by sex and age: United States, 2011–2014
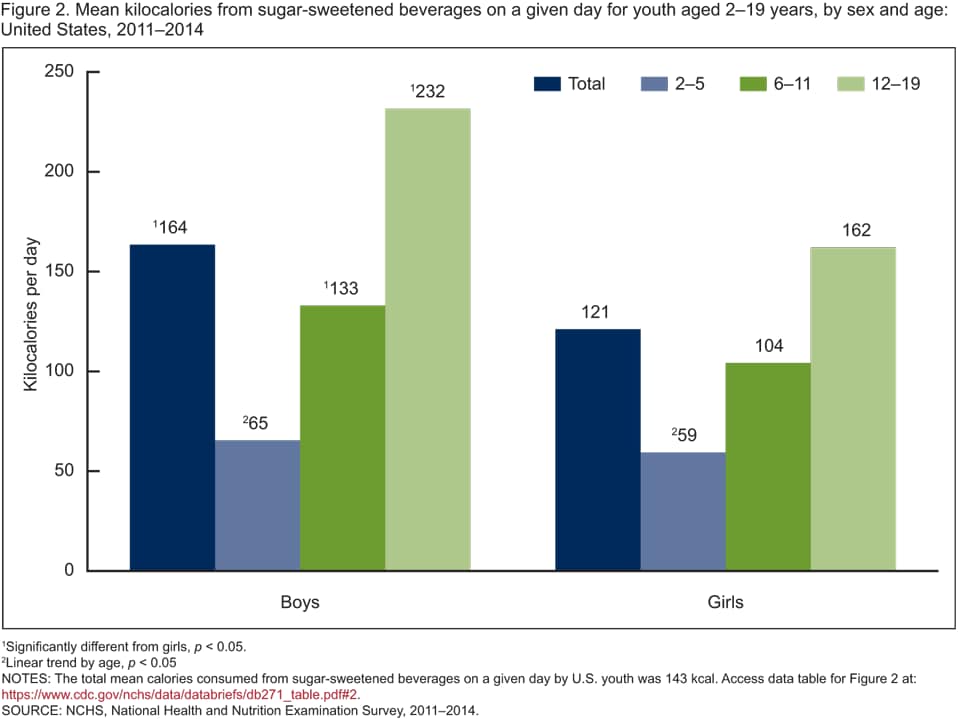
1Significantly different from girls, p < 0.05.
2Linear trend by age, p < 0.05
NOTES: The total mean calories consumed from sugar-sweetened beverages on a given day by U.S. youth was 143 kcal. Access data table for Figure 2.
SOURCE: NCHS, National Health and Nutrition Examination Survey, 2011–2014.
Calories consumed from sugar-sweetened beverages differed by race and Hispanic origin for both boys and girls.
- Among boys, non-Hispanic white (176 kcal), non-Hispanic black (167 kcal), and Hispanic (156 kcal) boys had higher mean calorie intake from sugar-sweetened beverages on a given day than non-Hispanic Asian boys (73 kcal) (Figure 3).
- Non-Hispanic black girls had the highest calorie intake from sugar-sweetened beverages at 156 kcal, followed by non-Hispanic white (124 kcal), Hispanic (115 kcal), and non-Hispanic Asian (58 kcal) girls.
- Non-Hispanic white and Hispanic boys had higher mean calorie intake from sugar-sweetened beverages than non-Hispanic white and Hispanic girls.
Figure 3. Mean kilocalories from sugar-sweetened beverages on a given day for youth aged 2–19 years, by sex and race and Hispanic origin: United States, 2011–2014
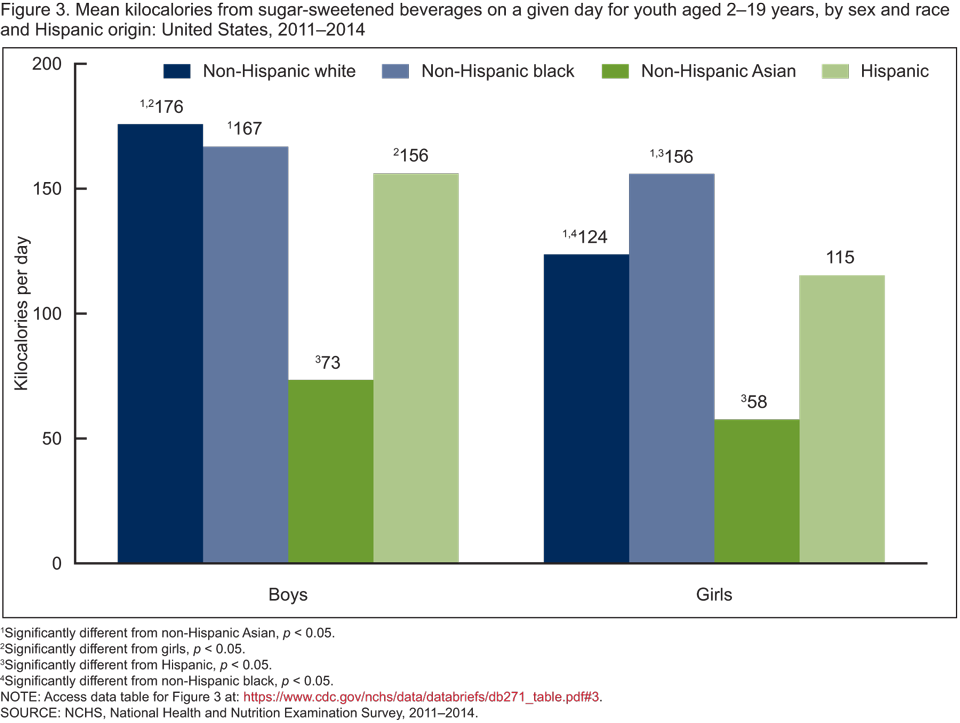
1Significantly different from non-Hispanic Asian, p < 0.05.
2Significantly different from girls, p < 0.05.
3Significantly different from Hispanic, p < 0.05.
4Significantly different from non-Hispanic black, p < 0.05.
NOTE: Access data table for Figure 3.
SOURCE: NCHS, National Health and Nutrition Examination Survey, 2011–2014.
The percentage of total daily calories consumed from sugar-sweetened beverages increased with age for both boys and girls.
- U.S. youth consumed an average 7.3% of their total daily calories from sugar-sweetened beverages. Overall and in each age group, boys and girls consumed a similar percentage of total calories from sugar-sweetened beverages (Figure 4).
- Among both boys and girls, the percentage of calories consumed from sugar-sweetened beverages significantly increased with increasing age.
- Sugar-sweetened beverages contributed 4.1% of total daily calories consumed for boys aged 2–5, 6.6% for boys aged 6–11, and 9.3% for boys aged 12–19.
- Similarly, sugar-sweetened beverages contributed 4.0% of total daily calories consumed for girls aged 2–5, 5.8% for girls aged 6–11, and 9.7% for girls aged 12–19.
Figure 4. Mean percentage of total daily kilocalories consumed from sugar-sweetened beverages on a given day by youth aged 2–19 years, by sex and age: United States, 2011–2014
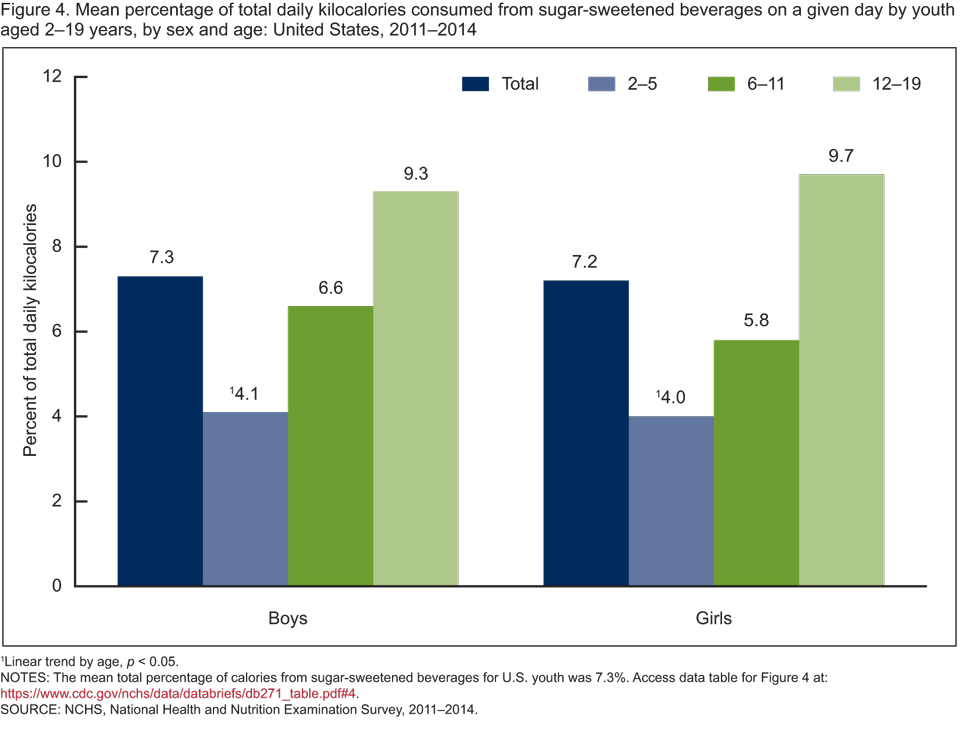
1Linear trend by age, p < 0.05.
NOTES: The mean total percentage of calories from sugar-sweetened beverages for U.S. youth was 7.3%. Access data table for Figure 4.
SOURCE: NCHS, National Health and Nutrition Examination Survey, 2011–2014.
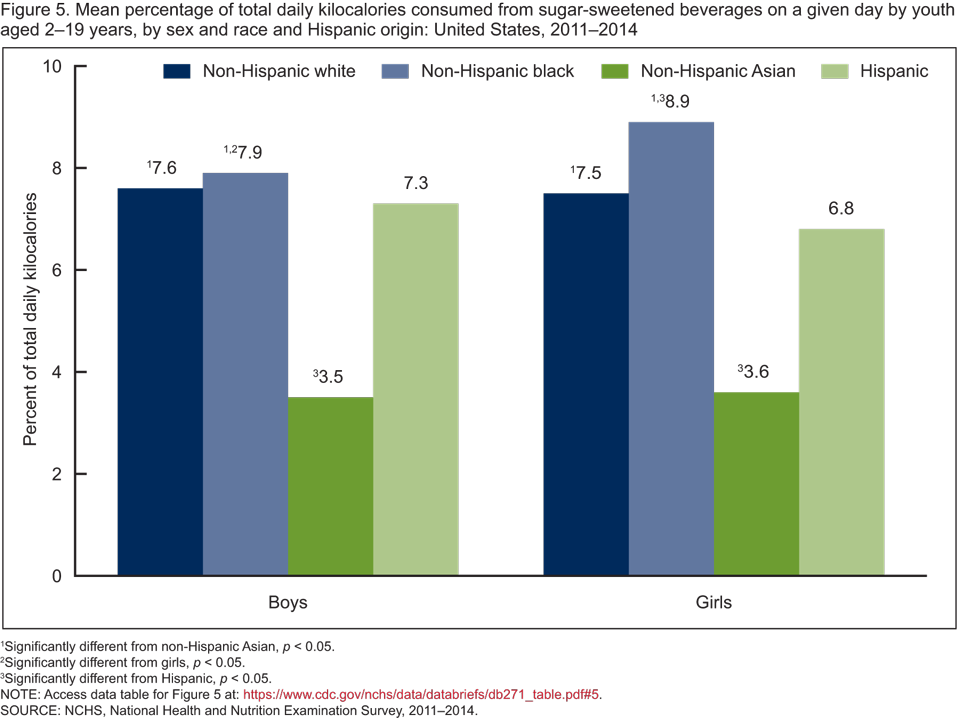
The percentage of total daily calories consumed from sugar-sweetened beverages differed by race and Hispanic origin for boys and girls.
- The percentage of total daily calories from sugar-sweetened beverages was similar for non-Hispanic black (7.9%), non-Hispanic white (7.6%), and Hispanic (7.3%) boys, all of which were higher than for non-Hispanic Asian boys (3.5%) (Figure 5).
- Non-Hispanic black (8.9%), non-Hispanic white (7.5%), and Hispanic (6.8%) girls all consumed a higher percentage of total daily calories from sugar-sweetened beverages than non-Hispanic Asian (3.6%) girls, while non-Hispanic black girls also consumed a significantly higher percentage than Hispanic girls.
- Non-Hispanic black girls (8.9%) consumed a significantly higher percentage of total daily calories from sugar-sweetened beverages than non-Hispanic black boys (7.9%).
Figure 5. Mean percentage of total daily kilocalories consumed from sugar-sweetened beverages on a given day by youth aged 2–19 years, by sex and race and Hispanic origin: United States, 2011–2014
1Significantly different from non-Hispanic Asian, p < 0.05.
2Significantly different from girls, p < 0.05.
3Significantly different from Hispanic, p < 0.05.
NOTE: Access data table for Figure 5.
SOURCE: NCHS, National Health and Nutrition Examination Survey, 2011–2014.
Summary
Among U.S. youth aged 2–19 years, 64.5% of boys and 61.3% of girls consumed at least one sugar-sweetened beverage on a given day during 2011–2014. Overall, U.S. youth consumed an average 143 kcal from sugar-sweetened beverages, and 7.3% of their daily energy intake came from sugar-sweetened beverages. Mean caloric intake from sugar-sweetened beverages was 164 kcal for boys, which made up 7.3% of their total daily calories. Girls consumed 121 kcal from sugar-sweetened beverages, contributing 7.2% of their total daily calories. Among both boys and girls, mean calories consumed from sugar-sweetened beverages and the percentage of total calories consumed from sugar-sweetened beverages on a given day increased with age, with those aged 12–19 having the highest intakes.
Non-Hispanic white, non-Hispanic black, and Hispanic boys consumed a similar amount of calories and had a similar percentage of total calories from sugar-sweetened beverages. Among girls, non-Hispanic black girls had the highest calorie intake and the highest percentage of total calories consumed from sugar-sweetened beverages. Non-Hispanic Asian boys and girls consumed the least calories and had the lowest mean percentage of total calories consumed from sugar-sweetened beverages on a given day compared with other race and Hispanic-origin groups.
Definitions
Sugar-sweetened beverage: For this report, sugar-sweetened beverages include regular soda, fruit drinks (including sweetened bottled waters and fruit juices and nectars with added sugars), sports and energy drinks, sweetened coffees and teas, and other sugar-sweetened beverages (including horchata and sugarcane beverages). Sugar-sweetened beverages do not include diet drinks (defined as less than 40 kcal/240 mL of the beverage); 100% fruit juice; beverages sweetened by the participant, including coffee and teas; alcohol; or flavored milks. This definition is consistent with previous reports (7).
Calorie, kilocalorie (kcal): A measure representing dietary energy intake (1). Calorie is usually used when discussing energy from foods and diets. In this report, the term calories in the text denotes kilocalories.
Data source and methods
Data from the National Health and Nutrition Examination Survey (NHANES) for survey years 2011–2012 and 2013–2014 were used for this analysis. NHANES is a cross-sectional survey, designed to monitor the health and nutritional status of the civilian noninstitutionalized U.S. population (8). The survey combines interviews conducted in the participants’ homes and standardized physical examinations conducted in the mobile examination centers (MECs). For this report, data were collected through an in-person 24-hour dietary recall interview, which covers intake during the day (24 hours, midnight to midnight) prior to the standardized physical examination in the MEC (9).
The NHANES sample is selected through a complex, multistage probability design. In 2011–2012 and 2013–2014, non-Hispanic black, non-Hispanic Asian, and Hispanic persons, among other groups, were oversampled to obtain reliable estimates for these population subgroups. Race and Hispanic-origin categories reflect individuals reporting only one race; those reporting “other” races and more than one race are included in the total but are not reported separately.
Data were analyzed using the day one dietary sample weights to account for the days of the week, differential probabilities of selection, nonresponse, and noncoverage. The standard errors of means and percentages were estimated using Taylor series linearization, a method that incorporates the sample design and sample weights. Differences between groups were evaluated using a univariate t statistic at the p < 0.05 significance level. Tests for age trends were evaluated using linear regression, and the significance was set at p < 0.05. Statistical analyses were conducted using Stata version 13.1 (College Park, Texas).
About the authors
Asher Rosinger is with the Centers for Disease Control and Prevention’s (CDC) Epidemic Intelligence Service, assigned to the National Center for Health Statistics (NCHS), Division of Health and Nutrition Examination Surveys (DHANES). Kirsten Herrick and Jaime Gahche are with DHANES. Sohyun Park is with CDC’s Division of Nutrition, Physical Activity, and Obesity.
References
- U.S. Department of Health and Human Services, U.S. Department of Agriculture. 2015–2020 Dietary Guidelines for Americans. 8th ed. 2015.
- de Ruyter JC, Olthof MR, Seidell JC, Katan MB. A trial of sugar-free or sugar-sweetened beverages and body weight in children. N Engl J Med 367(15):1397–406. 2012.
- Jin R, Le NA, Liu S, Farkas Epperson M, Ziegler TR, Welsh JA, et al. Children with NAFLD are more sensitive to the adverse metabolic effects of fructose beverages than children without NAFLD. J Clin Endocrinol Metab 97(7):E1088–98. 2012.
- Papandreou D, Karabouta Z, Pantoleon A, Rousso I. Investigation of anthropometric, biochemical and dietary parameters of obese children with and without non-alcoholic fatty liver disease. Appetite 59(3):939–44. 2012.
- Welsh JA, Sharma A, Cunningham SA, Vos MB. Consumption of added sugars and indicators of cardiovascular disease risk among US adolescents. Circulation 123(3):249–57. 2011.
- Davis JN, Ventura EE, Weigensberg MJ, Ball GD, Cruz ML, Shaibi GQ, Goran MI. The relation of sugar intake to beta cell function in overweight Latino children. Am J Clin Nutr 82(5):1004–10. 2005.
- Kit BK, Fakhouri TH, Park S, Nielsen SJ, Ogden CL. Trends in sugar-sweetened beverage consumption among youth and adults in the United States: 1999–2010. Am J Clin Nutr 98(1):180–8. 2013.
- National Center for Health Statistics. National Health and Nutrition Examination Survey: Questionnaires, datasets, and related documentation. NHANES 2011–2012, NHANES 2013–2014.
- National Center for Health Statistics. National Health and Nutrition Examination Survey: MEC in-person dietary interviewers procedures manual. Dietary interview component. NHANES 2011–2012, NHANES 2013–2014.
Suggested citation
Rosinger A, Herrick K, Gahche J, Park S. Sugar-sweetened beverage consumption among U.S. youth, 2011–2014. NCHS data brief, no 271. Hyattsville, MD: National Center for Health Statistics. 2017.
Copyright information
All material appearing in this report is in the public domain and may be reproduced or copied without permission; citation as to source, however, is appreciated.
National Center for Health Statistics
Charles J. Rothwell, M.S., M.B.A., Director
Jennifer H. Madans, Ph.D., Associate Director for Science
Division of Health and Nutrition Examination Surveys
Kathryn S. Porter, M.D., M.S., Director
Ryne Paulose-Ram, Ph.D., Associate Director for Science