The Association of Marital Status and Offers of Employer-based Health Insurance for Employed Women Aged 27–64: United States, 2014–2015
- Key findings
- Do offers of employer-based health insurance for employed women aged 27–64 vary by marital status?
- Do offers of employer-based health insurance for employed women aged 27–64 vary by marital status within categories of educational attainment?
- Do offers of employer-based health insurance for employed women aged 27–64 vary by marital status within categories of income?
- Do offers of employer-based health insurance for employed women aged 27–64 vary by marital status within categories of race and ethnicity?
- Summary
- Definitions
- Data source and methods
- About the authors
- References
- Suggested citation
NCHS Data Brief No. 268, January 2017
PDF Version (381 KB)
Jessica L. Simpson, M.P.H., and Robin A. Cohen, Ph.D.
Key findings
Data from the National Health Interview Survey
- Among employed women aged 27–64, unmarried women (72.2%) were more likely than married women (69.3%) to have been offered health insurance by their employer.
- Among employed married women aged 27–64, 16.8% were offered health insurance only through their spouse’s employer.
- Considering all offers of health insurance (through a woman’s employer or her spouse’s employer), employed married women aged 27–64 (86.1%) were more likely than employed unmarried women (72.2%) to have had an employer offer of health insurance.
- Regardless of educational attainment, and for most income and racial groups, employed married women aged 27–64 were more likely than employed unmarried women to have been offered health insurance by their employer or their spouse’s employer.
In 2015, women were less likely than men to have been insured through their own employer and more likely to have been covered as a dependent (1). This report describes the association of marital status and the presence of employer-based health insurance offers among employed women in the United States. Analyses are limited to women aged 27–64 to exclude offers associated with parental employment for those under age 27. An offer of employer-based health insurance includes offers by the woman’s employer or her spouse’s employer. The presence of an offer does not indicate offer take up.
Keywords: employer sponsored, National Health Interview Survey
Do offers of employer-based health insurance for employed women aged 27–64 vary by marital status?
- Unmarried women (72.2%) were more likely than married women (69.3%) to have had an offer of health insurance from their own employer (Figure 1).
- Almost 17% of married women (16.8%) were offered health insurance only through their spouse’s employer.
- Considering all available offers of health insurance through a woman’s employer or her spouse’s employer, married women (86.1%) were more likely than unmarried women (72.2%) to have had an employer offer of health insurance.
Figure 1. Percentage of employed women aged 27–64 with an offer of employer-based health insurance, by marital status: United States, 2014–2015
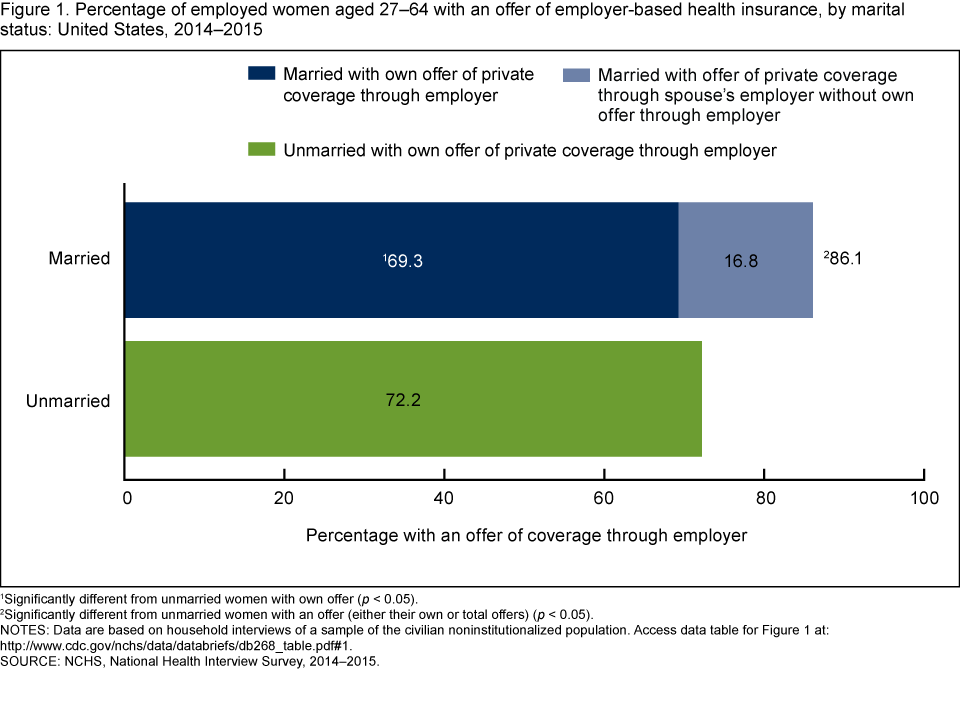
1Significantly different from unmarried women with own offer (p < 0.05).
2Significantly different from unmarried women with an offer (either their own or total offers) (p < 0.05).
NOTES: Data are based on household interviews of a sample of the civilian noninstitutionalized population. Access data table for Figure 1.
SOURCE: NCHS, National Health Interview Survey, 2014–2015.
Do offers of employer-based health insurance for employed women aged 27–64 vary by marital status within categories of educational attainment?
- Unmarried women who completed some college (71.1%) or who earned a college degree (82.2%) were more likely than married women who completed some college (67.0%) or who earned a college degree (76.8%) to have had an offer of health insurance from their own employer (Figure 2).
- Considering all available offers of health insurance through a woman’s employer or her spouse’s employer, married women were more likely than unmarried women to have had an employer offer of health insurance across all levels of educational attainment.
- Among married women, the percentage of employed women with an offer of health insurance from their own employer or their spouse’s employer (total offers) increased as levels of educational attainment increased.
- Among unmarried women, the percentage of employed women with an offer of health insurance from their own employer increased as levels of educational attainment increased.
Figure 2. Percentage of employed women aged 27–64 with an offer of employer-based health insurance, by marital status and education: United States, 2014–2015
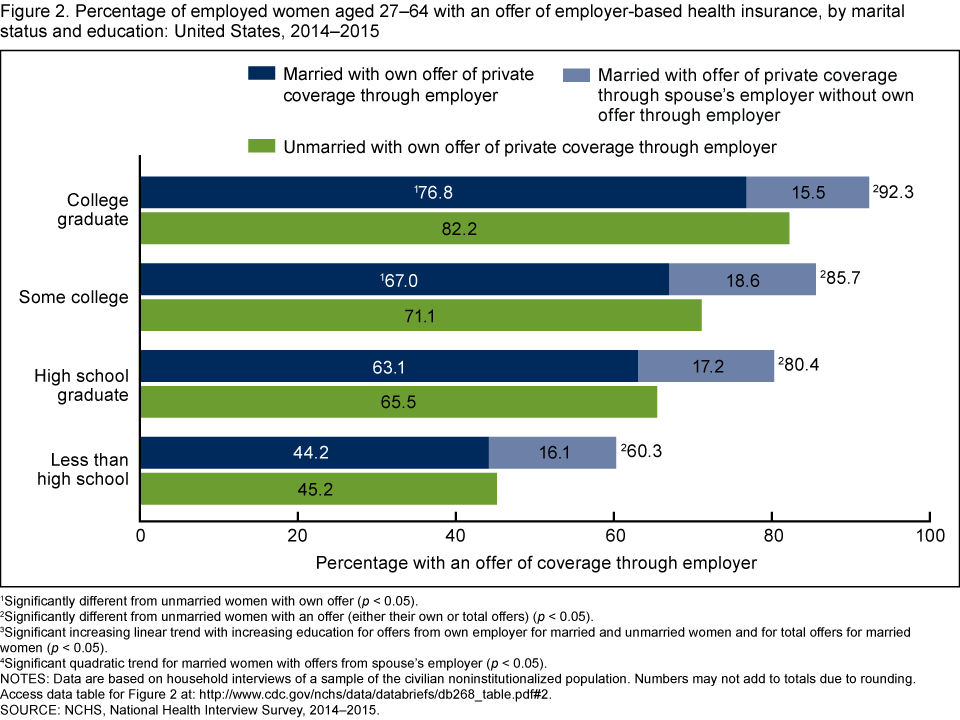
1Significantly different from unmarried women with own offer (p < 0.05).
2Significantly different from unmarried women with an offer (either their own or total offers) (p < 0.05).
3Significant increasing linear trend with increasing education for offers from own employer for married and unmarried women and for total offers for married women (p < 0.05).
4Significant quadratic trend for married women with offers from spouse’s employer (p < 0.05).
NOTES: Data are based on household interviews of a sample of the civilian noninstitutionalized population. Numbers may not add to totals due to rounding. Access data table for Figure 2.
SOURCE: NCHS, National Health Interview Survey, 2014–2015.
Do offers of employer-based health insurance for employed women aged 27–64 vary by marital status within categories of income?
- Unmarried women with family incomes greater than 100% of the federal poverty level were more likely than married women with the same level of income to have had an offer of health insurance from their own employer (Figure 3).
- Considering all available offers of health insurance through a woman’s employer or her spouse’s employer, married women were more likely than unmarried women to have had an employer offer of health insurance at all poverty levels.
- Among married women, the percentage of employed women with an offer of health insurance from their own employer or their spouse’s employer (total offers) increased as family income increased.
- Among unmarried women, the percentage of employed women with an offer of health insurance from their own employer increased as family income increased.
Figure 3. Percentage of employed women aged 27–64 with an offer of employer-based health insurance, by marital and poverty status: United States, 2014–2015
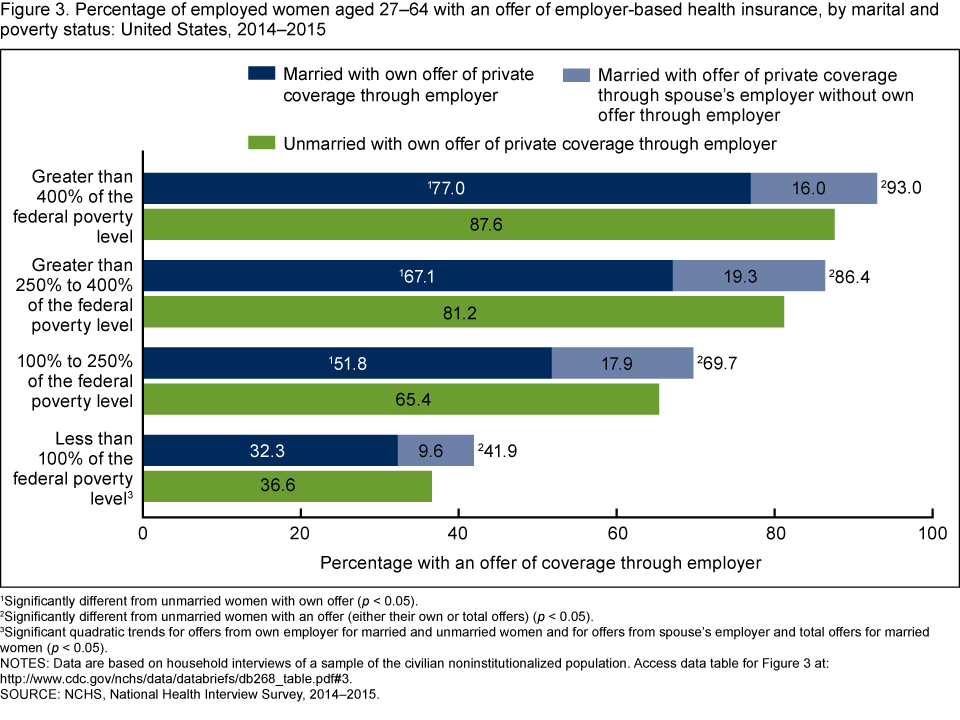
1Significantly different from unmarried women with own offer (p < 0.05).
2Significantly different from unmarried women with an offer (either their own or total offers) (p < 0.05).
3Significant quadratic trends for offers from own employer for married and unmarried women and for offers from spouse’s employer and total offers for married women (p < 0.05).
NOTES: Data are based on household interviews of a sample of the civilian noninstitutionalized population. Access data table for Figure 3.
SOURCE: NCHS, National Health Interview Survey, 2014–2015.
Do offers of employer-based health insurance for employed women aged 27–64 vary by marital status within categories of race and ethnicity?
- Non-Hispanic white (73.6%) and non-Hispanic Asian (75.2%) unmarried women were more likely than non-Hispanic white (70.7%) and non-Hispanic Asian (66.2%) married women to have had an offer of health insurance from their own employer (Figure 4).
- Considering all available offers of health insurance through a woman’s employer or her spouse’s employer, married women from all racial and ethnic groups were more likely than unmarried women to have had an employer offer of health insurance.
Figure 4. Percentage of employed women aged 27–64 with an offer of employer-based health insurance, by marital status and race and ethnicity: United States, 2014–2015
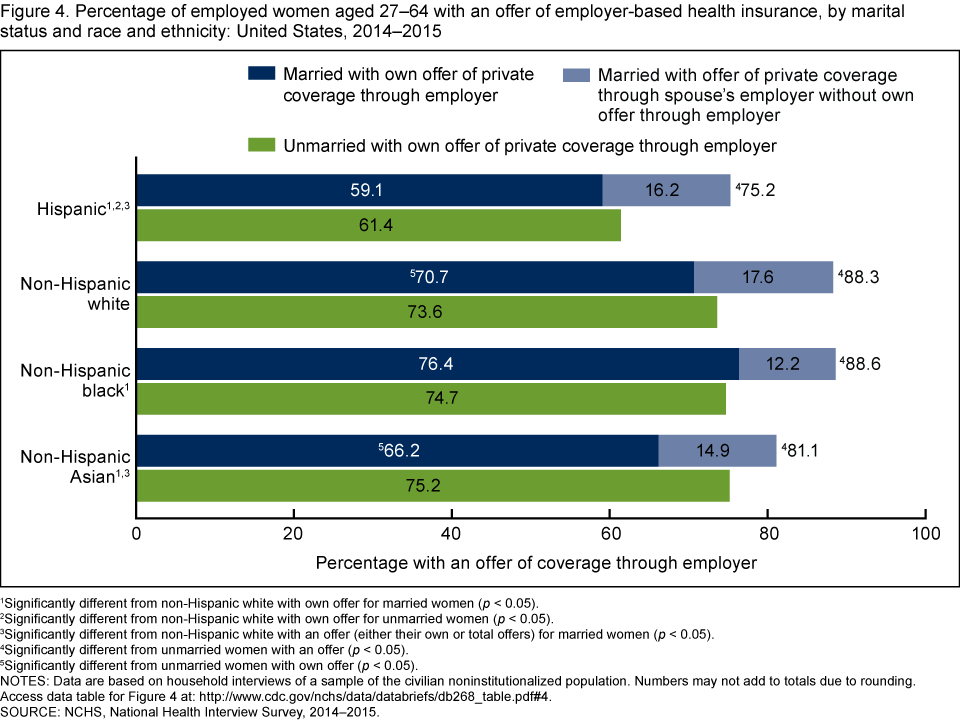
1Significantly different from non-Hispanic white with own offer for married women (p < 0.05).
2Significantly different from non-Hispanic white with own offer for unmarried women (p < 0.05).
3Significantly different from non-Hispanic white with an offer (either their own or total offers) for married women (p < 0.05).
4Significantly different from unmarried women with an offer (p < 0.05).
5Significantly different from unmarried women with own offer (p < 0.05).
NOTES: Data are based on household interviews of a sample of the civilian noninstitutionalized population. Numbers may not add to totals due to rounding. Access data table for Figure 4.
SOURCE: NCHS, National Health Interview Survey, 2014–2015.
Summary
Health insurance coverage is an important determinant of access to health care in the United States (2). Marital status is an important predictor of having an offer of employer-based health insurance for employed women aged 27–64 across all levels of educational attainment, incomes relative to federal poverty levels, and racial and ethnic groups. Married women may gain an additional opportunity for an offer of health insurance through their spouse’s employer. However, a more complex picture emerges with regard to a woman’s own offer of employer-based health insurance. Among employed women, unmarried women with at least some college education, family incomes greater than 100% of the federal poverty level, and who were non-Hispanic white or non-Hispanic Asian were more likely to have been offered health insurance by their employer compared with married women in these same groups.
Definitions
Employment status: In the National Health Interview Survey (NHIS), all persons aged 18 and over were asked, “Which of the following were you doing last week? Working for pay at a job or business; with a job or business but not at work; looking for work; working, but not for pay, at a job or business; not working at a job or business and not looking for work.” Women were classified as employed if the family respondent indicated that they were working for pay at a job or business; with a job or business but not at work; or working, but not for pay at a job or business last week at the time of interview.
Federal poverty level: Based on family income and family size using the U.S. Census Bureau’s poverty thresholds for the previous calendar year. The 2014–2015 NHIS imputed income files were used to help create the poverty variable.
Marital status: In NHIS, all persons aged 14 and over were asked, “Are you now married, widowed, divorced, separated, never married, or living with a partner?” Widows and women who reported that they were separated or living with a partner but were not married were excluded from the analysis because their health insurance coverage status relative to their current or late spouse was unclear based on state law and survivor benefit status. Women were classified as married if the family respondent indicated that they were currently married. They were classified as unmarried if the family respondent indicated that they were currently divorced or never married.
Offers of employer-based health insurance: Women were classified as having their own offer of employer-based health insurance if they responded affirmatively to the following NHIS question, which was asked of the family respondent for all persons aged 18 and over who were working for pay last week, with a job or business but not at work last week, or working but not for pay last week: “Regarding your job or work last week, was health insurance offered to you through your workplace?” NHIS does not include a question that directly asks if the woman has an offer from her spouse’s employer. However, 97.8% and 97.7% of private-sector employees who worked in a U.S. firm that offered coverage were offered family coverage in 2014 and 2015, respectively (3–4). Therefore, if the spouse responded “yes” to the aforementioned question, the woman was assumed to also have received an offer of employer-based health insurance through her spouse. Under the Affordable Care Act, children under age 26 can join or remain on a parent’s plan, even if they are married (5). Therefore, women aged 26 and under were excluded from this analysis.
Data source and methods
Data from the 2014–2015 NHIS were used for this analysis. NHIS data are collected continuously throughout the year by interviewers from the U.S. Census Bureau for the National Center for Health Statistics (NCHS). NHIS collects information about the health and health care of the civilian noninstitutionalized U.S. population. Interviews are conducted in respondents’ homes, but follow-ups to complete interviews may be conducted over the telephone. Data from this analysis come from the Family Core component of the 2014–2015 NHIS; one family respondent answered the questions about all members of the family. Women aged 27–64 were included in this analysis. Women under age 27 were excluded because they may be eligible for private health insurance coverage through their parent’s employer, and women aged 65 and over were excluded because the Medicare program covers most people aged 65 and over. More information about NHIS is available from: www.cdc.gov/nchs/nhis.htm.
NHIS is designed to yield a nationally representative sample, and this analysis used weights to produce national estimates. Data weighting procedures are described elsewhere (6). Point estimates were calculated using SUDAAN software (7) to account for the complex sample design of NHIS. All estimates shown in this report meet NCHS standards of reliability (relative standard error less than or equal to 30%). Differences between percentages were evaluated using two-sided significance tests at the 0.05 level.
About the authors
Jessica L. Simpson and Robin A. Cohen are with the National Center for Health Statistics, Division of Health Interview Statistics.
References
- The Henry J. Kaiser Family Foundation. Fact sheet: Women’s health insurance coverage. 2016.
- National Center for Health Statistics. Fact sheet: Health insurance and access to care. 2015.
- Agency for Healthcare Research and Quality. MEPS insurance component chartbook 2014. Rockville, MD. 2015.
- Agency for Healthcare Research and Quality. MEPS insurance component chartbook 2015. Rockville, MD. 2016.
- U.S. Department of Health and Human Services. Young adult coverage. Washington, D.C. 2013.
- Parsons VL, Moriarity C, Jonas K, et al. Design and estimation for the National Health Interview Survey, 2006–2015. National Center for Health Statistics. Vital Health Stat 2(165). 2014.
- RTI International. SUDAAN (Release 11.0.1) [computer software]. 2013.
Suggested citation
Simpson JL, Cohen RA. The association of marital status and offers of employer-based health insurance for employed women aged 27–64: United States, 2014–2015. NCHS data brief, no 268. Hyattsville, MD: National Center for Health Statistics. 2017.
Copyright information
All material appearing in this report is in the public domain and may be reproduced or copied without permission; citation as to source, however, is appreciated.
National Center for Health Statistics
Charles J. Rothwell, M.S., M.B.A., Director
Jennifer H. Madans, Ph.D., Associate Director for Science
Division of Health Interview Statistics
Marcie L. Cynamon, Director
Stephen J. Blumberg, Ph.D., Associate Director for Science