Births in the United States, 2015
- Key findings
- The number and rate of births declined in the United States in 2015.
- Birth rates declined for women under age 30 and rose for women aged 30–44 in 2015.
- Overall and low-risk cesarean delivery rates declined for the third year in a row in 2015.
- The preterm birth rate increased in the United States in 2015.
- Summary
- Definitions
- Data source and methods
- About the authors
- References
- Suggested citation
NCHS Data Brief No. 258, September 2016
PDF Version (391 KB)
Key findings
Data from the National Vital Statistics System
- There were 3.978 million births in the United States in 2015, down less than 1% from 2014.
- The 2015 U.S. general fertility rate (births per 1,000 women aged 15–44) was down 1% from 2014.
- Birth rates dropped in 2015 to record lows among women under age 30 and rose for those aged 30–44.
- The cesarean delivery rate declined to 32.0% of births in 2015; the preterm birth rate rose slightly to 9.63% from 2014 to 2015.
This report presents several key demographic and maternal and infant health indicators using 2015 final birth data. Trends in general fertility rates, age-specific birth rates, cesarean and low-risk cesarean delivery, and preterm birth rates are presented. Data are from the national vital statistics birth files.
Keywords: fertility rates, cesarean delivery, preterm births, National Vital Statistics System
The number and rate of births declined in the United States in 2015.
- The number of U.S. births declined less than 1% from 2014 to 2015, to 3,978,497. This decline followed an increase in births for 2014, the first increase since 2007 (Figure 1).
- From 2014 to 2015, the number of births for non-Hispanic white women declined 1%, whereas the number of births for Hispanic women rose 1%, and births to non-Hispanic black women were essentially unchanged.
- The number of births per 1,000 women aged 15–44, or the general fertility rate, declined 1% in 2015 to 62.5 from 62.9 in 2014. The general fertility rate is down 10% since 2007.
- The general fertility rate declined less than 1% for non-Hispanic white women and 1% for both non-Hispanic black and Hispanic women from 2014. Rates are down for all groups from 2007.
Figure 1. Live births and general fertility rates, by race and Hispanic origin of mother: United States, 2007 and 2013–2015
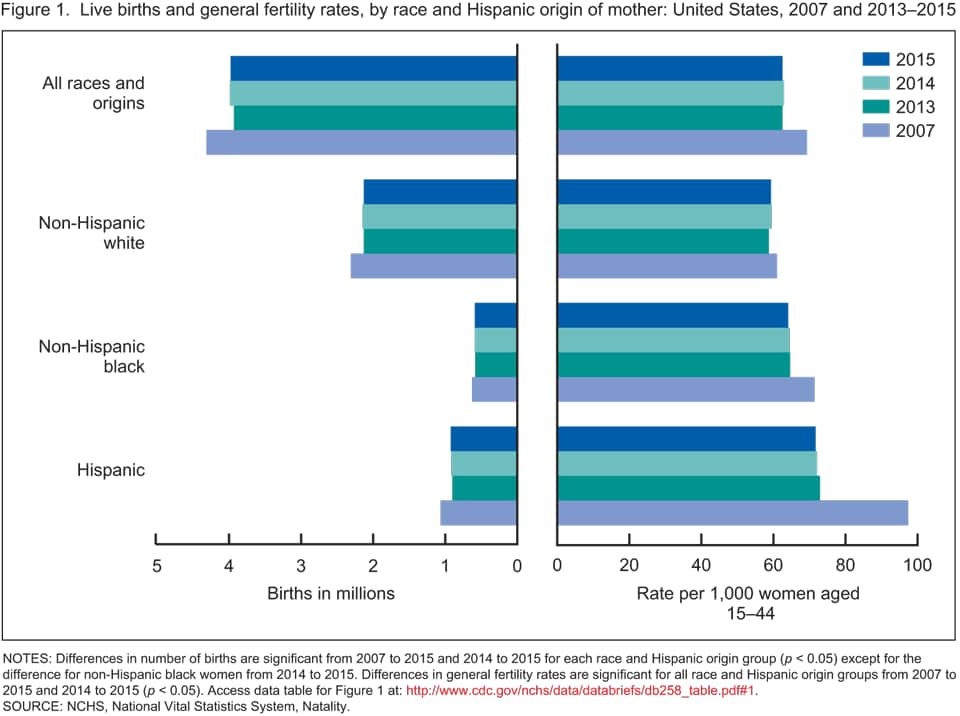
NOTES: Differences in number of births are significant from 2007 to 2015 and 2014 to 2015 for each race and Hispanic origin group (p < 0.05) except for the difference for non-Hispanic black women from 2014 to 2015. Differences in general fertility rates are significant for all race and Hispanic origin groups from 2007 to 2015 and 2014 to 2015 (p < 0.05). Access data table for Figure 1.
SOURCE: NCHS, National Vital Statistics System, Natality.
Birth rates declined for women under age 30 and rose for women aged 30–44 in 2015.
- Teen birth rates fell 8% to 22.3 births per 1,000 women, rates for women aged 20–24 fell 3% to 76.8, and rates for women aged 25–29 declined 1% to 104.3 (Figure 2).
- The birth rate for teenagers declined 46% since 2007, when a brief uptick was observed for this age group.
- In contrast, birth rates for women aged 30–44 rose from 2014 to 2015. Rates rose 1% to 101.5 births per 1,000 women aged 30–34, 2% to 51.8 births for women aged 35–39, and 4% to 11.0 births for women aged 40–44.
- Since 2007, the largest increase was for mothers aged 40–44, up 15% compared with rises of 9% for women aged 35–39 and 1% for women aged 30–34.
Figure 2. Birth rates, by age of mother: United States, 2007, 2014, and 2015
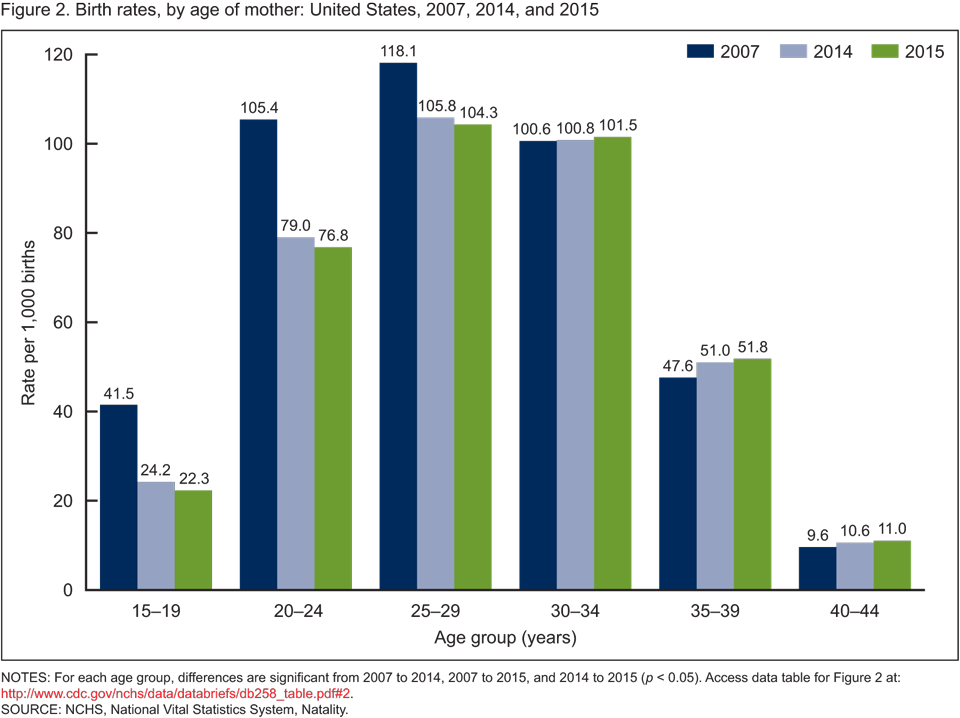
NOTES: For each age group, differences are significant from 2007 to 2014, 2007 to 2015, and 2014 to 2015 (p < 0.05).
Access data table for Figure 2.
SOURCE: NCHS, National Vital Statistics System, Natality.
Overall and low-risk cesarean delivery rates declined for the third year in a row in 2015.
- From 2014 to 2015, the overall cesarean delivery rate declined 1%, from 32.2% to 32.0%. The low-risk cesarean delivery rate also declined 1%, from 26.0% to 25.8% from 2014 to 2015 (Figure 3).
- The overall cesarean delivery rate was down 3% from the peak in 2009 (32.9%), and the low-risk cesarean delivery rate declined 8% from the 2009 peak (28.0%).
Figure 3. Cesarean delivery and low-risk cesarean delivery rates: United States, 2009, 2014, and 2015
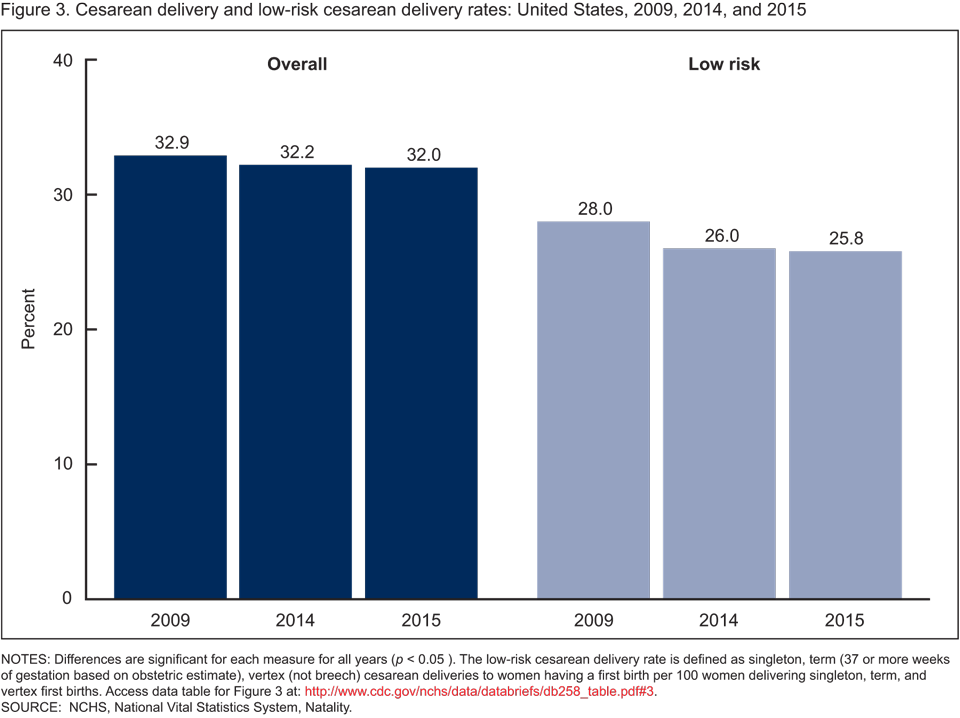
NOTES: Differences are significant for each measure for all years (p < 0.05). The low-risk cesarean delivery rate is defined as singleton, term (37 or more weeks of gestation based on obstetric estimate), vertex (not breech) cesarean deliveries to women having a first birth per 100 women delivering singleton, term, and vertex first births. Access data table for Figure 3.
SOURCE: NCHS, National Vital Statistics System, Natality.
The preterm birth rate increased in the United States in 2015.
- The U.S. preterm birth rate rose slightly in 2015 to 9.63%, from 9.57% in 2014. The preterm birth rate had declined 8% from 2007 (10.44%), the most recent year for which comparable data are available, to 2014 (Figure 4).
- The early preterm rate was essentially unchanged at 2.76% in 2015, but the rate of late preterm newborns rose, from 6.82% to 6.87% from 2014 to 2015.
- Increases in preterm birth rates from 2014 to 2015 were observed for infants born to non-Hispanic black (13.23% to 13.41%) and Hispanic (9.03% to 9.14%) women; the rate for non-Hispanic white women was essentially stable at 8.88% in 2015 compared with 8.91% in 2014.
- Preterm birth rates declined 10% from 2007 to 2014 for non-Hispanic white and non-Hispanic black infants and 3% for Hispanic infants.
Figure 4. Preterm birth rates, by race and Hispanic origin of mother: United States, 2007, 2014, and 2015
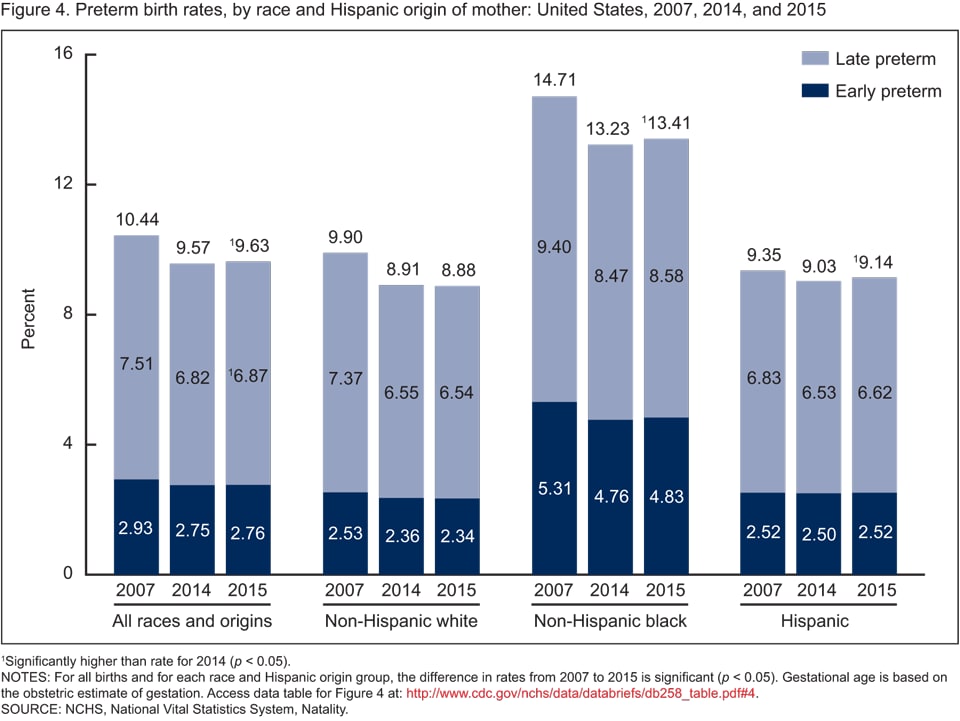
1Significantly higher than rate for 2014 (p < 0.05).
NOTES: For all births and for each race and Hispanic origin group, the difference in rates from 2007 to 2015 is significant (p < 0.05). Gestational age is based on the obstetric estimate of gestation. Access data table for Figure 4.
SOURCE: NCHS, National Vital Statistics System, Natality.
Summary
Following modest increases in 2014, the number and rate of births declined in the United States in 2015, reverting to downward trends that were observed from 2007 through 2013. Birth rates were down from 2014 to 2015 to records lows among women under age 30, but rates continued to rise for women aged 30–44, continuing trends observed for three decades (1). Fertility rates were down for each race and Hispanic origin group in 2015. Total and low-risk cesarean delivery rates continued to decline in 2015, but the preterm birth rate rose for the first year since 2007, when national data first became available for this measure (2). An earlier report presented 2015 preliminary data on selected topics (3). The upcoming report “Births: Final Data for 2015” will present more detailed information on the topics addressed in this report and selected others (4).
Definitions
General fertility rate: Number of births per 1,000 women aged 15–44.
Age-specific birth rate: Number of births per 1,000 women in a specified age group.
Cesarean delivery rate: Number of births delivered by cesarean per 100 births.
Low-risk cesarean delivery rate: Number of term (37 or more completed weeks), singleton, vertex (not breech) first births delivered by cesarean per 100 term, singleton, and vertex first births.
Preterm birth rate: Births delivered prior to 37 completed weeks of gestation per 100 births. Gestational age is based on the obstetric estimate of gestation (2).
Early preterm birth rate: Births delivered prior to 34 completed weeks of gestation per 100 births.
Late preterm birth rate: Births delivered 34–36 completed weeks of gestation per 100 births.
Data source and methods
This report contains data from the Natality Data File from the National Vital Statistics System. The vital statistics natality file is based on information derived from birth certificates and includes information for all births occurring in the United States. This data brief accompanies the release of the 2015 natality public-use file (5). More detailed analysis of the topics presented in this report and many additional topics—such as births to unmarried women, prenatal care, tobacco use during pregnancy, source of payment for delivery, pregnancy risk factors, maternal morbidity, multiple births, and breastfeeding—are available by accessing the annual natality files (5).
Data are not presented in this report for women aged 45 and over. For 2015 information on this age group, see “Births: Final Data for 2015” (4).
References to increases or decreases in rates indicate differences are statistically significant at the 0.05 level. Computations exclude records for which information is unknown.
About the authors
Joyce A. Martin, Brady E. Hamilton, and Michelle J.K. Osterman are with the National Center for Health Statistics, Division of Vital Statistics, Reproductive Statistics Branch.
References
- Hamilton BE, Martin JA, Osterman MJK, et al. Births: Final data for 2014. National vital statistics reports; vol 64 no 12. Hyattsville, MD: National Center for Health Statistics. 2015.
- Martin JA, Osterman MJK, Kirmeyer SE, Gregory ECW. Measuring gestational age in vital statistics data: Transitioning to the obstetric estimate. National vital statistics reports; vol 64 no 5. Hyattsville, MD: National Center for Health Statistics. 2015.
- Hamilton BE, Martin JA, Osterman MJK. Births: Preliminary data for 2015. National vital statistics reports; vol 65 no 3. Hyattsville, MD: National Center for Health Statistics. 2016.
- Martin JA, Hamilton BE, Osterman MJK, et al. Births: Final data for 2015. National vital statistics reports. Hyattsville, MD: National Center for Health Statistics. [Forthcoming].
- National Center for Health Statistics. Vital statistics data available online: Natality public use file and CD-ROM. Hyattsville, MD: National Center for Health Statistics. Published annually.
Suggested citation
Martin JA, Hamilton BE, Osterman MJK. Births in the United States, 2015. NCHS data brief, no 258. Hyattsville, MD: National Center for Health Statistics. 2016.
Copyright information
All material appearing in this report is in the public domain and may be reproduced or copied without permission; citation as to source, however, is appreciated.
National Center for Health Statistics
Charles J. Rothwell, M.S., M.B.A., Director
Jennifer H. Madans, Ph.D., Associate Director for Science
Division of Vital Statistics
Delton Atkinson, M.P.H., M.P.H., P.M.P., Director
Hanyu Ni, Ph.D., M.P.H., Associate Director for Science