The Effect of Changes in Selected Age-specific Causes of Death on Non-Hispanic White Life Expectancy Between 2000 and 2014
- Key findings
- The increase in life expectancy at birth between 2000 and 2014 varied by race and Hispanic origin.
- The change in life expectancy at birth for the non-Hispanic white population from 2000 to 2014 was due to increases in death rates for some causes of death and to decreases in others.
- The change in life expectancy at birth for the non-Hispanic white population from 2000 to 2014 was due to increases in death rates for some specific age groups and to decreases in others.
- Death rates due to unintentional injuries, suicide, and chronic liver disease in ages 25–54 increased for the non-Hispanic white population from 2000 to 2014.
- The change in life expectancy at birth for the non-Hispanic white population from 2000 to 2014 was due to increases in death rates for some subcategories of unintentional injuries and decreases in others.
- Summary
- Definitions
- Data source and methods
- About the authors
- References
- Suggested citation
NCHS Data Brief No. 250, June 2016
PDF Version (435 KB)
Kenneth D. Kochanek, M.A., Elizabeth Arias, Ph.D., and Brigham A. Bastian, B.S.
Key findings
Data from the National Vital Statistics System, Mortality
- Between 2000 and 2014, life expectancy increased by 3.6, 2.6, and 1.4 years, respectively, for non-Hispanic black, Hispanic, and non-Hispanic white persons.
- The 1.4-year increase in life expectancy for non-Hispanic white persons would have been greater if not for increases in death rates due to unintentional injuries, suicide, Alzheimer’s disease, chronic liver disease, and hypertension.
- Increases in death rates due to unintentional injuries, suicide, and chronic liver disease were large enough to increase all-cause non-Hispanic white death rates for ages 25–34, 35–44, and 45–54.
- Increases in death rates due to unintentional poisonings for ages 25–34, 35–44, and 45–54 had the greatest impact on the change in life expectancy for non-Hispanic white persons.
Between 2000 and 2014, life expectancy at birth in the United States increased by 2.0 years (1,2). The non-Hispanic black population experienced the greatest gain, followed by the Hispanic population. The non-Hispanic white population experienced the smallest gain. Changes in life expectancy over time are directly affected by increases and decreases in age-specific death rates and age-specific cause of death rates. In this report, the relationship between increases in all-cause age-specific and cause-specific death rates and the change in life expectancy for the non-Hispanic white population between 2000 and 2014 is explored.
Keywords: race and ethnicity, National Vital Statistics System
The increase in life expectancy at birth between 2000 and 2014 varied by race and Hispanic origin.
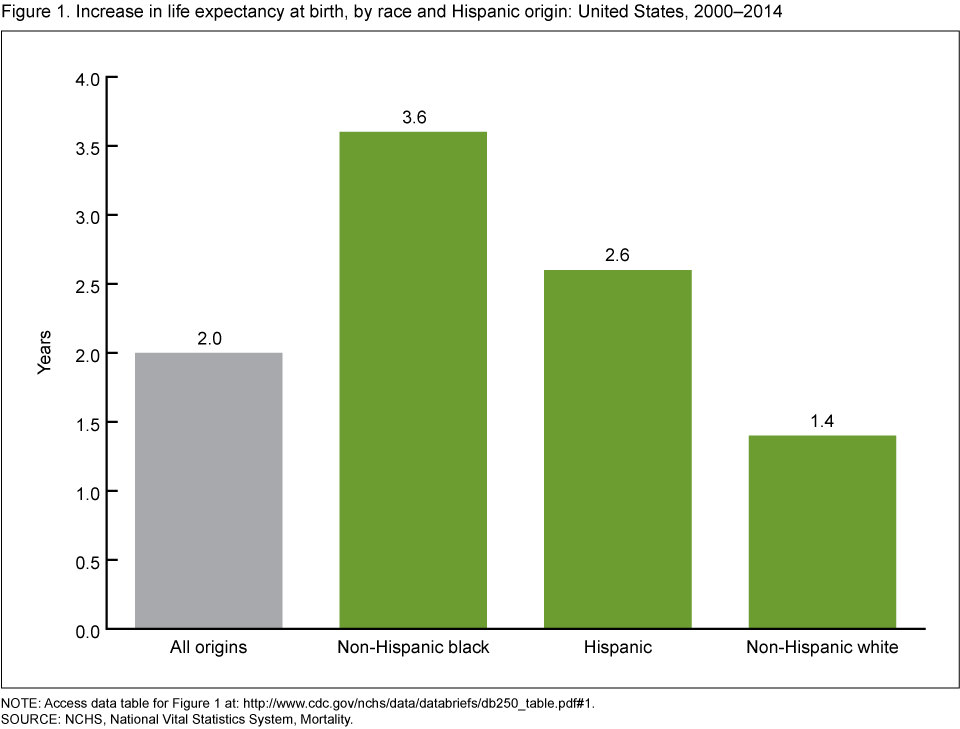
- Between 2000 and 2014, life expectancy for the total population increased by 2.0 years (Figure 1).
- Life expectancy at birth increased by 3.6 years for the non-Hispanic black population (from 71.6 years in 2000 to 75.2 years in 2014) and by 2.6 years for the Hispanic population (from 79.2 years in 2000 to 81.8 years in 2014).
- Life expectancy for the non-Hispanic white population increased by 1.4 years (from 77.4 years in 2000 to 78.8 years in 2014).
Figure 1. Increase in life expectancy at birth, by race and Hispanic origin: United States, 2000–2014
NOTE: Access data table for Figure 1.
SOURCE: NCHS, National Vital Statistics System, Mortality.
The change in life expectancy at birth for the non-Hispanic white population from 2000 to 2014 was due to increases in death rates for some causes of death and to decreases in others.
- The decrease in death rates due to heart disease, cancer, stroke, pneumonia, and aortic aneurysm contributed 1.928 years to the change in life expectancy at birth (Figure 2).
- The increase in death rates due to unintentional injuries, suicide, Alzheimer’s disease, chronic liver disease, and hypertension contributed a loss of 0.419 years to the change in life expectancy.
- Unintentional injuries, suicide, and chronic liver disease contributed a loss of 0.337 years in life expectancy.
Figure 2. Contribution of the leading causes of death to the change in life expectancy for the non-Hispanic white population: United States, 2000–2014

NOTES: The figure shows only 10 causes of death. The sum of all contributions by cause of death equals 1.4 years, the increase in life expectancy for the non-Hispanic white population from 2000 to 2014. Access data table for Figure 2.
SOURCE: NCHS, National Vital Statistics System, Mortality.
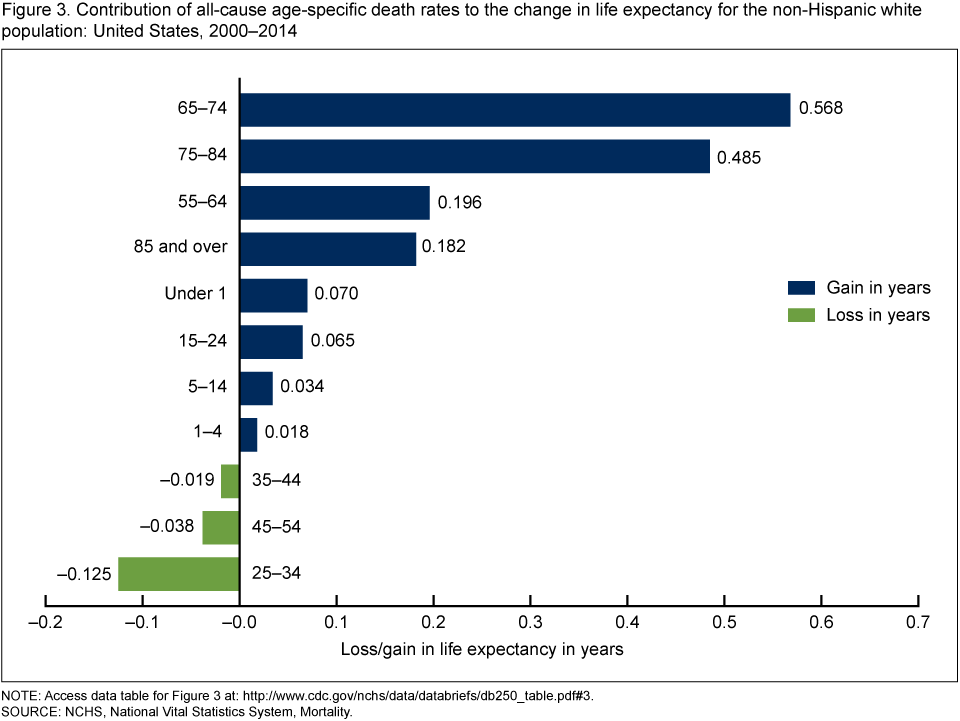
The change in life expectancy at birth for the non-Hispanic white population from 2000 to 2014 was due to increases in death rates for some specific age groups and to decreases in others.
- The decrease in all-cause age-specific death rates for ages 0–1, 1–4, 5–14, 15–24, 55–64, 65–74, 75–84, and 85 and over contributed 1.618 years to the change in life expectancy at birth (Figure 3).
- The increase in all-cause age-specific death rates for ages 25–34, 35–44, and 45–54 contributed a loss of 0.182 years to the change in life expectancy.
Figure 3. Contribution of all-cause age-specific death rates to the change in life expectancy for the non-Hispanic white population: United States, 2000–2014
NOTE: Access data table for Figure 3.
SOURCE: NCHS, National Vital Statistics System, Mortality.
Death rates due to unintentional injuries, suicide, and chronic liver disease in ages 25–54 increased for the non-Hispanic white population from 2000 to 2014.
- Death rates due to unintentional injuries increased 63.3% for ages 25–34, 41.5% for ages 35–44, and 73.5% for ages 45–54 (Figure 4).
- Death rates due to suicide increased by 37.3% for ages 25–34, 30.2% for ages 35–44, and 57.5% for ages 45–54.
- Death rates due to chronic liver disease increased by 30.9% for the age group 45–54.
Figure 4. Age-specific death rates for unintentional injuries, suicide, and chronic liver disease and cirrhosis for the non-Hispanic white population: United States, 2000–2014
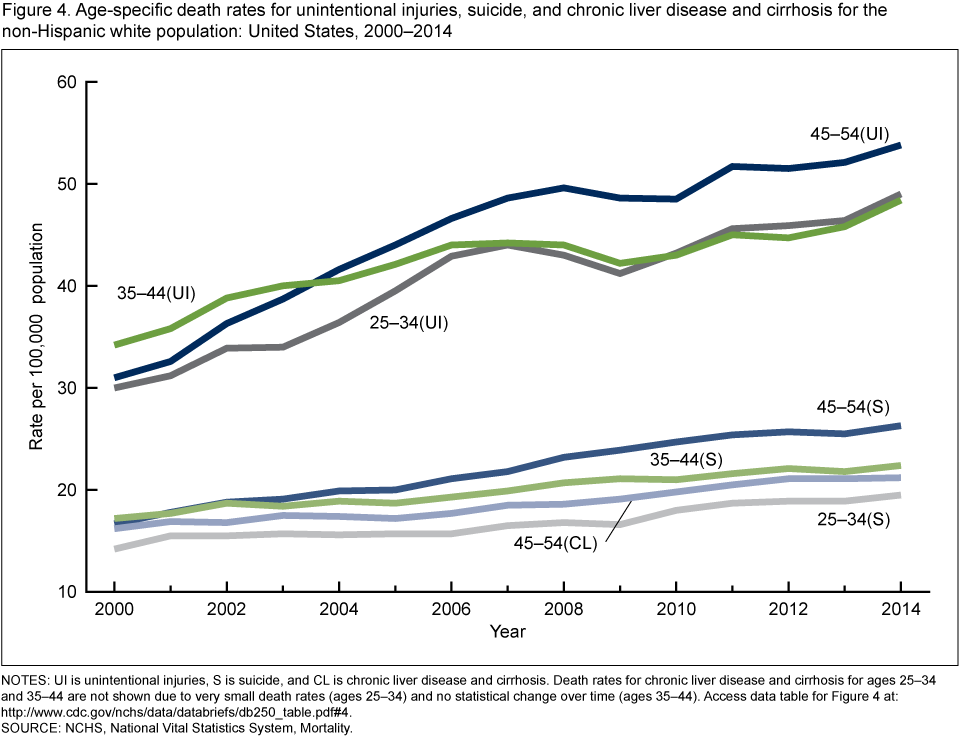
NOTES: UI is unintentional injuries, S is suicide, and CL is chronic liver disease and cirrhosis.
Death rates for chronic liver disease and cirrhosis for ages 25–34 and 35–44 are not shown due to very small death rates (ages 25–34) and no statistical change over time (ages 35–44).
Access data table for Figure 4.
SOURCE: NCHS, National Vital Statistics System, Mortality.
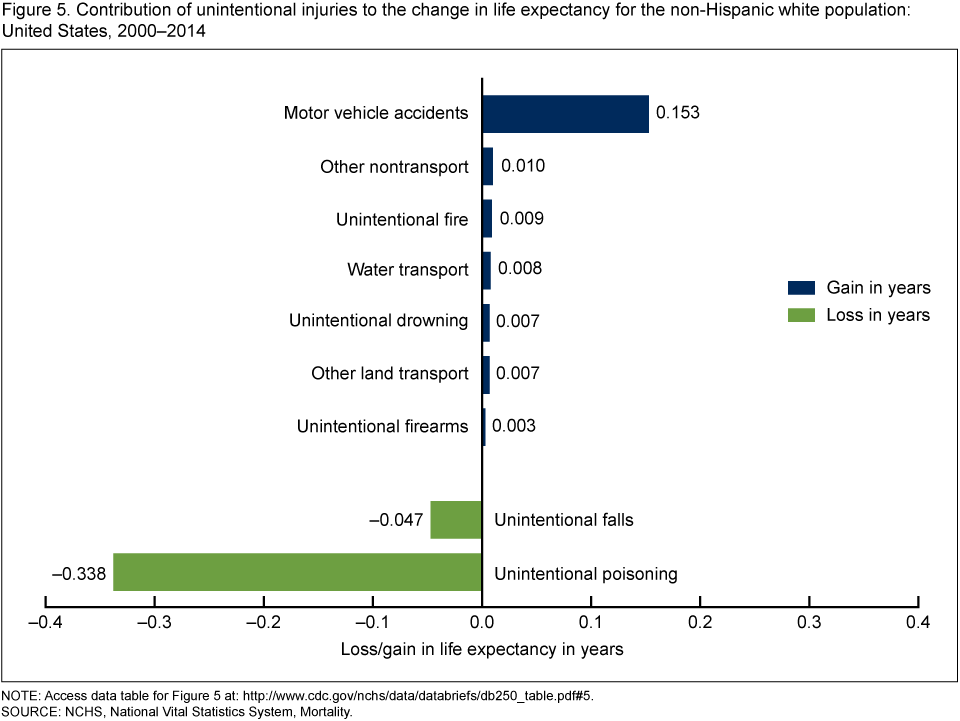
The change in life expectancy at birth for the non-Hispanic white population from 2000 to 2014 was due to increases in death rates for some subcategories of unintentional injuries and decreases in others.
- The decrease in death rates due to motor vehicle, other transport, unintentional fire, water transport, unintentional drowning, other land transport, and unintentional firearms contributed 0.197 years to the change in life expectancy at birth (Figure 5).
- The decrease in deaths from motor vehicle accidents contributed the most (0.153 years).
- Unintentional poisonings (mostly drug and alcohol poisoning) had the greatest contribution to the change in life expectancy for the non-Hispanic white population with a loss of 0.338 years.
Figure 5. Contribution of unintentional injuries to the change in life expectancy for the non-Hispanic white population: United States, 2000–2014
NOTE: Access data table for Figure 5.
SOURCE: NCHS, National Vital Statistics System, Mortality.
Summary
Between 2000 and 2014, life expectancy at birth increased by 1.4 years for the non-Hispanic white population in comparison with 2.6 years for the Hispanic and 3.6 years for the non-Hispanic black populations. In fact, for the first time in over 20 years, life expectancy declined by 0.1 years for the non-Hispanic white population between 2013 and 2014 (1,2). This finding led to the question of whether the rise in mortality from suicide, drug and alcohol poisoning, and chronic liver disease over the period played a role in the relatively small increase in life expectancy for the non-Hispanic white population (3).
The increase in life expectancy for the non-Hispanic white population was positively affected by decreases in death rates due to heart disease, cancer, stroke, pneumonia, and aortic aneurysm. On the other hand, increases in death rates due to unintentional injuries, suicide, Alzheimer’s disease, chronic liver disease, and hypertension had negative effects on the change in life expectancy. Increases in cause-specific death rates from only three causes—unintentional injuries, suicide, and chronic liver disease—were large enough to affect the all-cause death rates for the non-Hispanic white population in the age groups 25–34 (27.6% increase), 35–44 (2.7% increase), and 45–54 (7.0% increase). No other cause, including Alzheimer’s disease, had a large enough influence to affect all-cause age specific death rates. Increases in death rates due to unintentional poisonings (mostly drug and alcohol poisoning) for these three age groups had the single greatest negative effect on the change in life expectancy.
Increases in mortality due to unintentional poisonings, suicide, and chronic liver disease directly affected the change in life expectancy over the past 15 years for the non-Hispanic white population.
Definitions
Cause-of-death classification: Medical information—including injury diagnoses and external causes of injury—that is entered on death certificates filed in the United States is classified and coded in accordance with the International Statistical Classification of Diseases and Related Health Problems, Tenth Revision (ICD–10) (4). Corresponding cause-of-death categories and ICD–10 codes presented in this report are as follows:
Unintentional injuries [Accidents (V01–X59,Y85–Y86)]
Motor vehicle [Motor vehicle accidents (V02–V04,V09.0,V09.2,V12–V14,
V19.0–V19.2,V19.4–V19.6,V20–V79,V80.3–V80.5,V81.0–V81.1,V82.0–V82.1,
V83–V86,V87.0–V87.8,V88.0–V88.8,V89.0,V89.2)]
Other land transport [Other land transport accidents (V01,V05–V06,V09.1,
V09.3–V09.9,V10–V11,V15–V18,V19.3,V19.8–V19.9,V80.0–V80.2,
V80.6–V80.9,V81.2–V81.9,V82.2–V82.9,V87.9,V88.9,V89.1,V89.3,V89.9)]
Water transport [Water, air and space, and other and unspecified transport accidents and their sequelae (V90–V99,Y85)]
Unintentional falls [Falls (W00–W19)]
Unintentional firearms [Accidental discharge of firearms (W32–W34)]
Unintentional drowning [Accidental drowning and submersion (W65–W74)]
Unintentional fire [Accidental exposure to smoke, fire and flames (X00–X09)]
Unintentional poisoning [Accidental poisoning and exposure to noxious substances (X40–X49)]
Other nontransport [Other and unspecified nontransport accidents and their sequelae (W20–W31,W35–W64,W75–W99,X10–X39,X50–X59,Y86)]
Suicide [Intentional self-harm (*U03,X60–X84,Y87.0)]
Heart disease [Diseases of heart (I00–I09,I11,I13,I20–I51)]
Cancer [Malignant neoplasms (C00–C97)]
Stroke [Cerebrovascular diseases (I60–I69)]
Pneumonia [Influenza and pneumonia (J09–J18)]
Aortic aneurysm [Aortic aneurysm and dissection (I71)]
Alzheimer’s disease (G30)
Chronic liver disease and cirrhosis [Chronic liver disease (K70,K73–K74)]
Hypertension [Essential hypertension and hypertensive renal disease (I10,I12,I15)]
Life expectancy: The average number of years that a group of infants would live if the group was to experience throughout life the age-specific death rates present in the year of birth; also referred to as period or current life expectancy (5).
Data source and methods
All data are from the mortality file from the National Vital Statistics System. Life table methodology is explained in the reports “Deaths: Final Data for 2013” (2) and “United States Life Tables, 2011” (5). A complete description of the Arriaga life table partitioning methodology can be found in references 6 and 7.
About the authors
Kenneth D. Kochanek, Elizabeth Arias, and Brigham A. Bastian are with the National Center for Health Statistics, Division of Vital Statistics, Mortality Statistics Branch.
References
- Arias E. Changes in life expectancy by race and Hispanic origin in the United States, 2013–2014. NCHS data brief, no 244. Hyattsville, MD: National Center for Health Statistics. 2016.
- Xu JQ, Murphy SL, Kochanek KD, Bastian BA. Deaths: Final data for 2013. National vital statistics reports; vol 64 no 2. Hyattsville, MD: National Center for Health Statistics. 2016.
- Case A, Deaton A. Rising morbidity and mortality in midlife among white non-Hispanic Americans in the 21st century. Proc Natl Acad Sci 112(49):15078–83. 2015.
- WHO. International statistical classification of diseases and related health problems, tenth revision. 2nd edition. Geneva, Switzerland. 2004.
- Arias E. United States life tables, 2011. National vital statistics reports; vol 64 no 11. Hyattsville, MD: National Center for Health Statistics. 2015.
- Arriaga EE. Measuring and explaining the change in life expectancies. Demography 21(1):83–96. 1984.
- Arriaga E. Changing trends in mortality decline during the last decades. In: Ruzicka L, Wunsch G, Kane P, editors. Differential mortality: Methodological issues and biosocial factors. Oxford: Clarendon Press. 1989.
Suggested citation
Kochanek KD, Arias E, Bastian BA. The effect of changes in selected age-specific causes of death on non-Hispanic white life expectancy between 2000 and 2014. NCHS data brief, no 250. Hyattsville, MD: National Center for Health Statistics. 2016.
Copyright information
All material appearing in this report is in the public domain and may be reproduced or copied without permission; citation as to source, however, is appreciated.
National Center for Health Statistics
Charles J. Rothwell, M.S., M.B.A., Director
Jennifer H. Madans, Ph.D., Associate Director for Science
Division of Vital Statistics
Delton Atkinson, M.P.H., M.P.H., P.M.P., Director
Hanyu Ni, Ph.D., M.P.H., Associate Director for Science