Health of Non-Hispanic Asian Adults: United States, 2010–2014
- Key findings
- Did the percentage of adults in fair or poor health vary among non-Hispanic Asian subgroups?
- Did the percentage of adults with multiple chronic conditions differ among non-Hispanic Asian subgroups?
- Did the percentage of adults with serious psychological distress differ among non-Hispanic Asian subgroups?
- Did the percentage of adults with a work limitation differ among non-Hispanic Asian subgroups?
- Did the percentage of adults who were limited in social participation vary among non-Hispanic Asian subgroups?
- Summary
- Definitions
- Data source and methods
- About the authors
- References
- Suggested citation
NCHS Data Brief No. 247, May 2016
PDF Version (362 KB)
Barbara Bloom, M.P.A., and Lindsey I. Black, M.P.H.
Key findings
Data from the National Health Interview Survey, 2010–2014
- Non-Hispanic Asian adults were less likely than all U.S. adults to be in fair or poor health, have multiple chronic conditions, have serious psychological distress in the past 30 days, or be limited in work or social participation.
- Chinese adults reported better health on all five measures in this report compared with all U.S. adults.
- Chinese adults (11.3%) were less likely than Filipino (22.3%), Asian Indian (16.9%), Japanese (16.8%), or Vietnamese (15.6%) adults to have multiple chronic conditions.
- Chinese (1.8%) and Asian Indian (1.5%) adults were about one-half as likely as Japanese adults (4.1%) to have a work limitation.
- Chinese (2.4%), Japanese (2.2%), and Vietnamese (2.4%) adults were about one-half as likely as Korean adults (4.6%) to be limited in social participation.
About 5% of the U.S. population, or 15 million persons, are Asian (1). The Asian population is heterogeneous, characterized by a variety of languages, cultures, socioeconomic statuses, and health issues (2–4). Estimates are presented on health status, multiple chronic conditions, serious psychological distress, and limitations on work or social participation for all non-Hispanic Asian adults and the six largest Asian subgroups: Chinese, Filipino, Asian Indian, Japanese, Vietnamese, and Korean. Estimates for all U.S. adults are also shown.
Keywords: chronic conditions, National Health Interview Survey
Did the percentage of adults in fair or poor health vary among non-Hispanic Asian subgroups?
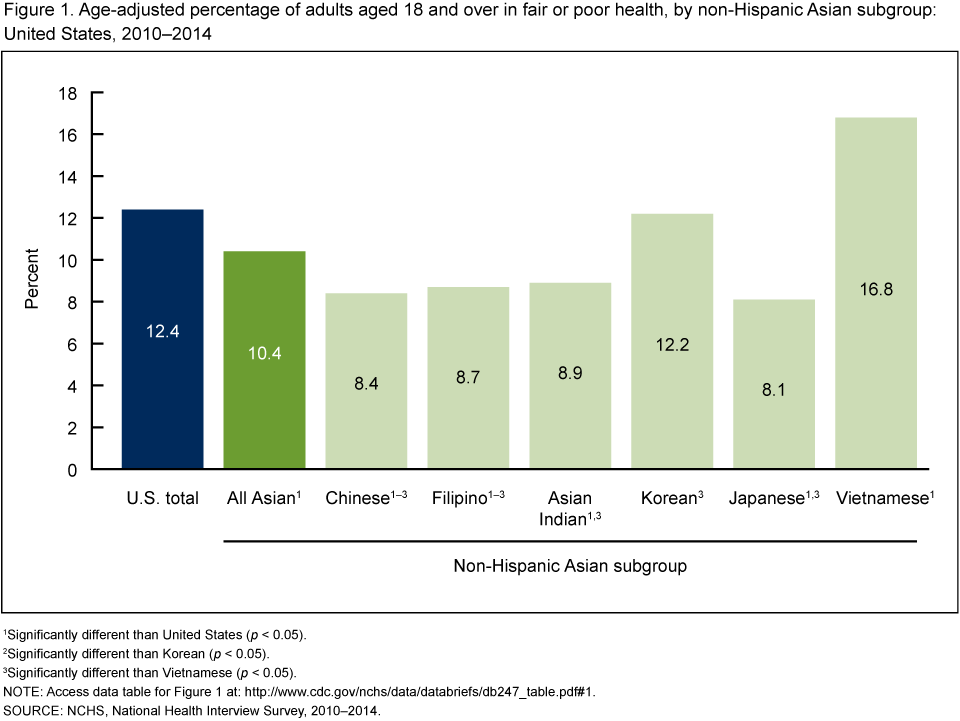
Overall, Chinese (8.4%), Filipino (8.7%), Asian Indian (8.9%), and Japanese (8.1%) adults were less likely than all U.S. adults (12.4%) to be in fair or poor health (Figure 1).
Vietnamese adults (16.8%) were more likely and Korean adults (12.2%) were about equally as likely as all U.S. adults (12.4%) to be in fair or poor health.
Among non-Hispanic Asian subgroups, Vietnamese adults (16.8%) were more likely than Korean adults (12.2%) and about twice as likely as Chinese (8.4%), Filipino (8.7%), Asian Indian (8.9%), and Japanese (8.1%) adults to be in fair or poor health.
Figure 1. Age-adjusted percentage of adults aged 18 and over in fair or poor health, by non-Hispanic Asian subgroup: United States, 2010–2014
1Significantly different than United States (p < 0.05).
2Significantly different than Korean (p < 0.05).
3Significantly different than Vietnamese (p < 0.05).
NOTE: Access data table for Figure 1.
SOURCE: NCHS, National Health Interview Survey, 2010–2014.
Did the percentage of adults with multiple chronic conditions differ among non-Hispanic Asian subgroups?
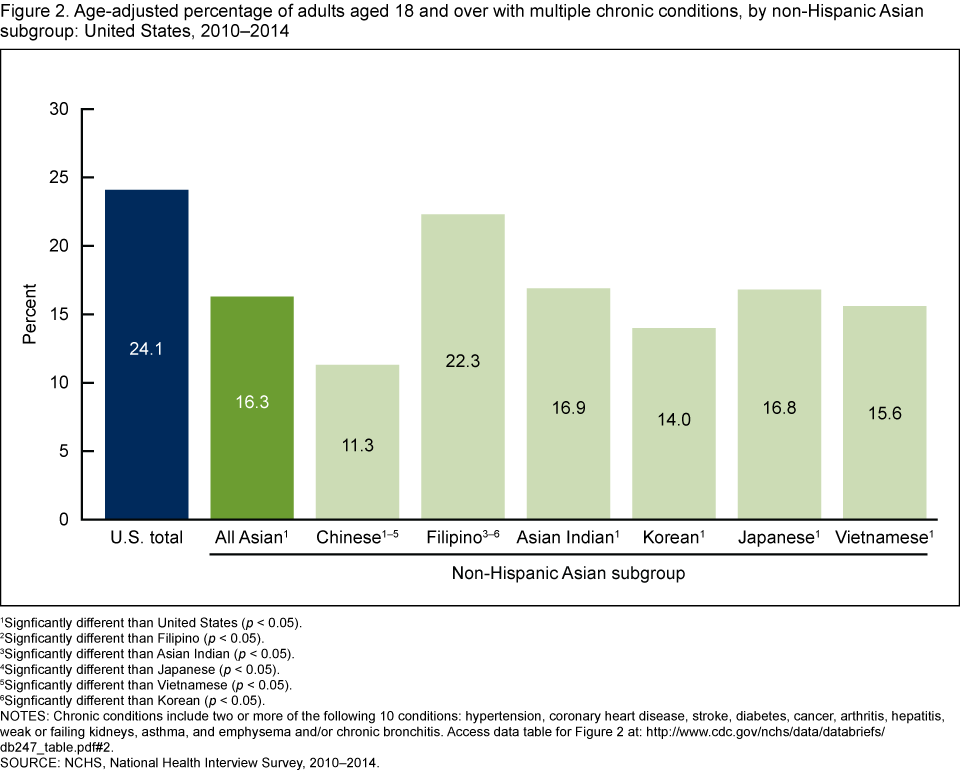
Overall, non-Hispanic Asian adults (16.3%) were about two-thirds as likely to have multiple chronic conditions (i.e., conditions lasting 3 months or longer) compared with all U.S. adults (24.1%). Filipino adults (22.3%), however, were about equally as likely as all U.S. adults (24.1%) to have multiple chronic conditions (Figure 2).
Chinese adults (11.3%) were about one-half as likely as all U.S. adults (24.1%) to have multiple chronic conditions.
Filipino adults (22.3%) were more likely than Chinese (11.3%), Asian Indian (16.9%), Korean (14.0%), Japanese (16.8%), and Vietnamese (15.6%) adults to have multiple chronic conditions.
Figure 2. Age-adjusted percentage of adults aged 18 and over with multiple chronic conditions, by non-Hispanic Asian subgroup: United States, 2010–2014
1Significantly different than United States (p < 0.05).
2Significantly different than Filipino (p < 0.05).
3Significantly different than Asian Indian (p < 0.05).
4Significantly different than Japanese (p < 0.05).
5Significantly different than Vietnamese (p < 0.05).
6Significantly different than Korean (p < 0.05).
NOTES: Chronic conditions include two or more of the following 10 conditions: hypertension, coronary heart disease, stroke, diabetes, cancer, arthritis, hepatitis, weak or failing kidneys, asthma, and emphysema and/or chronic bronchitis. Access data table for Figure 2.
SOURCE: NCHS, National Health Interview Survey, 2010–2014.
Did the percentage of adults with serious psychological distress differ among non-Hispanic Asian subgroups?
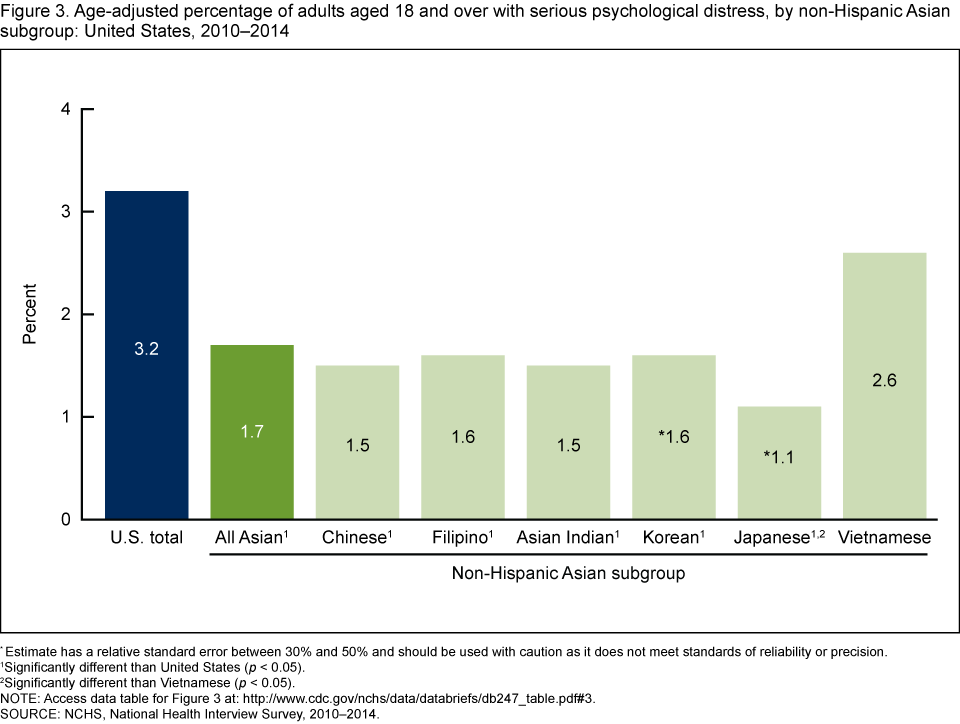
Overall, non-Hispanic Asian adults (1.7%) were about one-half as likely to have serious psychological distress in the past 30 days as all U.S. adults (3.2%) (Figure 3).
The age-adjusted percentage of Vietnamese adults (2.6%) with serious psychological distress in the past 30 days was similar to that of all U.S. adults (3.2%).
The age-adjusted percentages of Chinese, Filipino, Asian Indian, Korean, and Japanese adults with serious psychological distress in the past 30 days ranged from 1.1% to 1.6% and did not differ significantly from each other.The percentage of Vietnamese adults (2.6%) with serious psychological distress was higher than for other non-Hispanic Asian subgroups, but the differences were not statistically significant.
Figure 3. Age-adjusted percentage of adults aged 18 and over with serious psychological distress, by non-Hispanic Asian subgroup: United States, 2010–2014
*Estimate has a relative standard error between 30% and 50% and should be used with caution as it does not meet standards of reliability or precision.
1Significantly different than United States (p < 0.05).
2Significantly different than Vietnamese (p < 0.05).
NOTE: Access data table for Figure 3.
SOURCE: NCHS, National Health Interview Survey, 2010–2014.
Did the percentage of adults with a work limitation differ among non-Hispanic Asian subgroups?
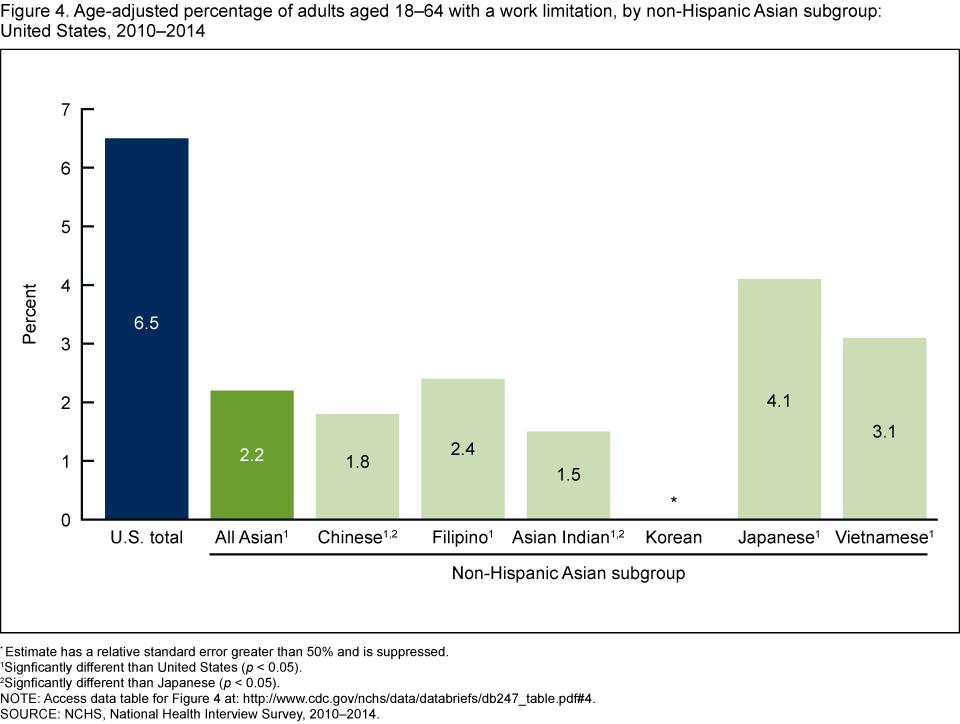
Non-Hispanic Asian adults overall (2.2%) and non-Hispanic Asian adults in each subgroup were less likely to have a work limitation than all U.S. adults (6.5%) (Figure 4).
Among non-Hispanic Asian subgroups, Chinese (1.8%) and Asian Indian (1.5%) adults were about one-half as likely as Japanese adults (4.1%) to have a work limitation.
Figure 4. Age-adjusted percentage of adults aged 18–64 with a work limitation, by non-Hispanic Asian subgroup: United States, 2010–2014
*Estimate has a relative standard error greater than 50% and is suppressed.
1Significantly different than United States (p < 0.05).
2Significantly different than Japanese (p < 0.05).
NOTE: Access data table for Figure 4.
SOURCE: NCHS, National Health Interview Survey, 2010–2014.
Did the percentage of adults who were limited in social participation vary among non-Hispanic Asian subgroups?
Overall, non-Hispanic Asian adults (3.0%) were less likely to be limited in social participation in the past 30 days than all U.S. adults (3.9%) (Figure 5).
Chinese (2.4%), Filipino (3.0%), Japanese (2.2%), and Vietnamese (2.4%) adults were less likely to be limited in social participation than all U.S. adults (3.9%). However, Korean (4.6%) and Asian Indian (4.1%) adults were similarly limited in social participation compared with all U.S. adults.
Among non-Hispanic Asian subgroups, Korean adults (4.6%) were about twice as likely as Chinese (2.4%), Japanese (2.2%), and Vietnamese (2.4%) adults to be limited in social participation.
Figure 5. Age-adjusted percentage of adults aged 18 and over with a social participation limitation, by non-Hispanic Asian subgroup: United States, 2010–2014
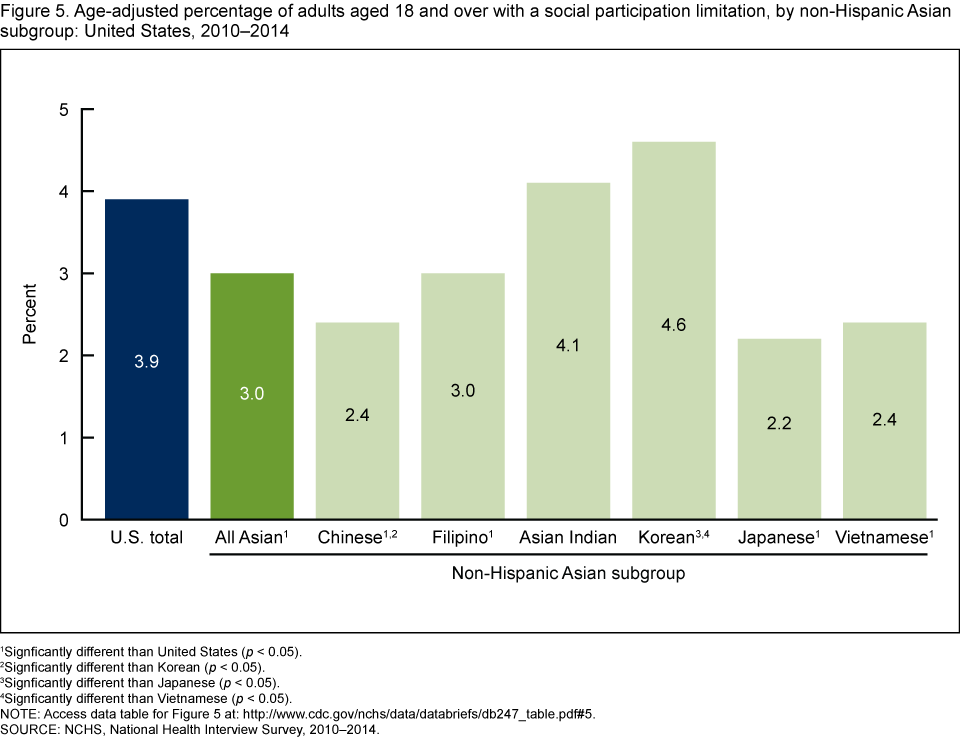
1Significantly different than United States (p < 0.05).
2Significantly different than Korean (p < 0.05).
3Significantly different than Japanese (p < 0.05).
4Significantly 68different than Vietnamese (p < 0.05).
NOTE: Access data table for Figure 5.
SOURCE: NCHS, National Health Interview Survey, 2010–2014.
Summary
In 2010–2014, non-Hispanic Asian adults were less likely than all U.S. adults to be in fair or poor health, or to have multiple chronic conditions, serious psychological distress in the past 30 days, or limitations in work or social participation. Chinese adults reported a consistent pattern of good health on all five measures in this report. Among other non-Hispanic Asian subgroups, however, no clear patterns were seen for these measures. Compared with other subgroups, Vietnamese adults were more likely to report fair or poor health, serious psychological distress, and work limitations, but were not more likely to report multiple chronic conditions or limitations in social participation. Korean adults were more likely to report having fair or poor health. Korean and Asian Indian adults were more likely to report limitations in social behavior, but neither group was more likely to have multiple chronic conditions or serious psychological distress. Japanese adults were more likely to have work limitations, and Filipino adults were more likely to have multiple chronic conditions.
Previously, substantial disparities in having health insurance coverage, health care utilization, health behaviors, and chronic disease prevalence were reported among non-Hispanic Asian subgroups (3–6). The findings of this study are consistent with these earlier analyses on non-Hispanic Asian subgroups and add to the body of evidence concerning their widely varying health. Further research is needed to better understand the differences among subgroups in health care and health care outcomes for this population.
Definitions
Fair or poor health status: Based on the response to the survey question, “Would you say your health in general is excellent, very good, good, fair, or poor?”
Multiple chronic conditions: Based on adults having been told by a health professional that they had two or more of the following conditions: hypertension, coronary heart disease, stroke, diabetes, cancer, arthritis, hepatitis, weak or failing kidneys, asthma, and emphysema and/or chronic bronchitis (7).
Serious psychological distress: Based on responses to six survey questions on how often a respondent felt sad, nervous, restless, hopeless, that everything was an effort, or worthless during the past 30 days. Response codes, 0–4, for each of the six items are summed to yield a scale with a 0–24 range, with a value of 13 or more defining serious psychological distress (8). Adults with missing data for any of the questions were excluded from this analysis (about 9% for 2010–2014).
Social participation limitation: Based on the responses “very difficult” or “can’t do at all” to either of the two questions, “By yourself, and without using any special equipment, how difficult is it for you to …Participate in social activities such as visiting friends, attending clubs and meetings, going to parties? …Go out to things like shopping, movies, or sporting events?”
Work limitation: Based on the questions, ‘‘Does a physical, mental, or emotional problem now keep [family members 18 or older] from working at a job or business?’’ and for persons not kept from working, ‘‘Are [family members 18 or older] limited in the kind or amount of work they can do because of a physical, mental, or emotional problem?’’ In this report, data on work limitation include adults aged 18–64.
Data source and methods
Data from the 2010–2014 National Health Interview Survey (NHIS) were used for this analysis. NHIS data are collected continuously throughout the year by the National Center for Health Statistics (NCHS). Interviews are conducted in respondents’ homes, but follow-ups to complete interviews may be conducted by telephone.
In 2010–2014, information was collected on 165,950 adults aged 18 and over. There were 9,813 non-Hispanic Asian adults, including 2,138 Chinese, 2,095 Filipino, 1,922 Asian Indian, 897 Korean, 865 Japanese, 795 Vietnamese, and 1,101 other Asian adults. Estimates were age-adjusted using the projected 2000 U.S. population and the following age groups: 18–44, 45–64, 65–74, and 75 and over for all data except work limitation, which were age-adjusted using age groups 18–24, 25–44, and 45–65.
NHIS is designed to yield a nationally representative sample, and this analysis used the sample adult weight to produce national estimates. Data weighting procedures are described elsewhere (9). All estimates in this report meet NCHS standards of reliability (relative standard error less than or equal to 30%), unless otherwise noted. Differences between percentages were evaluated using two-sided significance tests at the 0.05 level. The estimated standard error of the difference between total non-Hispanic Asian, non-Hispanic Asian subgroups, and total U.S. estimates accounted for nonindependence, where appropriate.
Less than 1% of NHIS interviews are conducted in languages other than English or Spanish. In these cases, often a family member translates into the respondent’s native language. During 2010–2014, about 8% of interviews were conducted in other languages for non-Hispanic Asian respondents. In addition, family respondents rated the sample adult’s ability to speak English “not well or not at all” for 16.6% of non-Hispanic Asian adults compared with 6.5% of all U.S. adults. This limitation should be considered when interpreting results in this report. For more information, visit the NHIS website.
About the authors
Barbara Bloom and Lindsey I. Black are with the National Center for Health Statistics, Division of Health Interview Statistics.
References
- Hoeffel EM, Rastogi S, Kim MO, Shahid H. The Asian population: 2010. Census 2010 Brief. Washington, DC: U.S. Census Bureau. 2012.
- Reeves TJ, Bennett CE. We the people: Asians in the United States. Census 2000 Special Reports. Washington, DC: U.S. Census Bureau. 2004.
- Chen J, Vargas-Bustamante A, Ortega AN. Health care expenditures among Asian American subgroups. Med Care Res Rev 70(3): 310–29. 2013.
- Barnes PM, Adams PF, Powell-Griner E. Health characteristics of the Asian adult population: United States, 2004–2006. Advance data from vital and health statistics; no 394. Hyattsville, MD: National Center for Health Statistics. 2008.
- Holland AT, Wong EC, Lauderdale DS, Palaniappan LP. Spectrum of cardiovascular diseases in Asian-American racial/ethnic subgroups. Ann Epidemiol 21(8): 608–614. 2011.
- Aoki Y, Yoon SS, Chong Y, Carroll MD. Hypertension, abnormal cholesterol, and high body mass index among non-Hispanic Asian adults: United States, 2011–2012. NCHS data brief, no 140. Hyattsville, MD: National Center for Health Statistics. 2014.
- Goodman RA, Posner SF, Huang ES, Parekh AK, Koh HK. Defining and measuring chronic conditions: Imperatives for research, policy, program, and practice. Prev Chronic Dis 10:E66. 2013.
- Kessler RC, Barker PR, Colpe LJ, Epstein JF, Gfroerer JC, Hiripi E, et al. Screening for serious mental illness in the general population. Arch Gen Psychiatry 60(2):184–9. 2003.
- Parsons VL, Moriarity C, Jonas K, et al. Design and estimation for the National Health Interview Survey, 2006–2015. National Center for Health Statistics. Vital Health Stat 2(165). 2014.
Suggested citation
Bloom B, Black LI. Health of non-Hispanic Asian adults: United States, 2010–2014.NCHS data brief, no 247. Hyattsville, MD: National Center for Health Statistics. 2016.
Copyright information
All material appearing in this report is in the public domain and may be reproduced or copied without permission; citation as to source, however, is appreciated.
National Center for Health Statistics
Charles J. Rothwell, M.S., M.B.A., Director
Nathaniel Schenker, Ph.D., Deputy Director
Jennifer H. Madans, Ph.D., Associate Director for Science
Division of Health Interview Statistics
Marcie L. Cynamon, Director
Stephen J. Blumberg, Ph.D., Associate Director for Science