Changes in Life Expectancy by Race and Hispanic Origin in the United States, 2013–2014
Life expectancy for non-Hispanic black males has been changed from 72.2 to 72.0 to correct a transcription error.
- Key findings
- How did life expectancy at birth by race and Hispanic origin change between 2013 and 2014?
- How did life expectancy at birth by race and Hispanic origin change for the male population between 2013 and 2014?
- How did life expectancy at birth by race and Hispanic origin change for the female population between 2013 and 2014?
- How did life expectancy at age 65 by race, Hispanic origin, and sex change between 2013 and 2014?
- Summary
- Definition
- Data source and methods
- About the author
- References
- Suggested citation
NCHS Data Brief No. 244, April 2016
Elizabeth Arias, Ph.D.
Key findings
Data from the National Vital Statistics System, Mortality
- Between 2013 and 2014, life expectancy at birth for the total U.S. population (78.8 years), males (76.4), or females (81.2) did not change.
- Life expectancy at birth increased by 0.2 years for non-Hispanic black males and by 0.1 years for Hispanic males. It remained unchanged for non-Hispanic white males.
- Life expectancy at birth increased by 0.2 years for Hispanic females, remained unchanged for non-Hispanic black females, and declined by 0.1 years for non-Hispanic white females.
- Hispanic males experienced the greatest increase in life expectancy at age 65 (0.3 years), followed by Hispanic females (0.2), and all other groups experienced a 0.1 year increase in life expectancy at age 65.
This report presents changes in life expectancy by race, Hispanic origin, and sex in the United States between 2013 and 2014. Life expectancy was estimated using complete period life tables that are based on death rates adjusted for race and Hispanic origin misclassification on death certificates (1). Life expectancy represents the average number of years that a hypothetical group of infants would live at each attained age if the group was subject, throughout its lifetime, to the age-specific death rates prevailing for the actual population in a given year (1).
Keywords: life expectancy, Hispanic origin, race, National Vital Statistics System, Mortality
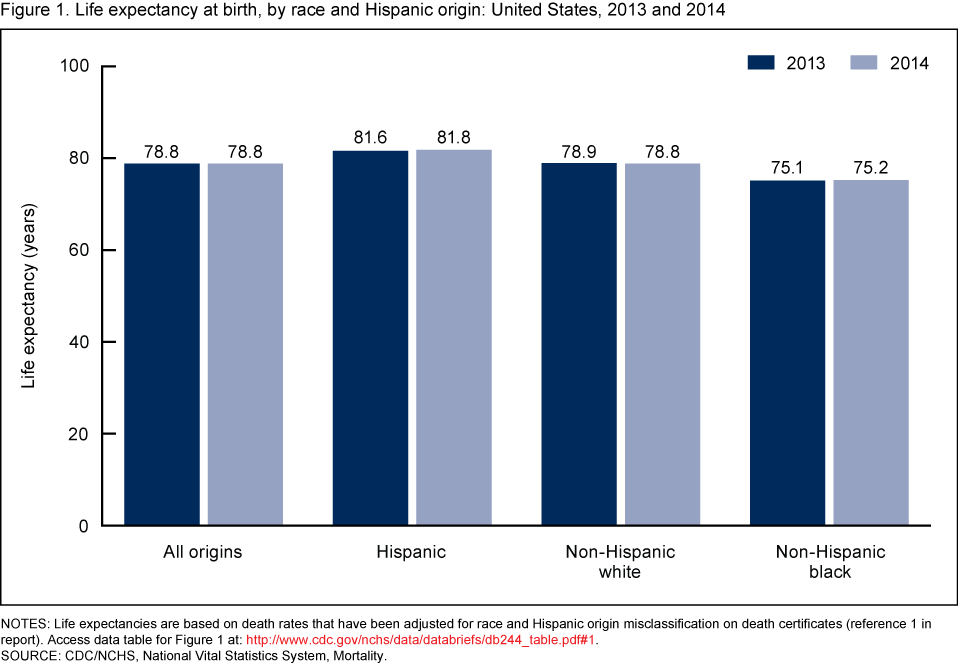
How did life expectancy at birth by race and Hispanic origin change between 2013 and 2014?
- Life expectancy at birth for the total U.S. population did not change from 78.8 years between 2013 and 2014 (Figure 1).
- Life expectancy increased by 0.2 years for the Hispanic population (from 81.6 to 81.8 years) and by 0.1 years for the non-Hispanic black population (from 75.1 to 75.2).
- In contrast, life expectancy declined for the non-Hispanic white population by 0.1 years (from 78.9 to 78.8).
Figure 1. Life expectancy at birth, by race and Hispanic origin: United States, 2013 and 2014
NOTES: Life expectancies are based on death rates that have been adjusted for race and Hispanic origin misclassification on death certificates (reference 1 in report). Access data table for Figure 1.
SOURCE: CDC/NCHS, National Vital Statistics System, Mortality.
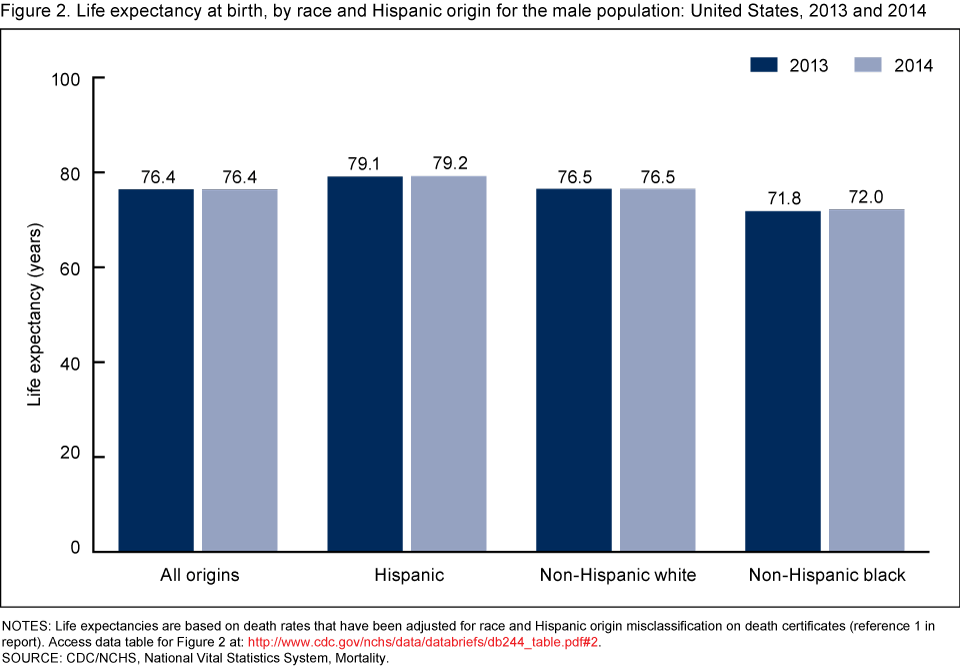
How did life expectancy at birth by race and Hispanic origin change for the male population between 2013 and 2014?
- Between 2013 and 2014, life expectancy at birth remained unchanged at 76.4 years for males (Figure 2).
- Life expectancy increased by 0.2 years for non-Hispanic black males (from 71.8 to 72.0) and by 0.1 years for Hispanic males (from 79.1 to 79.2).
- Life expectancy remained unchanged for non-Hispanic white males (76.5).
Figure 2. Life expectancy at birth, by race and Hispanic origin for the male population: United States, 2013 and 2014
NOTES: Life expectancies are based on death rates that have been adjusted for race and Hispanic origin misclassification on death certificates (reference 1 in report). Access data table for Figure 2.
SOURCE: CDC/NCHS, National Vital Statistics System, Mortality.
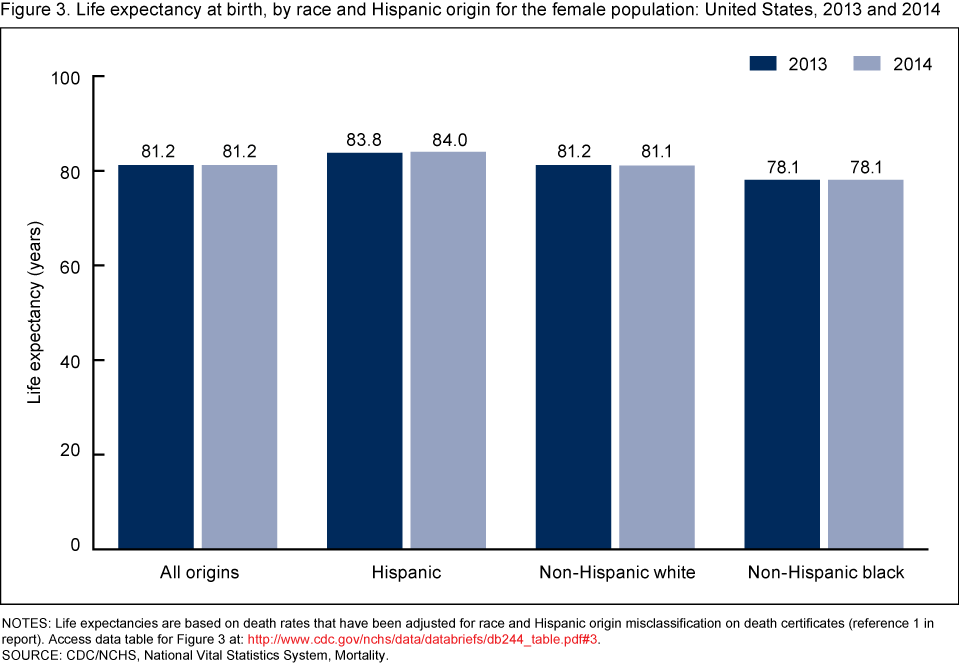
How did life expectancy at birth by race and Hispanic origin change for the female population between 2013 and 2014?
- Between 2013 and 2014, life expectancy at birth remained unchanged at 81.2 years for females (Figure 3).
- Life expectancy increased by 0.2 years for Hispanic females (from 83.8 to 84.0).
- Life expectancy remained unchanged for non-Hispanic black females (78.1).
- Life expectancy declined by 0.1 years for non-Hispanic white females (from 81.2 to 81.1).
Figure 3. Life expectancy at birth, by race and Hispanic origin for the female population: United States, 2013 and 2014
NOTES: Life expectancies are based on death rates that have been adjusted for race and Hispanic origin misclassification on death certificates (reference 1 in report). Access data table for Figure 3.
SOURCE: CDC/NCHS, National Vital Statistics System, Mortality.
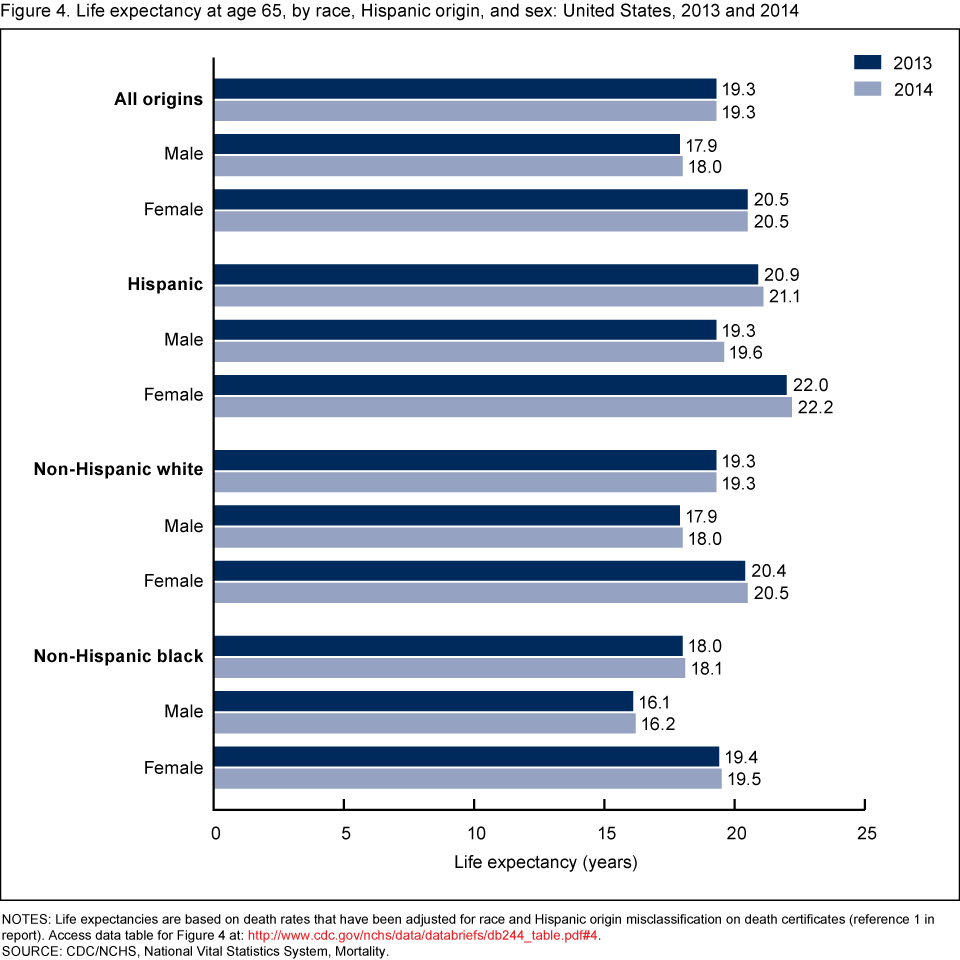
How did life expectancy at age 65 by race, Hispanic origin, and sex change between 2013 and 2014?
- Between 2013 and 2014, life expectancy at age 65 increased by 0.1 years for males (from 17.9 to 18.0) but remained unchanged for females (20.5) (Figure 4).
- Hispanic males experienced the greatest increase in life expectancy at age 65 (from 19.3 to 19.6), followed by Hispanic females (from 22.0 to 22.2).
- All other groups experienced an increase of 0.1 years in life expectancy at age 65.
Figure 4. Life expectancy at age 65, by race, Hispanic origin, and sex: United States, 2013 and 2014
NOTES: Life expectancies are based on death rates that have been adjusted for race and Hispanic origin misclassification on death certificates (reference 1 in report). Access data table for Figure 4.
SOURCE: CDC/NCHS, National Vital Statistics System, Mortality.
Summary
The trend in life expectancy at birth has been one of improvement since national estimates were first published with 1900 data (2). However, life expectancy remained constant for years 2012–2014 and declined for non-Hispanic white females by 0.1 years between 2013 and 2014. Between 2013 and 2014, non-Hispanic black males and Hispanic females experienced the greatest increase in life expectancy at birth (0.2 years), followed by Hispanic males (0.1 years). Life expectancy at birth remained unchanged for non-Hispanic white males (76.5 years) and non-Hispanic black females (78.1 years). Life expectancy at age 65 increased for both males and females of the three population groups.
Definition
Life expectancy: Represents the average number of years that a hypothetical group of infants would live at each attained age if the group was subject, throughout its lifetime, to the age-specific death rates prevailing for the actual population in a given year (1).
Data source and methods
All data are from the 2013 and 2014 mortality files from the National Vital Statistics System. The life table estimates were adjusted for race and Hispanic origin misclassification on U.S. death certificates. Life table methodology is explained in “United States Life Tables, 2011” (1).
About the author
Elizabeth Arias is with CDC’s National Center for Health Statistics, Division of Vital Statistics.
References
- Arias E. United States life tables, 2011. National vital statistics reports; vol 64 no 11. Hyattsville, MD: National Center for Health Statistics. 2015.
- Xu JQ, Murphy SL, Kochanek KD, Bastian BA. Deaths: Final data for 2013. National vital statistics reports; vol 64 no 2. Hyattsville, MD: National Center for Health Statistics. 2016.
Suggested citation
Arias E. Changes in life expectancy by race and Hispanic origin in the United States, 2013–2014. NCHS data brief, no 244. Hyattsville, MD: National Center for Health Statistics. 2016.
Copyright information
All material appearing in this report is in the public domain and may be reproduced or copied without permission; citation as to source, however, is appreciated.
National Center for Health Statistics
Charles J. Rothwell, M.S., M.B.A., Director
Nathaniel Schenker, Ph.D., Deputy Director
Jennifer H. Madans, Ph.D., Associate Director for Science
Division of Vital Statistics
Delton Atkinson, M.P.H., M.P.H., P.M.P., Director
Hanyu Ni, Ph.D., M.P.H., Associate Director for Science